



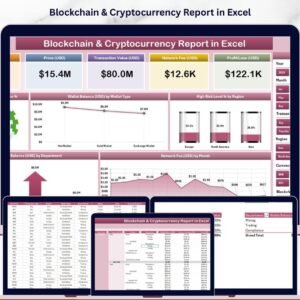
The Blockchain & Cryptocurrency Dashboard in Power BI is a real-time analytics solution designed for crypto traders, blockchain professionals, and financial analysts who need crystal-clear visibility into wallets, transactions, network fees, and profits.
In the fast-moving crypto world, every second and every transaction matters. This dashboard transforms complex blockchain data into interactive Power BI visuals — helping you track performance, costs, and trends across multiple networks in one place.
Built on Microsoft Power BI and Excel, it bridges technical blockchain operations with business-grade insights — empowering you to manage portfolios, monitor activity, and make confident, data-driven decisions.
✨ Key Features of the Blockchain & Cryptocurrency Dashboard in Power BI
✅ 📊 Overview Page – Your Crypto Command Center

View your entire blockchain ecosystem at a glance.
Includes KPI cards for total wallet balance, transaction value, profit/loss, network fees, and completion rate.
Charts cover:
Wallet Balance (USD) by Wallet Type (Hot, Cold, Exchange, Custodial etc.)
Completed Transaction % – success rate of operations
Network Fee (USD) by Department
Transaction Value (USD) by Transaction Type
💡 Get an instant, real-time snapshot of financial health and operational efficiency.
✅ 🏢 Department Analysis Page – Measure Internal Performance
Compare wallet balances, transaction volumes, and fees across departments.
Charts include:
Wallet Balance (USD) by Department
Transaction % by Department
Network Fee (USD) by Department
Completed % by Department
📈 Spot cost centers, streamline processes, and increase accountability.
✅ 🔗 Blockchain Network Analysis Page – Compare Chain Performance
Evaluate multiple blockchains (Ethereum, Bitcoin, BSC, Solana etc.).
Charts: Wallet Balance by Network, Transaction %, Network Fee, and Completed %.
⚙️ Identify the most profitable and efficient networks for your transactions.
✅ 💰 Transaction Type Analysis Page – Understand Profitability
Break down performance by activity type (Trading, Staking, Payments, Transfers).
Includes Wallet Balance, Transaction %, Profit/Loss, and Completion Rate by Type.
💡 Find which activities drive maximum profit and where improvement is needed.
✅ 📅 Monthly Trends Page – Track Growth Over Time
Analyze month-wise patterns with charts for:
Wallet Balance (USD) by Month
Transaction Value (USD) by Month
Profit/Loss (USD) by Month
📆 Spot seasonal trends, predict future movements, and plan investments strategically.
⚙️ How It Works
1️⃣ Connect your Excel transaction data or API feed to Power BI.
2️⃣ Power BI automatically updates visuals and KPIs.
3️⃣ Use filters for Wallet Type, Department, Network, or Month.
4️⃣ Drill through to view transaction-level details.
5️⃣ Share live dashboards securely via Power BI Service.
🔁 No coding required — just connect, refresh, and analyze.
👥 Who Can Use This Dashboard
💼 Crypto Exchanges – Monitor liquidity and network fees.
💸 DeFi Platforms – Analyze staking returns and pool performance.
🏦 Corporate Treasury Teams – Manage wallet holdings and profitability.
🧠 Data Analysts – Visualize multi-chain transactions for research.
📊 Crypto Investors – Track portfolio value and monthly returns.
💡 Advantages of Blockchain & Cryptocurrency Dashboard in Power BI
✅ Unified Visibility – All wallets, fees, and profits in one place.
✅ Real-Time Analytics – Live updates via Excel or API connections.
✅ Data Transparency – Instantly view every transaction and network fee.
✅ Actionable Insights – Track costs and performance by network or department.
✅ Automation & Scalability – Refresh data automatically as operations grow.
✅ Customizable KPIs – Modify metrics or add new blockchains easily.
⚡ From individual traders to enterprise teams, this dashboard delivers clarity, control, and confidence.
🧠 Best Practices
✔️ Validate input data for accuracy.
✔️ Schedule auto-refresh for live insights.
✔️ Standardize currency values (USD, BTC, ETH).
✔️ Use Power BI themes for brand consistency.
✔️ Restrict sensitive wallet data via role-based permissions.
🎥 Learn More
Visit our YouTube channel for step-by-step tutorials on how to use the Blockchain & Cryptocurrency Dashboard in Power BI.
🔗 Click here to read the Detailed blog post
Watch the step-by-step video tutorial:
What’s Inside
- Overview page: wallet balance, transaction value, profit or loss, network fees and completion rate
- Department Analysis page
- Blockchain Network Analysis page
- Transaction Type Analysis page
- Monthly Trends page
Compatibility and Requirements
- Opens in Power BI Desktop, which is free. See Get Power BI Desktop.
- Data comes from an Excel transaction file connected to Power BI. Refresh the file to update the visuals.
Frequently Asked Questions
Which wallet types does it compare?
Wallet balance is shown by wallet type, such as hot, cold, exchange and custodial wallets.
Can I compare blockchain networks?
Yes. The Blockchain Network Analysis page shows wallet balance, transaction %, network fee and completed % for networks such as Ethereum, Bitcoin, BSC and Solana.
Which activities can I analyze?
The Transaction Type page breaks results down by trading, staking, payments and transfers, including profit or loss and completion rate for each.
How do I filter the data?
Use the filters for wallet type, department, network or month. You can also drill through to transaction-level details.
Is there an Excel or Google Sheets version?
Yes. See the Blockchain & Cryptocurrency Dashboard in Excel and the Blockchain and Cryptocurrency Dashboard in Google Sheets.
Related Crypto Templates
- Blockchain & Cryptocurrency Dashboard in Excel: the same dashboard in Excel
- Blockchain and Cryptocurrency Dashboard in Google Sheets: the Google Sheets edition
- Blockchain & Cryptocurrency KPI Dashboard in Power BI: monthly crypto KPIs against targets in Power BI
- Blockchain Finance Dashboard in Power BI: finance analysis for blockchain businesses
- Power BI Dashboard Mega Collection: 15 Power BI dashboard templates in one download
Browse all Power BI dashboards.




























Reviews
There are no reviews yet.