

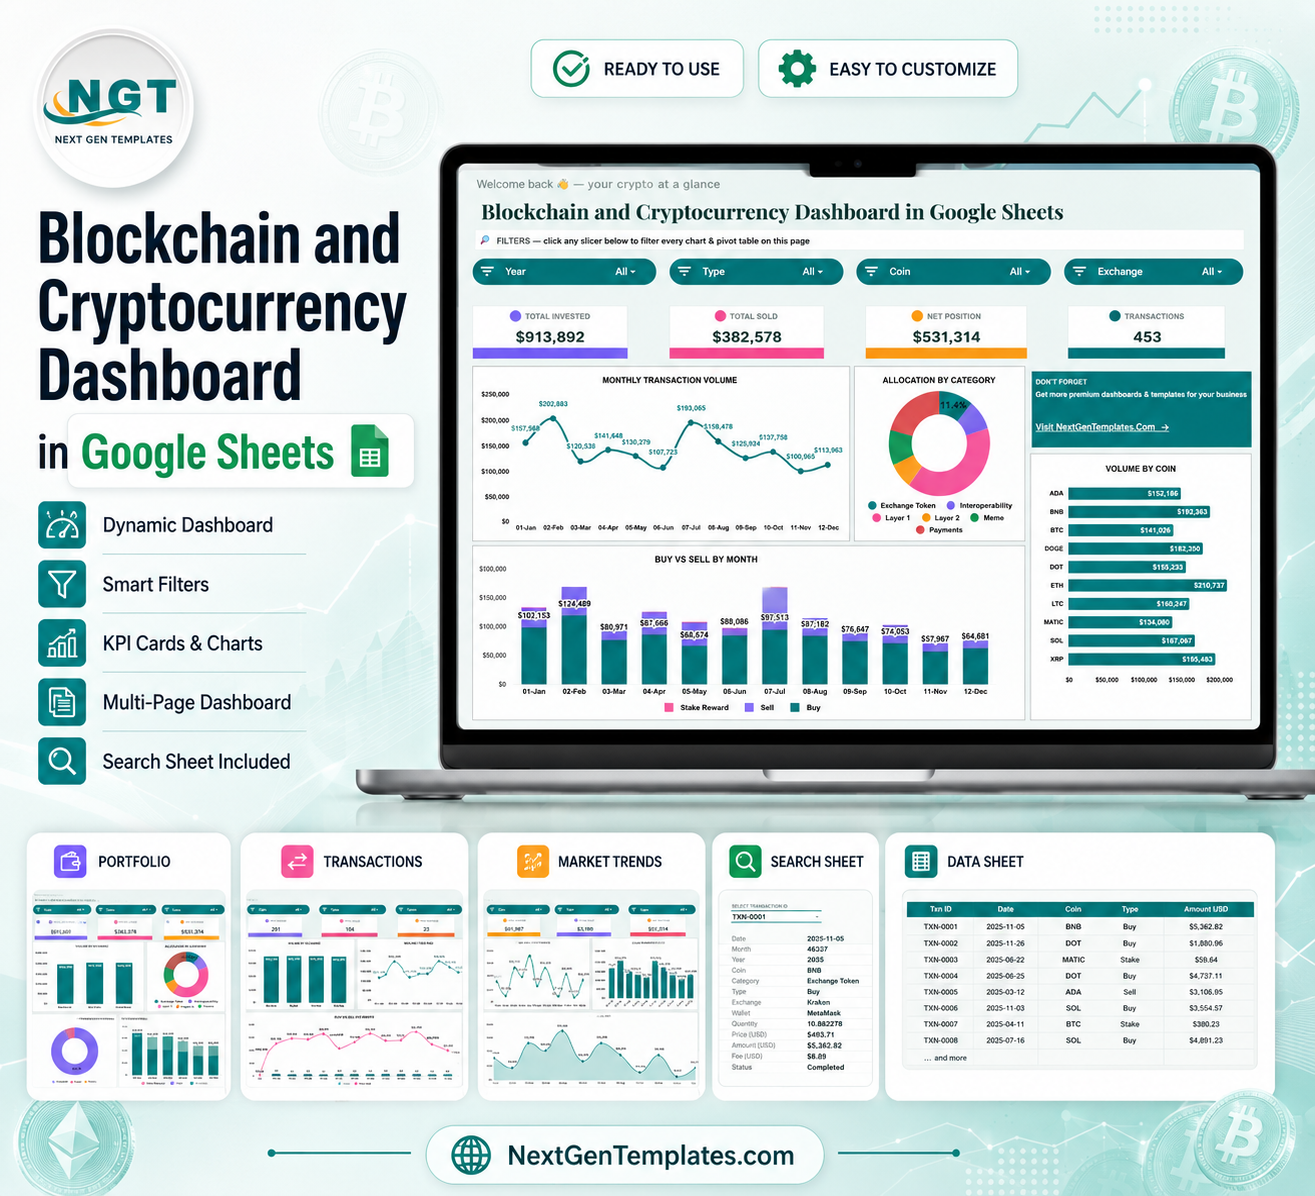
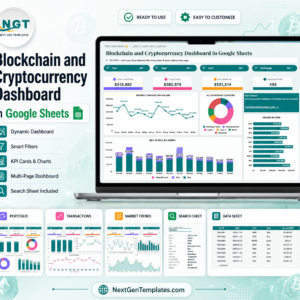
Blockchain and Cryptocurrency Dashboard in Google Sheets gives crypto teams, investors, analysts, and finance users a 6-sheet dashboard system for tracking transactions, portfolio allocation, fees, wallet value, and market trends in one editable workbook. Crypto markets run 24 hours a day, 7 days a week, so this template keeps the review process organized with 4 high-level cards, 16 chart views, multiple slicers, a transaction search page, and a structured data sheet. Built by PK, a Microsoft Certified Professional with 15+ years of spreadsheet experience and 300K+ subscribers across YouTube channels, this is a one-time purchase with no subscription and no per-user software fee.
Blockchain and Cryptocurrency Dashboard in Google Sheets
Key Features of Blockchain and Cryptocurrency Dashboard in Google Sheets
- Overview cards: Track Total Invested, Total Sold, Net Position, and Transactions at the top of the main dashboard.
- Multiple dashboard pages: Review Overview, Portfolio, Transactions, Market Trends, Search, and Data tabs from one Google Sheets file.
- Interactive slicers: Filter charts quickly by fields such as coin, category, exchange, wallet, type, and status.
- Transaction analytics: Monitor monthly activity, buy and sell amounts, exchange volume, fee trends, and transaction status.
- Portfolio visibility: Compare value by wallet, category allocation, activity by coin, and category mix over time.
- Market trend review: Track BTC and ETH average price by month, stake rewards, and average price by coin.
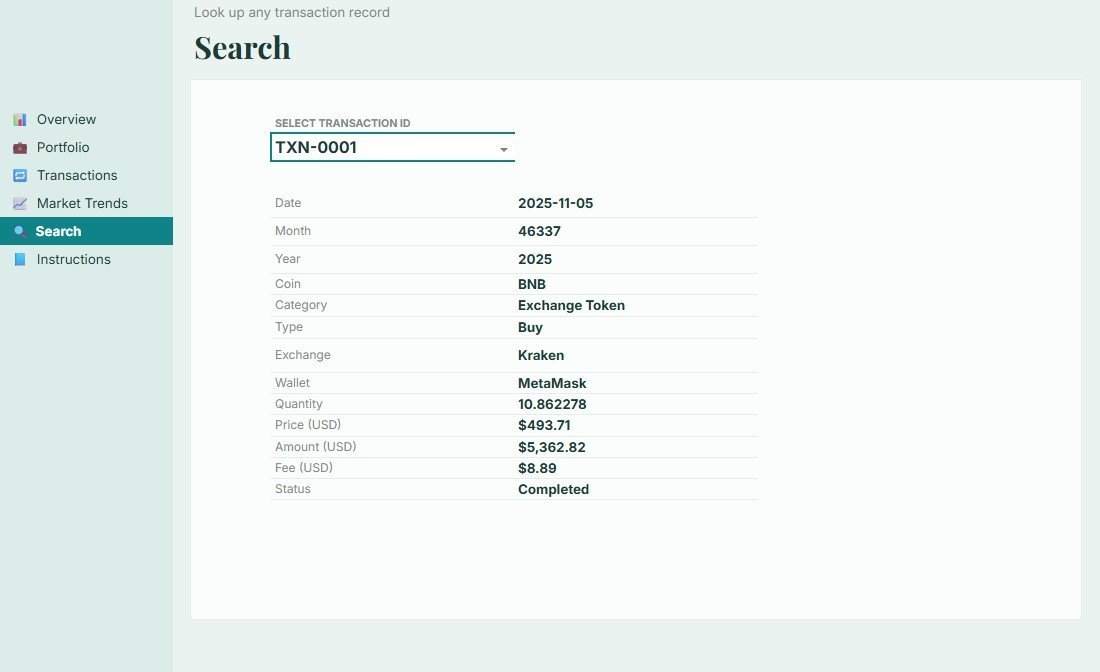
- Search sheet included: Select a transaction ID and instantly review the matching transaction record.
What’s Inside the Blockchain and Cryptocurrency Dashboard in Google Sheets
1 – Overview Page
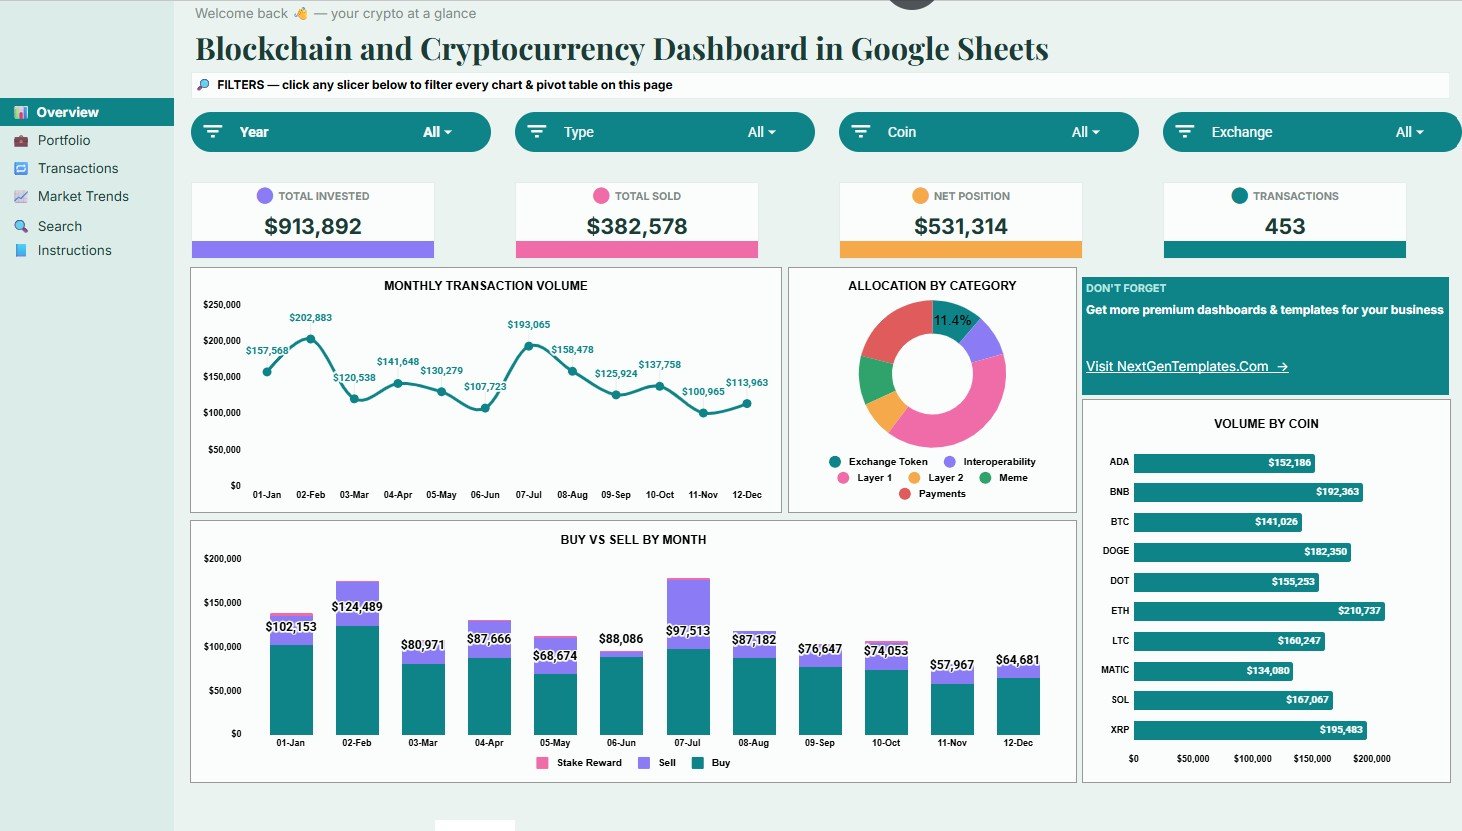
The Overview Page gives a fast executive snapshot with Total Invested, Total Sold, Net Position, and Transactions cards. The dashboard also includes slicers so users can filter the page quickly without touching formulas.
Transaction Volume by Month: This chart shows how transaction activity changes month by month. It helps users spot busy trading periods, quieter months, and seasonality in crypto activity.
Allocation by Category: This chart shows how value is distributed across categories such as Bitcoin, Ethereum, stablecoins, DeFi, or custom groups. It helps users see concentration risk and diversification at a glance.
Volume by Coin: This chart compares activity by individual coin. It makes it easier to identify which assets drive most of the recorded movement.
Buy and Sell Amount by Month: This chart compares monthly buy value against sell value. It helps users understand whether the portfolio is accumulating, reducing, or rotating positions.
2 – Portfolio
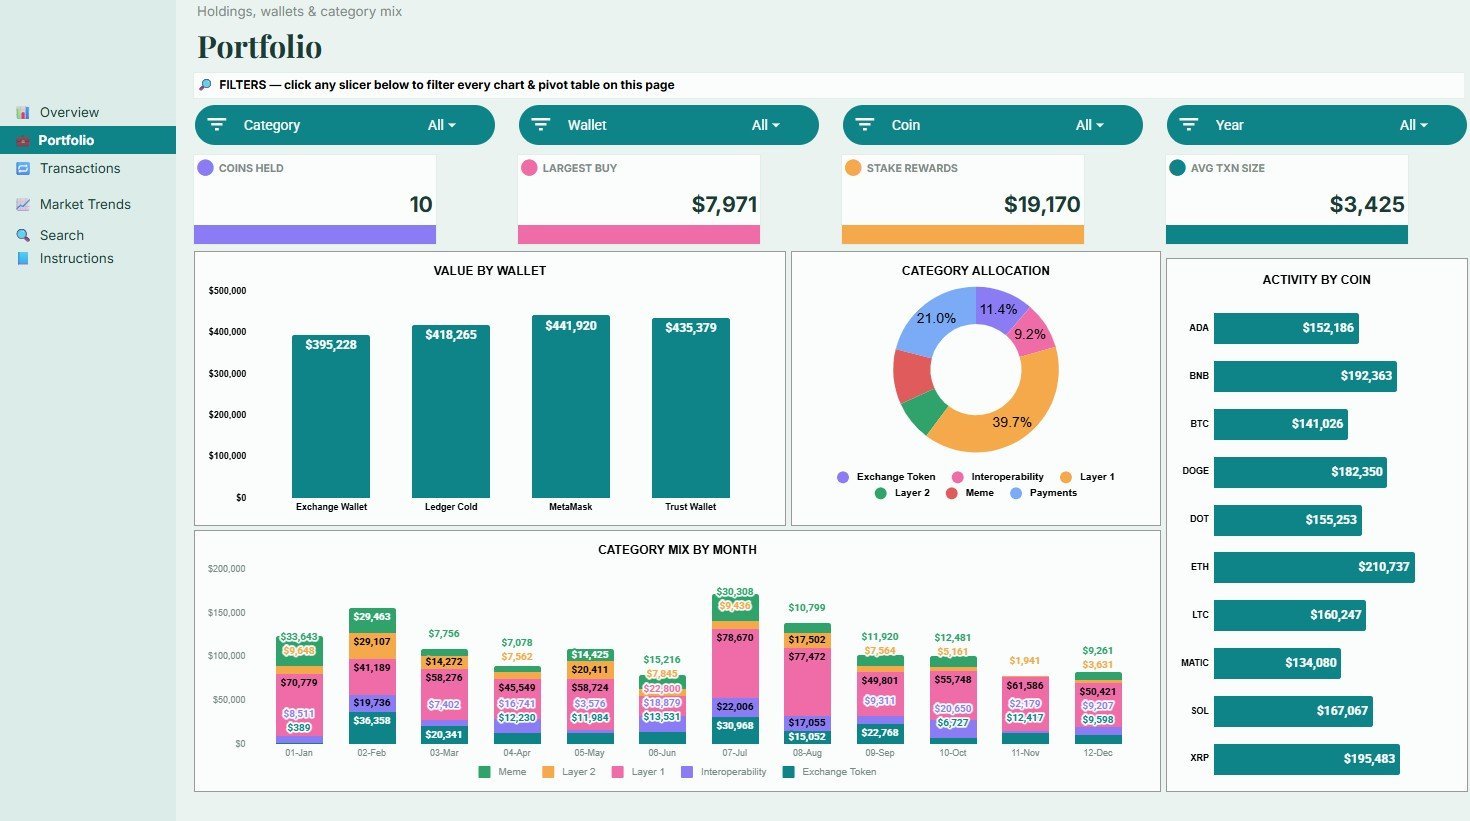
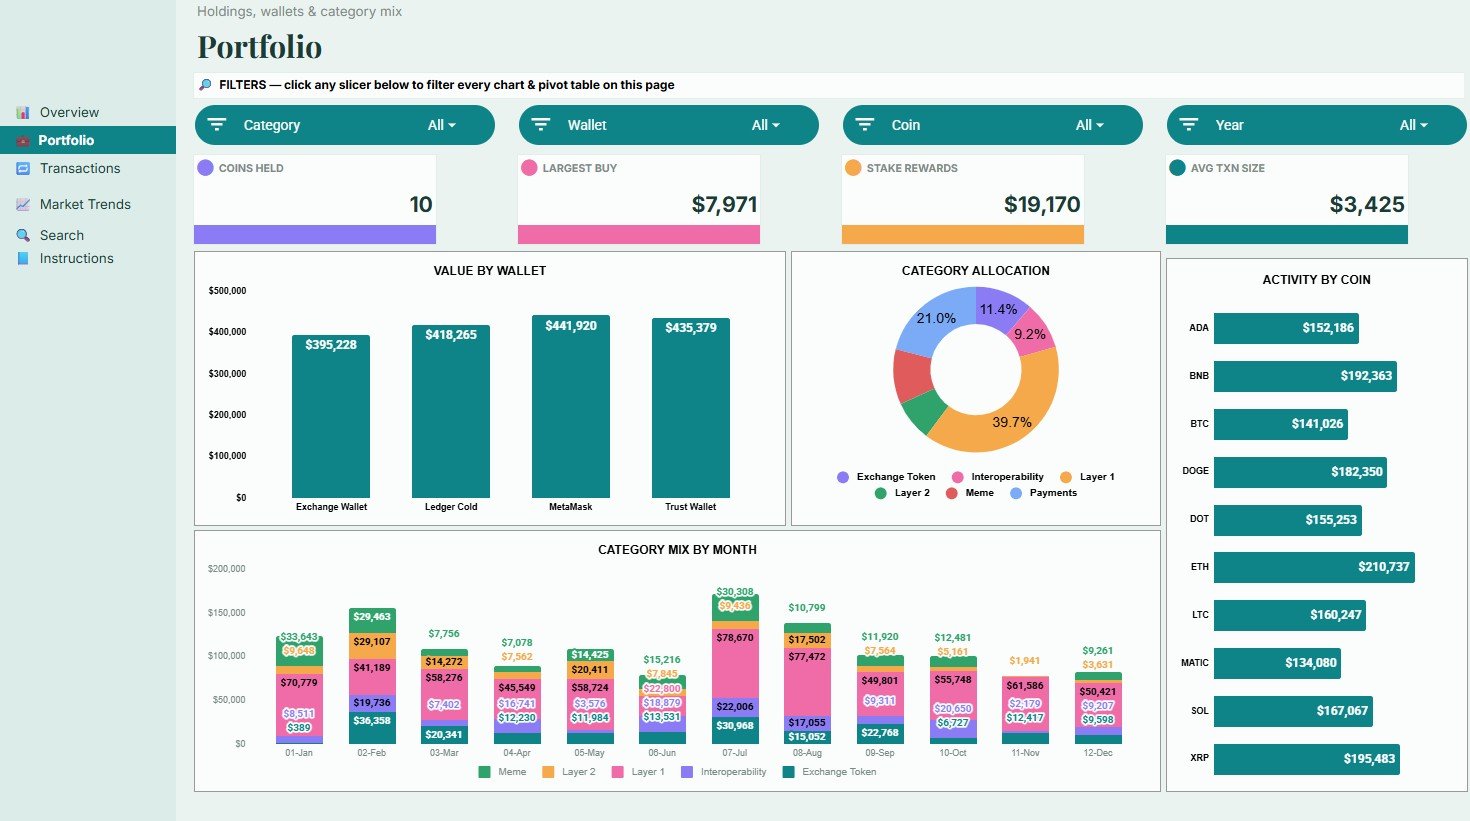
The Portfolio tab focuses on wallet value, category exposure, and coin activity. It is useful for reviewing where crypto value is held and how allocation changes over time.
Portfolio
Value by Wallet: This chart compares value across exchange wallets, cold wallets, hot wallets, or custom wallet names. It helps users review custody spread and wallet concentration.
Allocation by Category: This chart summarizes portfolio exposure by category. It gives a clear view of whether value is weighted toward major coins, altcoins, staking assets, or other groups.
Activity by Coin: This chart shows which coins generate the most recorded activity. It supports quick review of high-touch assets versus long-term holdings.
Category Mix by Month: This chart shows how category exposure changes over monthly periods. It is useful for seeing portfolio rotation and shifts in strategy.
3 – Transactions
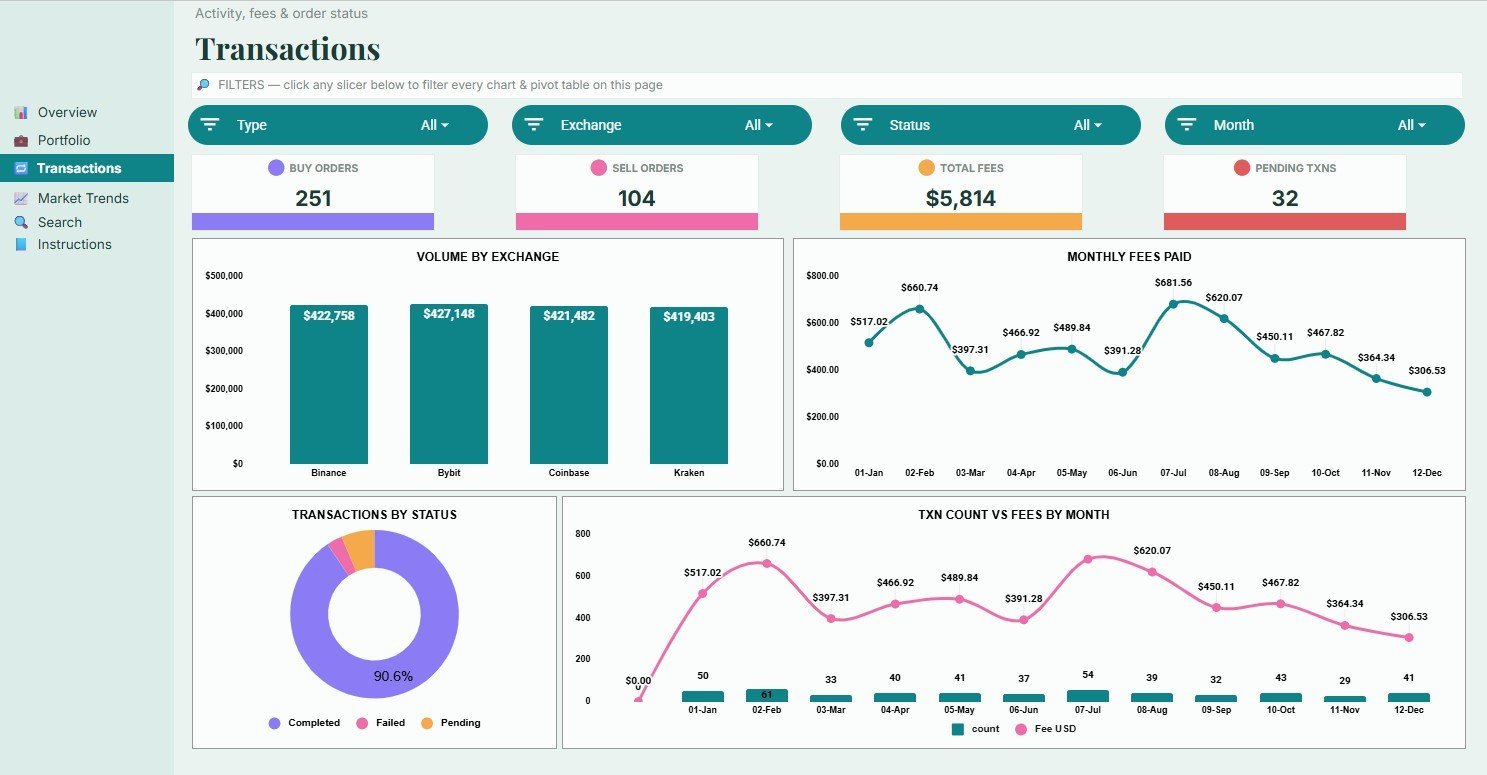
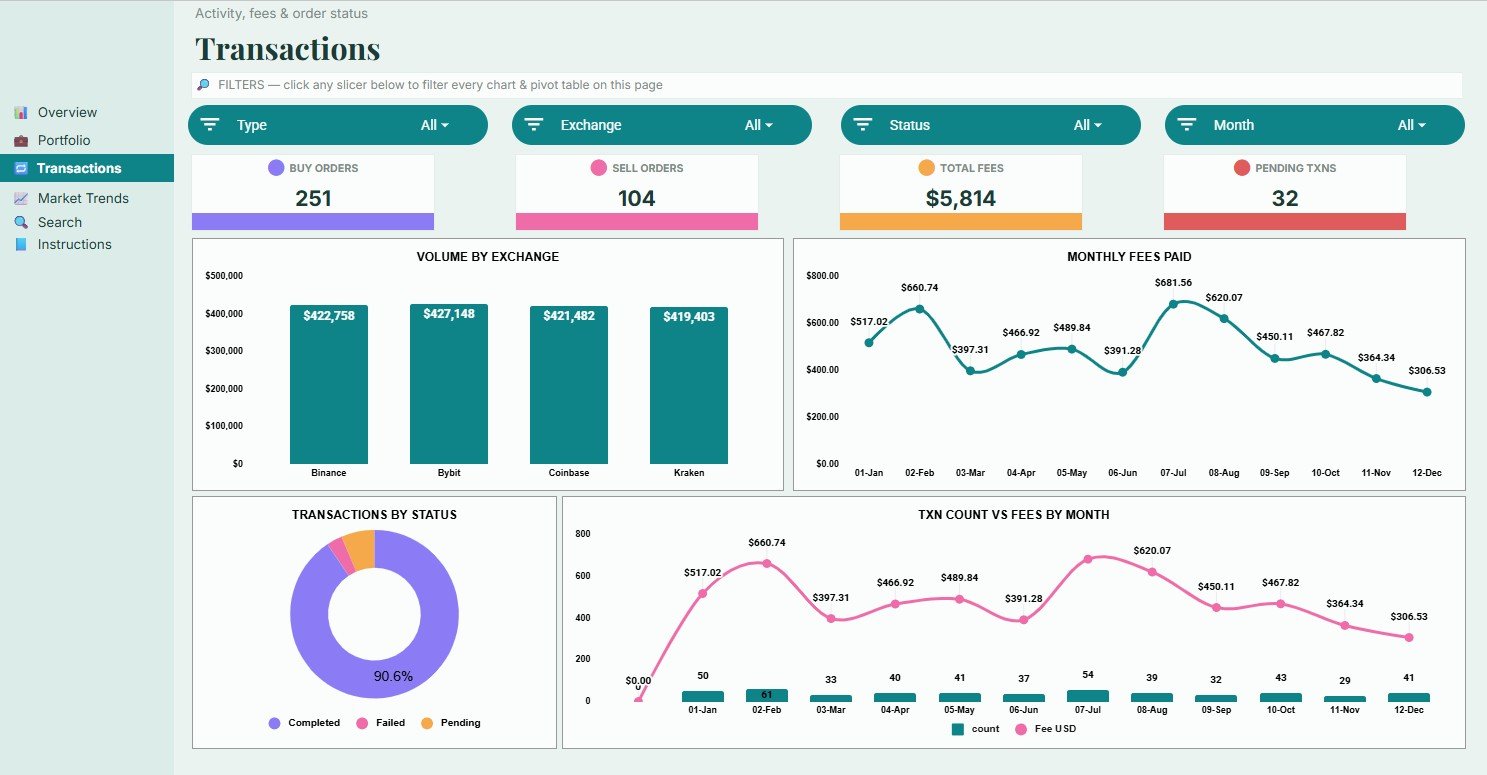
The Transactions tab turns raw transaction rows into exchange, fee, and status analysis. It helps users find operational patterns that are easy to miss in a long ledger.
Transactions
Volume by Exchange: This chart compares transaction volume across exchanges or platforms. It helps users see where most buying, selling, or transfer activity happens.
Monthly Fees Paid by Month: This chart tracks fee spend over time. It helps users see when transaction costs are rising and whether fees are linked to busier months.
Transactions by Status: This chart breaks activity into completed, pending, failed, or custom status values. It gives a quick quality check on transaction processing.
Txn Count and Fees by Month: This combined view compares transaction count with monthly fees. It helps users understand whether higher fees come from more transactions or from costlier transactions.
4 – Market Trends
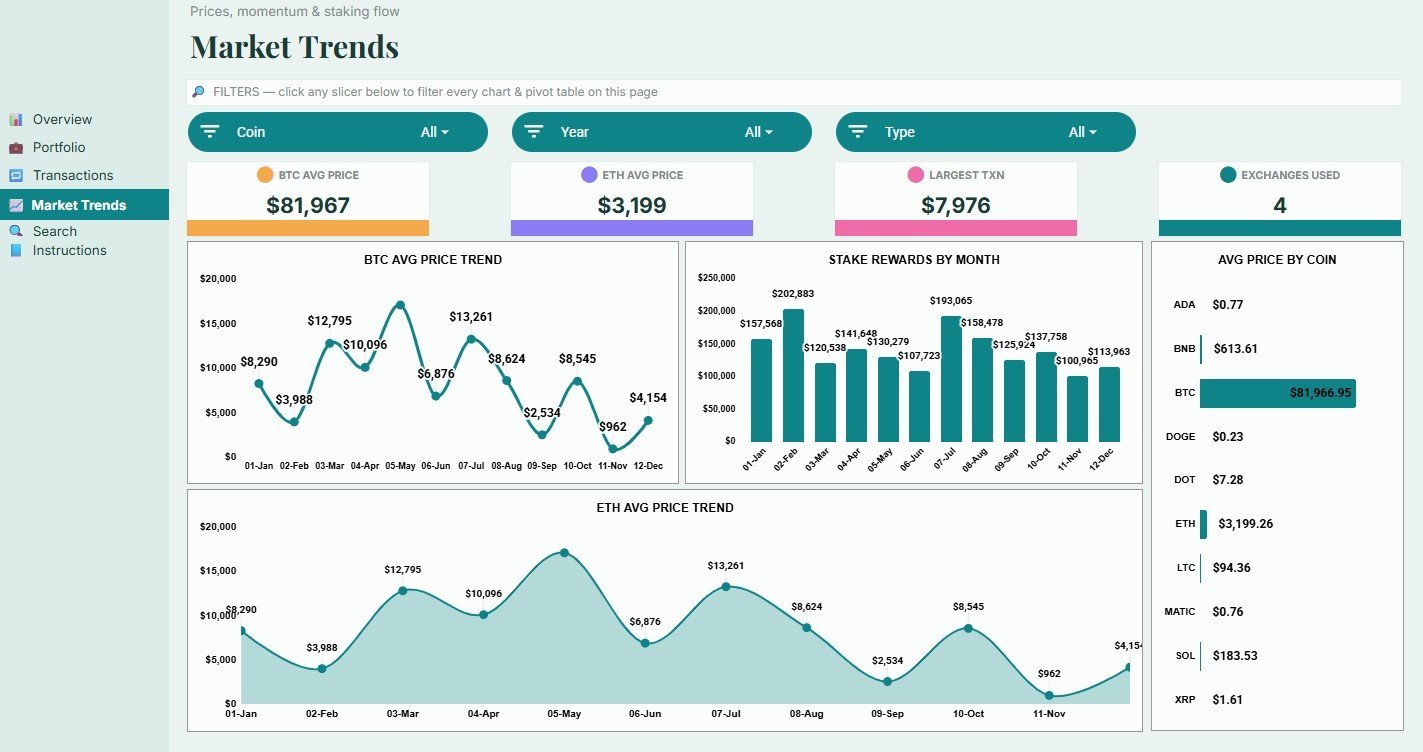
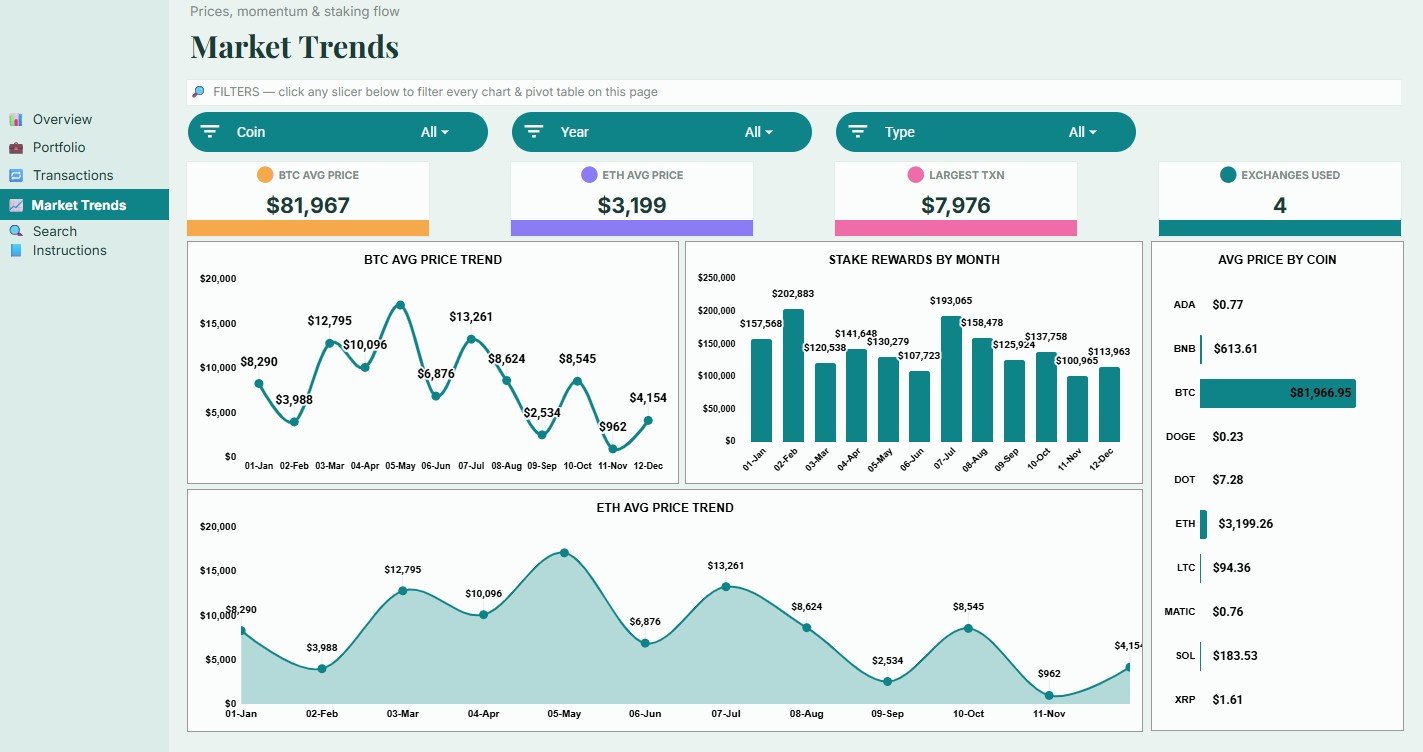
The Market Trends tab gives supporting price and reward views for crypto review. It is designed for users who want transaction analytics and simple market context in the same workbook.
Market Trends
BTC Avg Price by Month: This chart tracks the average Bitcoin price by month based on the data entered. It helps users compare portfolio activity with Bitcoin market movement.
Stake Rewards by Month: This chart summarizes staking rewards over monthly periods. It helps users review passive income from staking without searching through transaction rows.
Average Price by Coin: This chart compares average price levels across coins in the dataset. It supports simple price benchmarking across the tracked assets.
ETH Avg Price by Month: This chart tracks the average Ethereum price by month. It gives market context for users who hold or transact in ETH.
5 – Search Sheet Tab
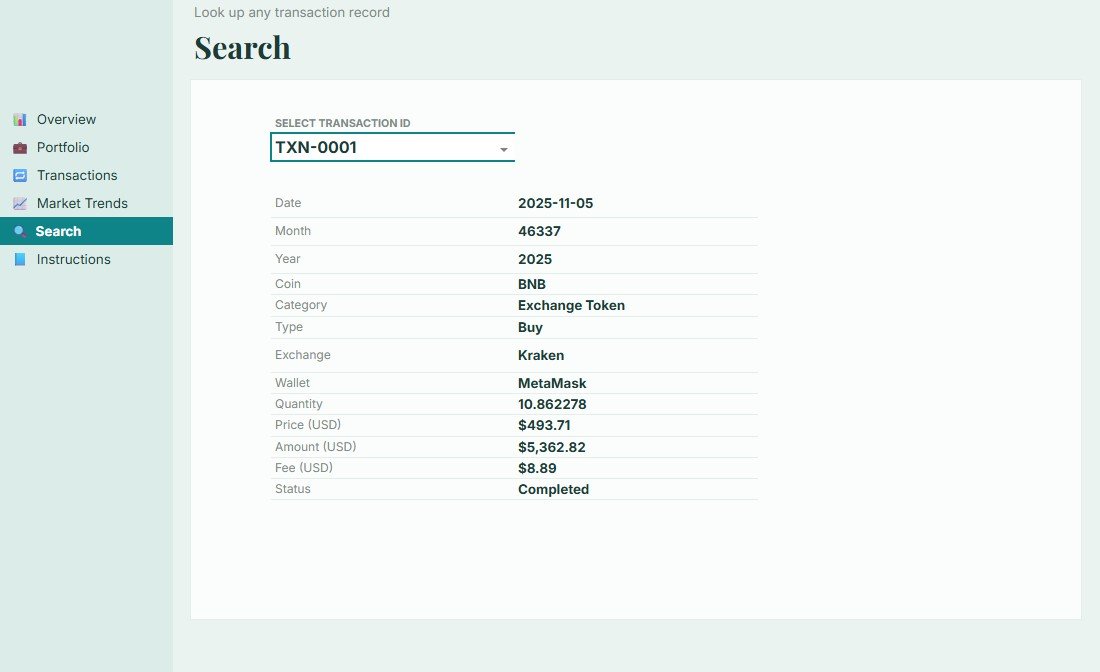
The Search Sheet lets users select a transaction ID and review the complete matching record, including date, coin, category, type, exchange, wallet, quantity, price, amount, fee, and status.
Search Sheet tab
6 – Data Sheet Tab
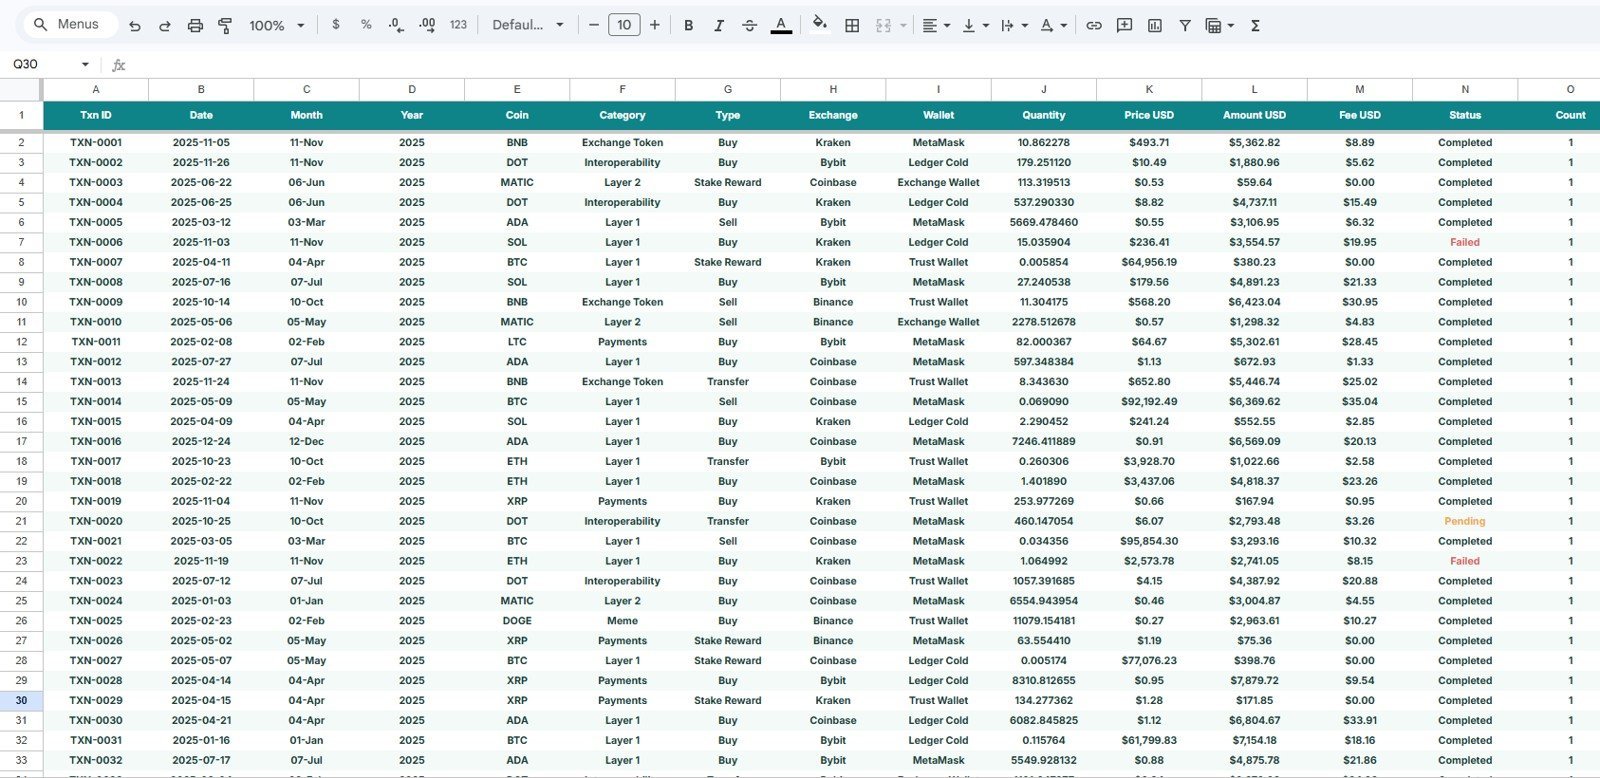
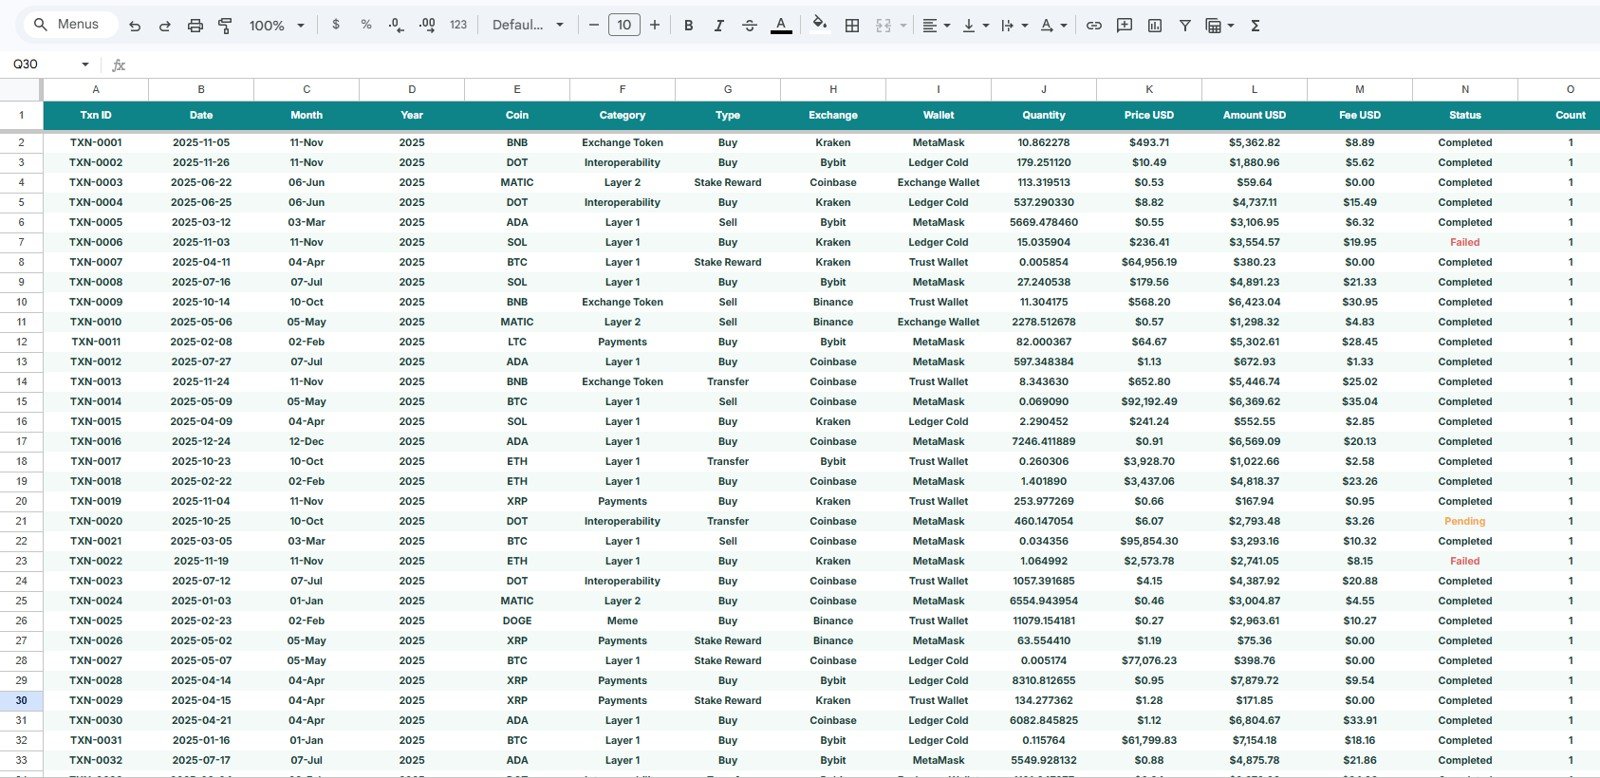
The Data Sheet is where users enter or paste transaction records in the same format as the sample data. The dashboard pages read from this sheet, so keeping the columns consistent helps every card, chart, slicer, and search result update correctly.
Data Sheet tab
Blockchain and Cryptocurrency Dashboard in Google Sheets vs. Microsoft Excel Dashboard vs. Paid CRM/SaaS – Where This Fits
| Feature | This Google Sheets Dashboard | Microsoft Excel Dashboard | Paid Crypto SaaS |
|---|---|---|---|
| Cost | $9.99 one-time sale price | One-time template or manual workbook build | Usually recurring subscription |
| Platform | Google Sheets in Drive | Excel desktop or web | Vendor-hosted web app |
| Setup time | Copy the template, update data, use slicers | Open workbook or rebuild charts manually | Create account, connect sources, configure settings |
| Real-time team collaboration | Google Sheets sharing permissions | Depends on Microsoft 365 sharing setup | Depends on provider and plan |
| Mobile access | Google Sheets app or browser | Excel mobile app or browser | Usually available through the provider app |
| Customizable fields | Edit categories, wallets, exchanges, and statuses | Editable if workbook is unlocked | Often limited by provider schema |
| Share with link | Yes, controlled by Drive permissions | Yes, controlled by Microsoft sharing | Usually account based |
| Year-1 cost at 5 users | $9.99 before any Google Workspace costs | Template cost plus any Microsoft licensing | Varies by provider and subscription tier |
| Transaction search | Included through Search Sheet tab | Possible with formulas or filters | Usually included but less editable |
| Market trend views | BTC, ETH, average price, and stake rewards charts | Requires similar chart setup | May include live pricing depending on provider |
Who This Template Is For – and Who It’s Not For
This template is for individual crypto investors, blockchain analysts, finance teams, Web3 founders, accountants, and spreadsheet users who want a structured Google Sheets dashboard for transaction and portfolio review. It is a good fit when you prefer an editable file, transparent formulas, and manual control over your records.
It is not the right tool if you need live exchange API sync, automated tax filing, wallet custody controls, on-chain AML screening, or real-time institutional risk monitoring. Use a specialist platform for those needs and use this dashboard as an editable reporting layer.
How to Use the Blockchain and Cryptocurrency Dashboard in Google Sheets
- Open the PDF guide from your purchase and create your own Google Sheets copy.
- Go to the Data Sheet tab and replace the sample transaction records with your own data.
- Keep the columns in the same order so the dashboard formulas and search view continue to work.
- Use slicers on the Overview, Portfolio, Transactions, and Market Trends pages to filter the visuals.
- Select a transaction ID on the Search Sheet tab when you need a full transaction lookup.
- Review the dashboard before monthly reporting, portfolio reviews, tax-prep handoffs, or client updates.
Real-World Use Cases
Aarav, a retail crypto investor: reviews net position and transaction volume every weekend so he can see whether he is accumulating or selling over time.
Maya, a finance analyst at a Web3 startup: uses the Transactions page to compare fee spend by month and exchange before preparing a monthly treasury review.
Daniel, a crypto accounting consultant: uses the Search Sheet tab to find individual transaction IDs quickly when reconciling client records.
Frequently Asked Questions
Does this dashboard work in Google Sheets?
Yes. The Blockchain and Cryptocurrency Dashboard in Google Sheets is designed to be copied into your own Google Drive account and edited in Google Sheets.
Does it connect directly to exchanges or wallets?
No. This is a manual Google Sheets dashboard. You enter or paste transaction records into the Data Sheet tab, which keeps the template simple and avoids requiring exchange login access.
What cards are shown on the Overview page?
The Overview page includes Total Invested, Total Sold, Net Position, and Transactions cards for high-level cryptocurrency tracking.
Can I customize coins, wallets, exchanges, and categories?
Yes. You can edit the values in your copied Google Sheet and use the same column structure to keep the charts and slicers working.
Is this a tax calculation product?
No. It can organize transaction and portfolio information, but it is not tax advice and does not replace a qualified tax professional or crypto tax software.
Can I share this dashboard with my team?
Yes. Since it runs in Google Sheets, you can share your copied file through Google Drive permissions.
About the Author
Built by PK – Microsoft Certified Professional with 15+ years of Excel, Google Sheets, and Power BI experience. Founder of NextGenTemplates, reaching 300K+ subscribers across YouTube channels. Every template is hand-built and tested before release.
Explore Related Templates
You may also like Crypto Portfolio Dashboard in Google Sheets, Crypto Portfolio Tracker in Google Sheets, Blockchain & Cryptocurrency Report in Excel, and Blockchain & Cryptocurrency Dashboard in Power BI. Browse more Google Sheets Dashboard Templates and Google Sheets Financial Tools.
Watch the step-by-step video Demo:
Download the Blockchain and Cryptocurrency Dashboard in Google Sheets to organize crypto transactions, portfolio allocation, exchange activity, fees, and market trend views in one editable dashboard.
Last updated: August 6, 2026.
































Reviews
There are no reviews yet.