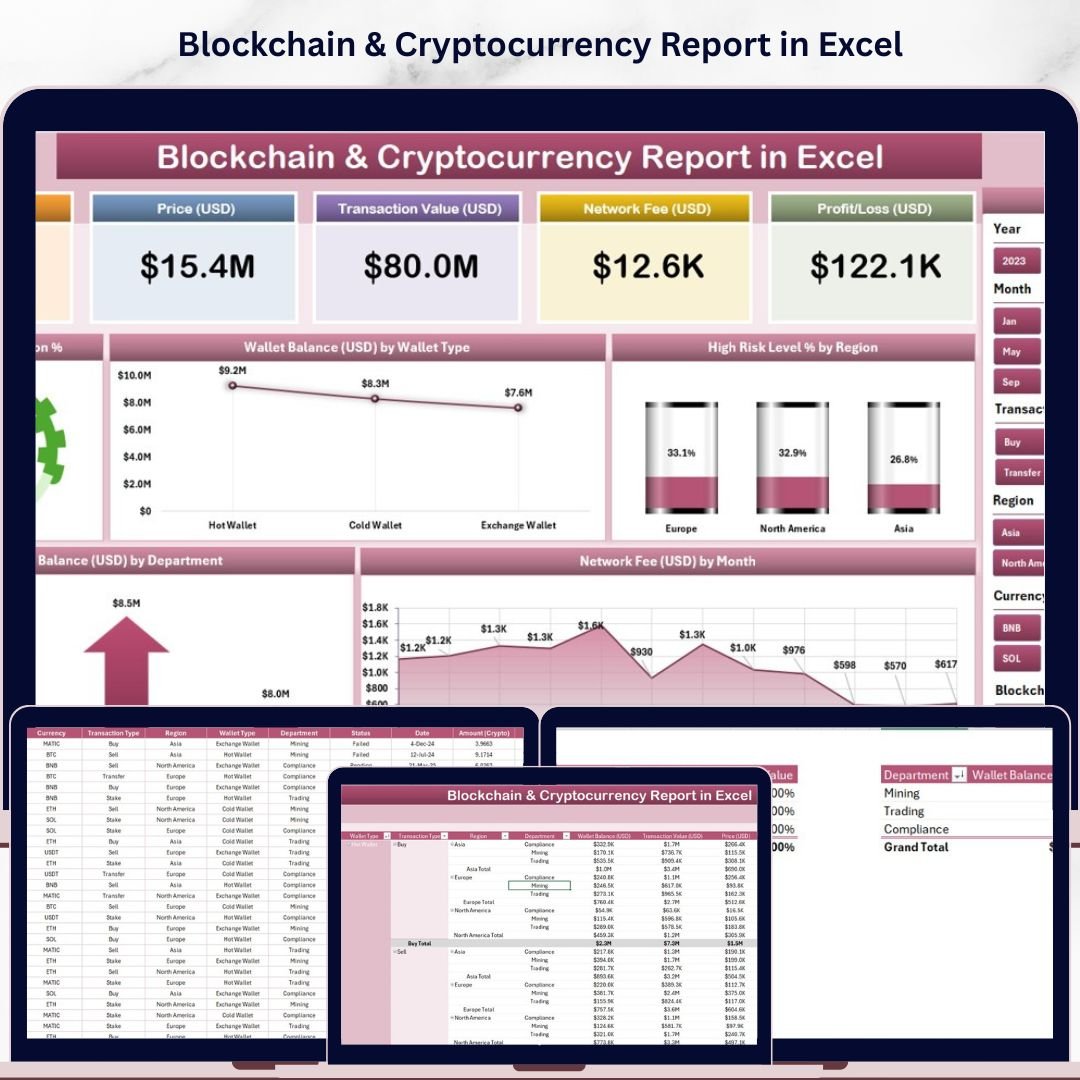
The Blockchain & Cryptocurrency Report in Excel tracks 5 transaction KPIs across 3 interactive report pages, with 5 pre-built charts covering completed transaction rates, wallet balances, risk levels by region, and monthly network fees. Setup takes under 10 minutes — replace the sample data and every chart and metric updates automatically.
🌍 Join 8,400+ teams in 40+ countries using NextGenTemplates to replace paid SaaS tools with one-time-purchase Excel, Google Sheets, Power BI, and HTML templates.
✅ Instant download · One-time payment · No subscription · No per-user fees · Lifetime access
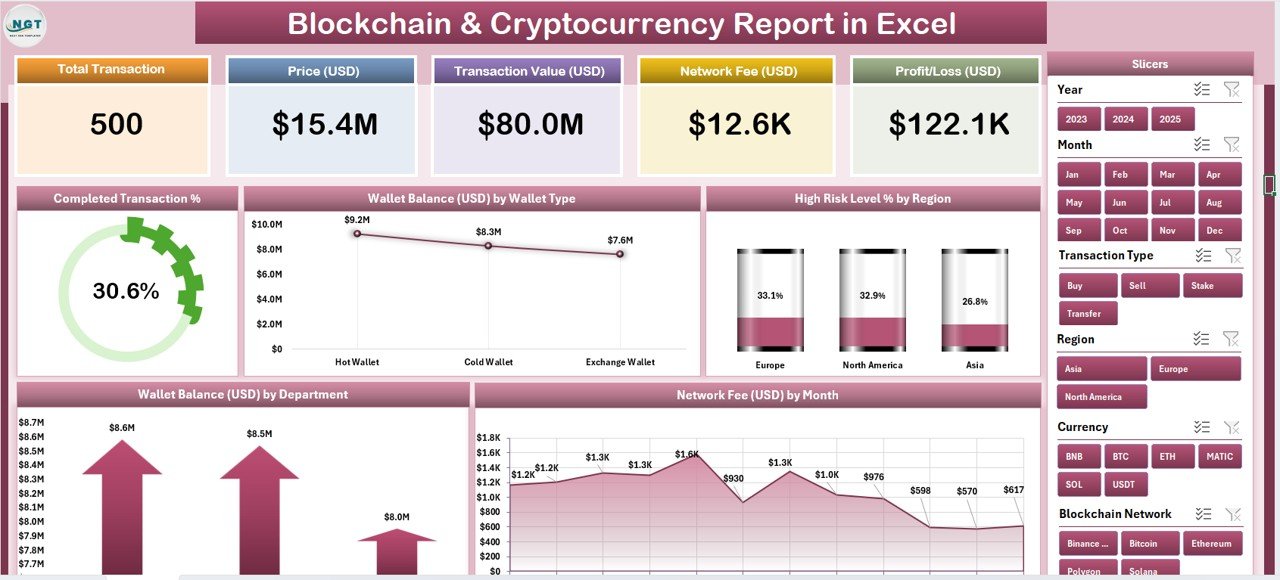
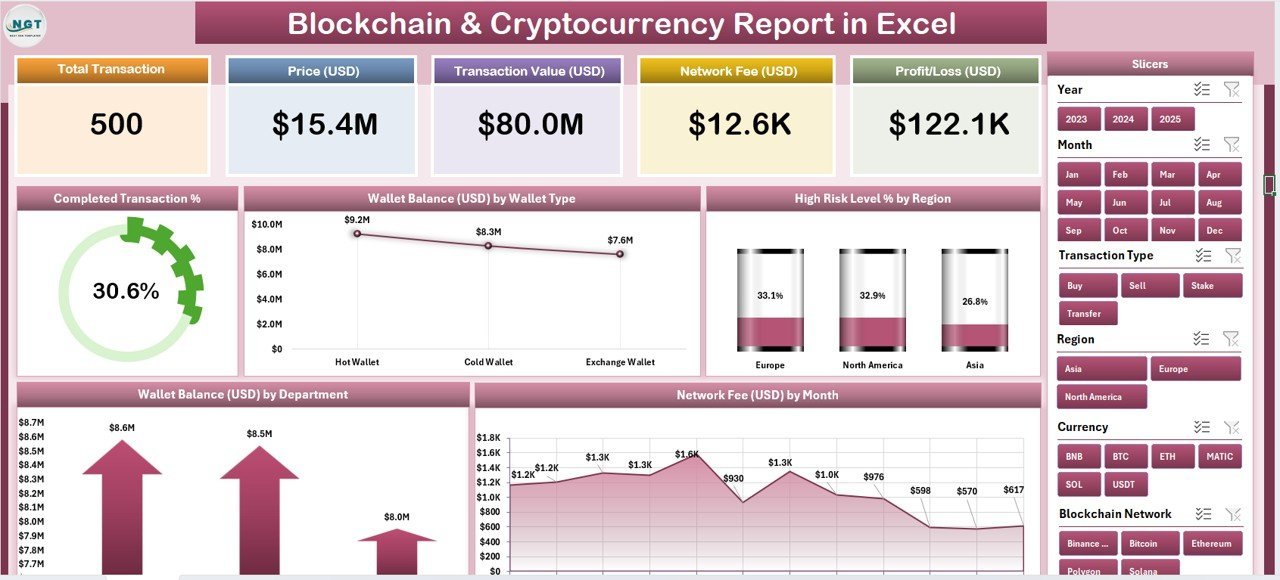
Summary Page — KPI Cards, Slicers, and 5 Charts
🔑 Key Features of the Blockchain & Cryptocurrency Report in Excel
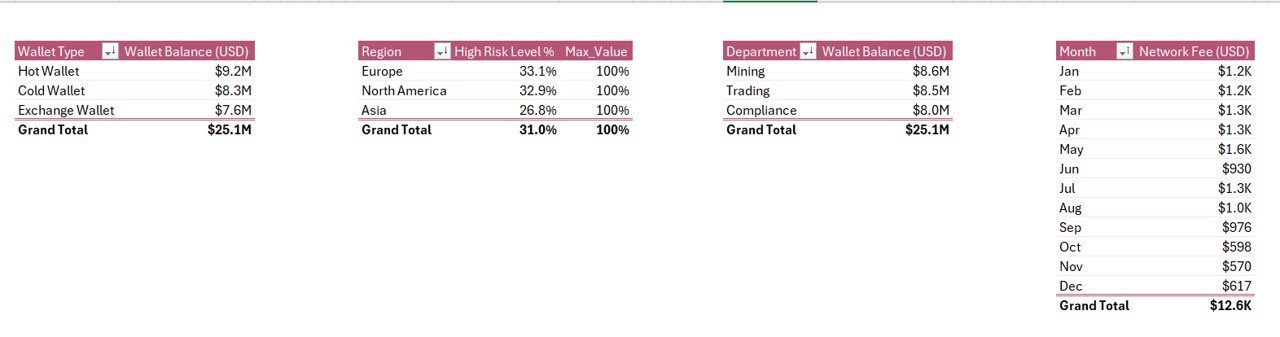
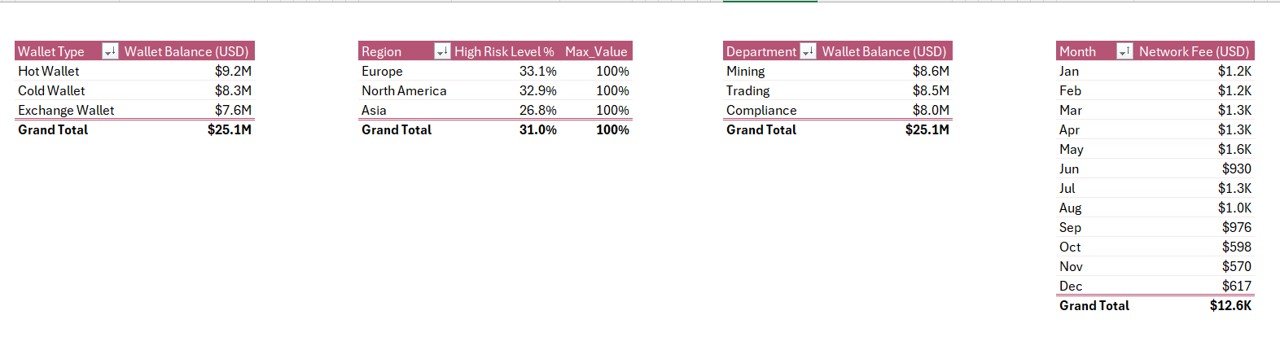
📊 5 Pre-Built Analytical Charts — This report delivers five targeted blockchain visualizations: Completed Transaction %, Wallet Balance by Wallet Type, High Risk Level % by Region, Wallet Balance by Department, and Network Fee by Month. Each chart is linked to the data sheet and refreshes instantly when new transaction data is entered — giving finance and compliance teams a real-time visual read on blockchain operations.
🃏 5 KPI Summary Cards — The Summary page opens with five headline metric cards that give executives and analysts an immediate overview of blockchain performance. This template tracks critical indicators including total wallet balance, completed transaction rates, average network fees, and regional risk exposure — all in a single view without opening a single formula.
🎛️ Dual Slicer Architecture — A right-side slicer on the Summary page and a left-side slicer on the Report page let users filter every chart and metric by dimension in one click. Analysts can slice by wallet type, region, department, or time period without touching the underlying data — a workflow that eliminates the manual filter adjustment that costs teams 30+ minutes per reporting cycle.
⚠️ Risk Intelligence by Region — The High Risk Level % by Region chart is a standout compliance feature. It surfaces which geographic segments carry the highest transaction risk exposure, enabling risk and compliance officers to prioritize audits, flag suspicious activity, and report to regulators with visual evidence — not raw spreadsheet rows.
📦 What’s Inside the Blockchain & Cryptocurrency Report in Excel
🗂️ Page 1 — Summary Page: The main dashboard with 5 KPI cards at the top, a right-side slicer panel for interactive filtering, and 5 embedded charts (Completed Transaction %, Wallet Balance by Wallet Type, High Risk Level % by Region, Wallet Balance by Department, Network Fee by Month). This is the executive reporting view designed for board decks and weekly standups.
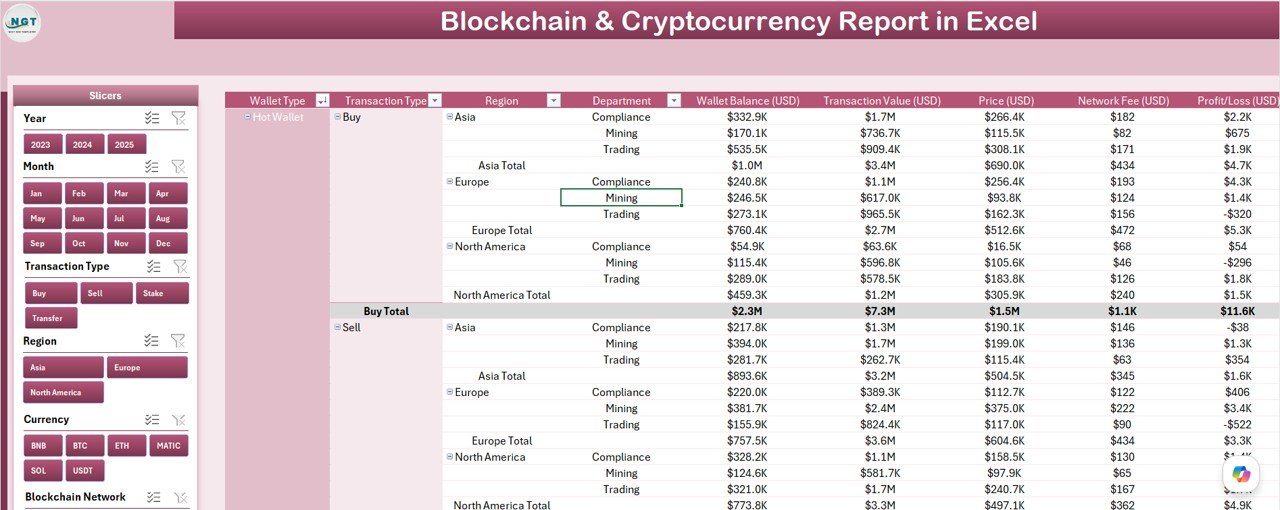
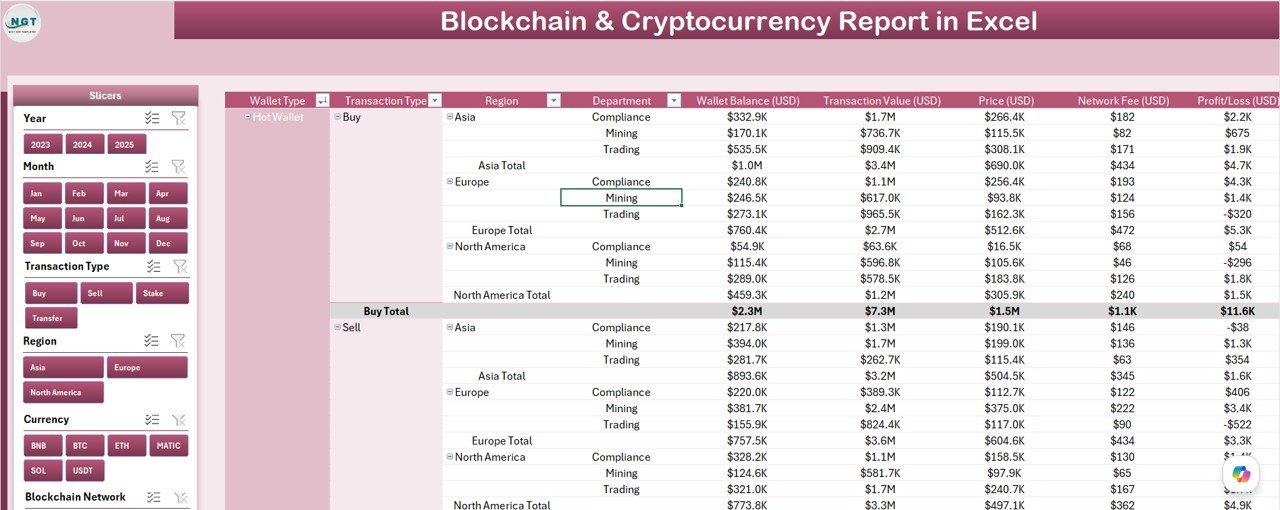
Report Page — Information Table and Left-Side Slicer
📋 Page 2 — Report Page: A granular information table paired with a left-side slicer. This page is built for operations and compliance analysts who need transaction-level detail — filtered interactively without pivot table complexity. The table structure supports filtering by transaction status, wallet type, risk level, and department.
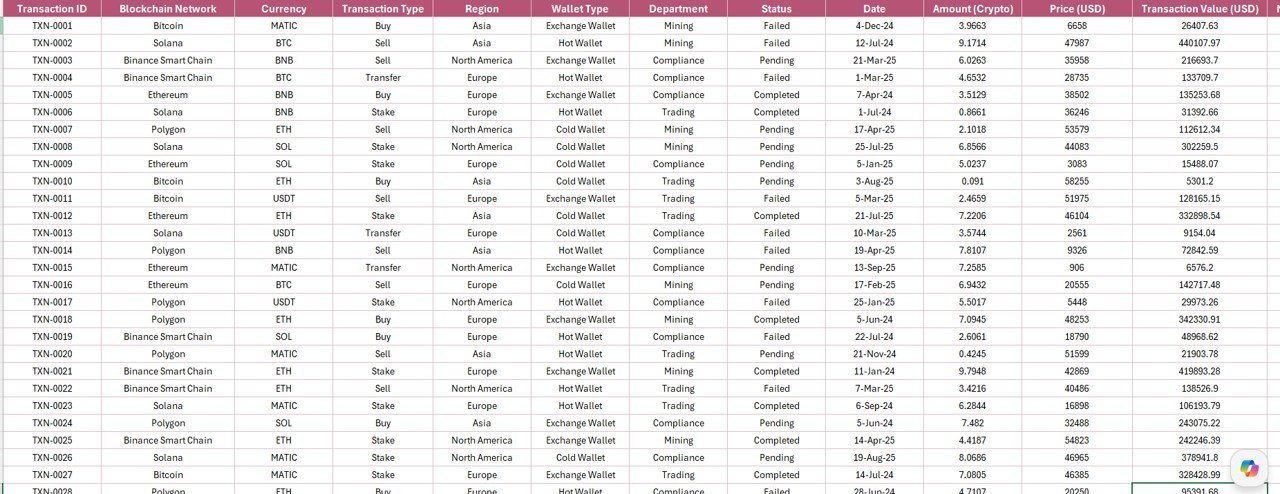
🗃️ Data Sheet: The structured input area where raw blockchain transaction data is entered or pasted. Field columns include transaction ID, date, wallet type, department, region, risk level, network fee, and completion status. All charts and the report table pull directly from this sheet — no manual linking required.
⚙️ Support Sheet: Contains the lookup tables, dropdown list values, and reference data that power the slicer options and chart categories. Analysts can extend or modify wallet type categories, regions, and departments here without breaking the report logic.
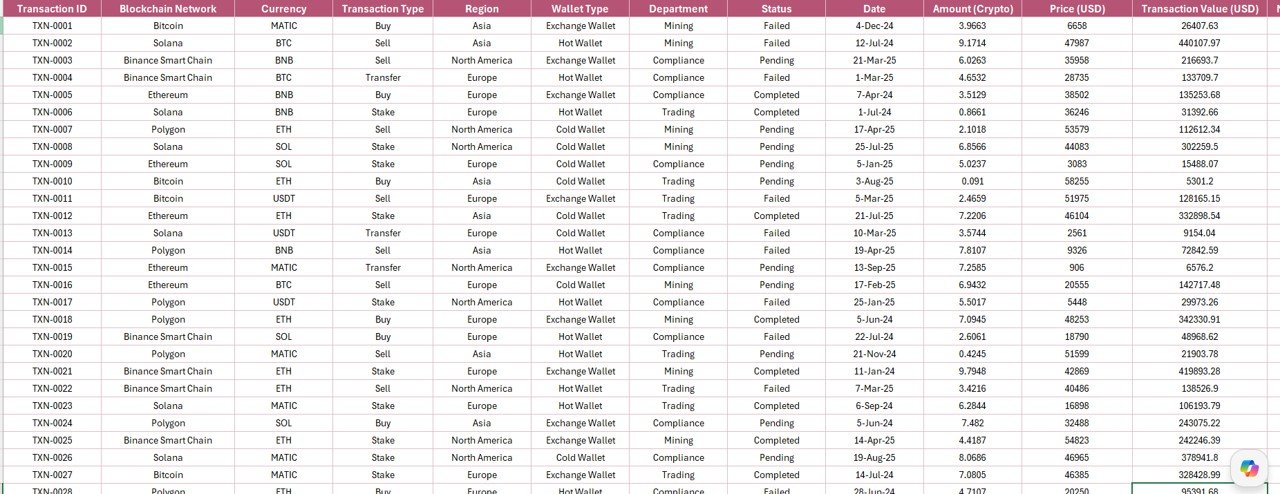
Data Sheet — Structured Transaction Data Input
📊 Blockchain & Cryptocurrency Report in Excel vs. Google Sheets vs. Paid Blockchain SaaS — Where This Fits
| Feature | Blockchain & Cryptocurrency Report in Excel | Google Sheets Equivalent | Chainalysis / Glassnode |
|---|---|---|---|
| Cost | $7.99 one-time | Free (limited charts) | $500–$5,000+/month |
| Platform | Microsoft Excel (offline/online) | Google Sheets (browser only) | Proprietary web app |
| Setup time | Under 10 minutes | 15–30 minutes (manual) | Days (API integration) |
| Interactive Slicers | ✅ Dual slicer (Summary + Report) | ⚠️ Limited filter options | ✅ Advanced filters |
| Risk by Region Chart | ✅ Built-in | ❌ Manual build required | ✅ Yes (premium tier) |
| Customizable Fields | ✅ Full control | ✅ Yes | ❌ Fixed schemas |
| Offline Access | ✅ 100% offline | ❌ Requires internet | ❌ Requires internet |
| Year-1 Cost (5 users) | $7.99 total | $0 (basic) | $6,000–$60,000+ |
| No Coding Required | ✅ Native Excel only | ✅ Yes | ❌ API/dev skills needed |
For finance and compliance teams that need structured blockchain reporting without paying enterprise SaaS prices, the Blockchain & Cryptocurrency Report in Excel sits in the sweet spot.
👥 Who This Template Is For — and Who It’s Not For
✅ This template is built for:
- Finance managers tracking crypto wallet balances, transaction volumes, and network fees across departments
- Compliance officers who need to report High Risk transaction percentages by region for regulatory purposes
- Blockchain project leads at startups or fintech companies monitoring DeFi or payment network KPIs
- Data analysts who work in Excel and want a ready-to-use crypto reporting framework without building from scratch
- Small to mid-size teams (5–500 people) who need structured blockchain reporting but can’t justify $500+/month SaaS tools
❌ This template is NOT for:
- Enterprise teams requiring live API connections to blockchain nodes for real-time on-chain data
- Users who need automated wallet address monitoring or AML transaction screening
- Organizations that need multi-user cloud collaboration with simultaneous editing (consider our Excel Dashboard Templates with Google Sheets alternatives)
⚙️ How to Use the Blockchain & Cryptocurrency Report in Excel
- Download and open the .xlsx file in Microsoft Excel (2016 or later recommended)
- Navigate to the Data Sheet and replace the sample transaction records with your own blockchain/crypto transaction data
- Update the Support Sheet with your wallet types, departments, and regional categories if they differ from the defaults
- Go to the Summary Page and use the right-side slicer to filter charts by any dimension
- Switch to the Report Page for granular table-level analysis with left-side slicer filtering
- Export or screenshot the Summary Page for board decks, compliance reports, or weekly updates
💼 Real-World Use Cases
Priya manages finance at a 120-person blockchain payment startup. Every Monday she pastes last week’s transaction exports into the Data Sheet, and by 9:10 AM her Summary Page shows the Completed Transaction % chart updated, the Network Fee by Month trending line refreshed, and five KPI cards showing total wallet balance. Her weekly board report is ready in under 15 minutes — without a single formula edit.
James is a compliance analyst at a crypto exchange. He uses the High Risk Level % by Region chart in the Blockchain & Cryptocurrency Report in Excel to identify which geographic segments are triggering the most risk flags each month. The slicer lets him drill into individual regions and wallet types during audits — and the report page’s information table gives him the transaction-level detail he needs to respond to regulatory inquiries.
A DeFi fund’s operations team of three tracks wallet balances across hot and cold wallets by department using the Wallet Balance by Department and Wallet Balance by Wallet Type charts. The one-time $7.99 purchase replaced a $2,400/year subscription they were paying for a dashboard tool that had more features than they ever used.
❓ Frequently Asked Questions
What KPIs does the Blockchain & Cryptocurrency Report in Excel track?
The Blockchain & Cryptocurrency Report in Excel tracks 5 key metrics including Completed Transaction %, Wallet Balance by Wallet Type, High Risk Level % by Region, Wallet Balance by Department, and Network Fee by Month — all displayed across KPI cards and interactive charts that update when you replace sample data.
Does this template require any Excel add-ins or macros?
No. The Blockchain & Cryptocurrency Report in Excel is 100% built using native Excel features — slicers, charts, and structured tables. No VBA, macros, Power Query, or add-ins are required. It works in Excel 2016 and all newer versions including Microsoft 365.
Can I add more transaction records to the Data Sheet?
Yes. The Data Sheet is a standard Excel table that expands automatically as you add rows. All charts and the Report Page information table reference the full table range, so adding new transaction records requires no formula adjustments — simply paste new rows and the report updates.
How does this compare to Chainalysis or Glassnode?
Chainalysis and Glassnode are enterprise on-chain analytics platforms starting at $500–$5,000+/month. The Blockchain & Cryptocurrency Report in Excel is an offline reporting template priced at $7.99 one-time — ideal for teams that track internal transaction data rather than on-chain blockchain explorers.
Can I customize the wallet types and regions in the report?
Yes. The Support Sheet contains the dropdown reference lists that drive the slicer options. You can add, rename, or remove wallet types, departments, and regions to match your organization’s taxonomy — all charts and slicers update automatically to reflect your changes.
Is this template suitable for DeFi or NFT project tracking?
The Blockchain & Cryptocurrency Report in Excel is designed as a flexible transaction reporting framework. DeFi and NFT teams can adapt the wallet type categories, department labels, and region fields in the Support Sheet to match their specific asset classes and tracking needs.
How long does setup take?
Most users complete setup in under 10 minutes: download the file, open in Excel, paste your transaction data into the Data Sheet, and optionally update the Support Sheet with your category labels. The Summary Page and Report Page are immediately ready to use with your data.
👤 About the Author
Built by PK — Microsoft Certified Professional with 15+ years of Excel, Google Sheets, and Power BI experience. Founder of NextGenTemplates, reaching 300K+ subscribers across YouTube channels (@PK-AnExcelExpert, @NextGenTemplates, @NeoTechNavigators). Every template is hand-built and tested before release.
🔗 Explore Related Templates
Support Sheet — Lookup Tables and Slicer Reference Data
📌 Explore more Excel Dashboard Templates on NextGenTemplates — including blockchain, finance, and technology reporting tools.
🔗 Also check out the Crypto Portfolio Dashboard in Excel for portfolio-level cryptocurrency tracking, and the Digital Wallets KPI Dashboard in Excel for wallet-centric KPI monitoring.
📖 Click here to read the Detailed Blog Post
🎥 Visit our YouTube channel for step-by-step video tutorials
👉 YouTube.com/@NextGenTemplates


Reviews
There are no reviews yet.