

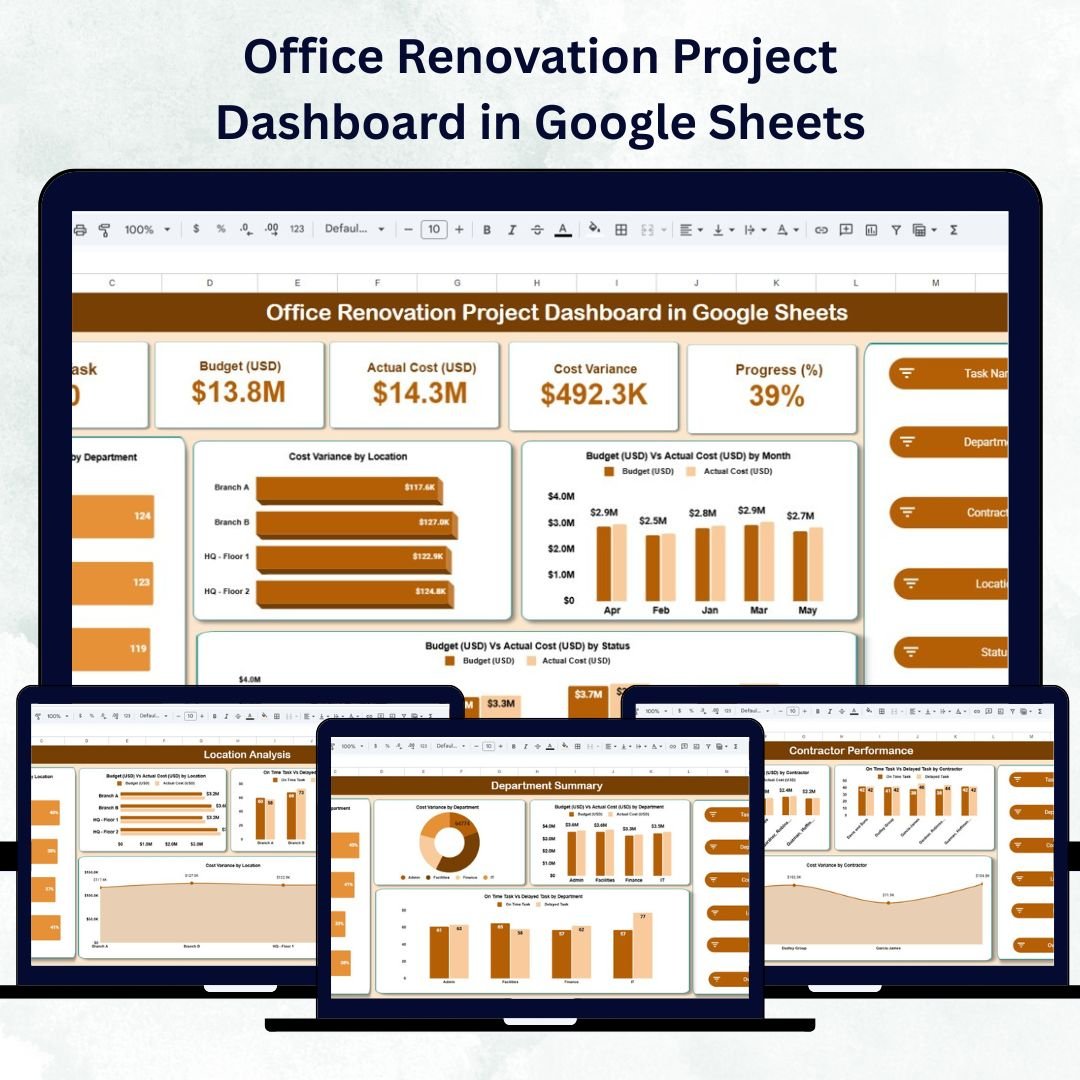
Renovating an office is more than just a design upgrade — it’s a project that requires precise planning, budgeting, and coordination across multiple departments and contractors. The Office Renovation Project Dashboard in Google Sheets is a ready-to-use, visual management tool designed to simplify renovation tracking and reporting. 🧱💼
With real-time updates, interactive charts, and centralized data management, this dashboard provides project managers with everything they need to monitor progress, control budgets, and ensure timely project completion — all within the familiar environment of Google Sheets.
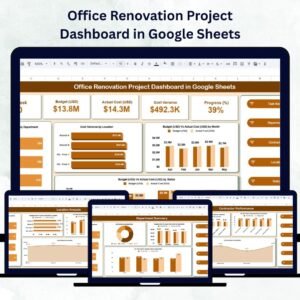
🔑 Key Features of the Office Renovation Project Dashboard in Google Sheets
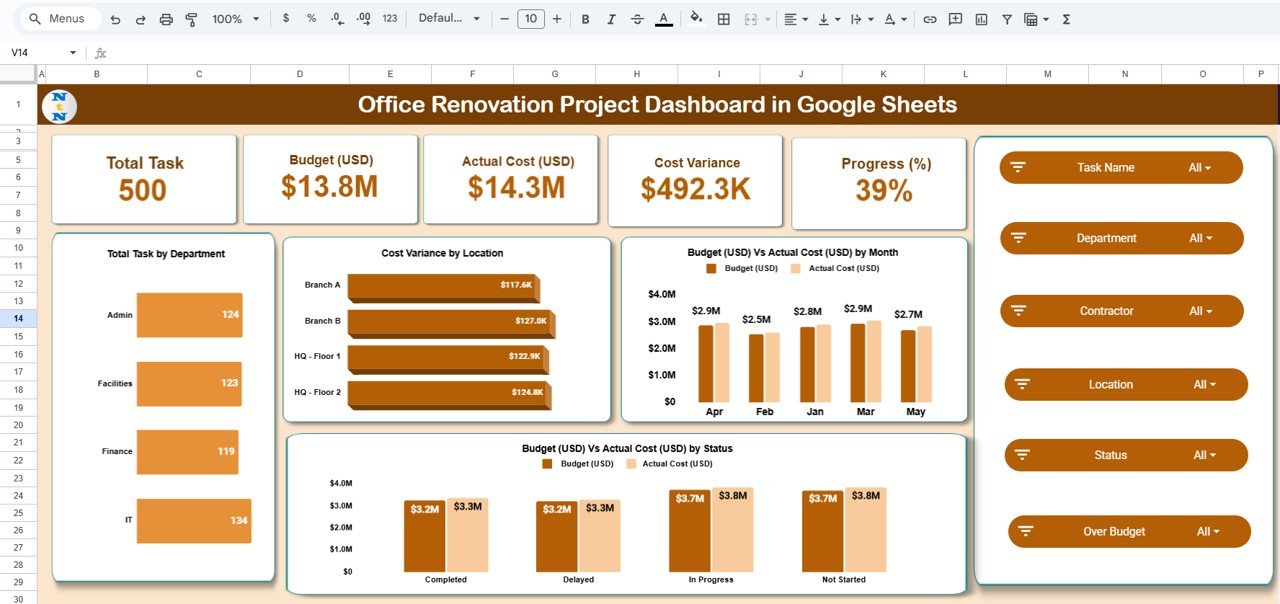
📋 Overview Sheet Tab
The central command center of your renovation management system.
-
Cards Section:
-
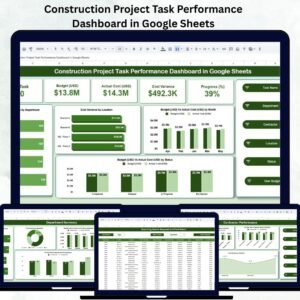
🧩 Total Tasks — Count of all renovation activities.
-
💰 Budget (USD) — Planned project budget.
-
💵 Actual Cost (USD) — Expenses incurred to date.
-
📉 Cost Variance — Budget vs. actual cost difference.
-
🔄 Progress (%) — Overall project completion percentage.
-
-
Charts Section:
-
Task Distribution by Department
-
Cost Variance by Location
-
Budget vs. Actual Cost by Month
-
Budget vs. Actual by Project Status
-
These visuals give managers instant clarity on timelines, budgets, and overall performance.
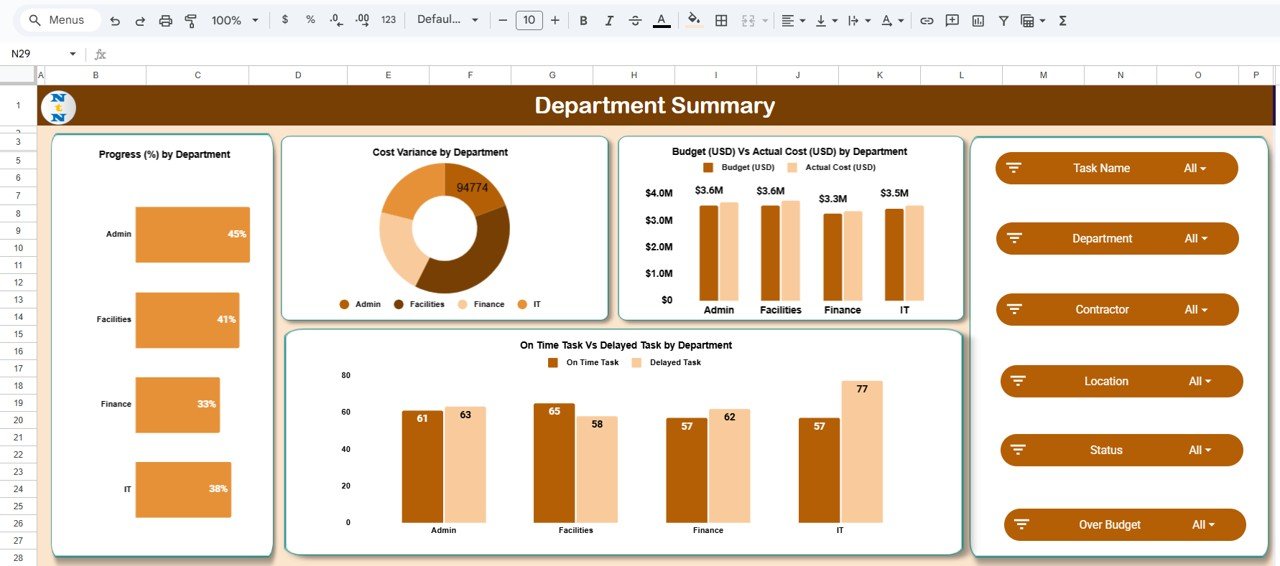
🏢 Department Summary Sheet Tab
Get granular insights into department-level project execution.
-
Progress (%) by Department — See which departments are ahead or behind.
-
Cost Variance by Department — Identify overspending early.
-
Budget vs. Actual Cost by Department — Ensure efficient budget utilization.
-
On-Time vs. Delayed Tasks — Measure schedule adherence.
This tab empowers managers to take targeted action on specific problem areas.
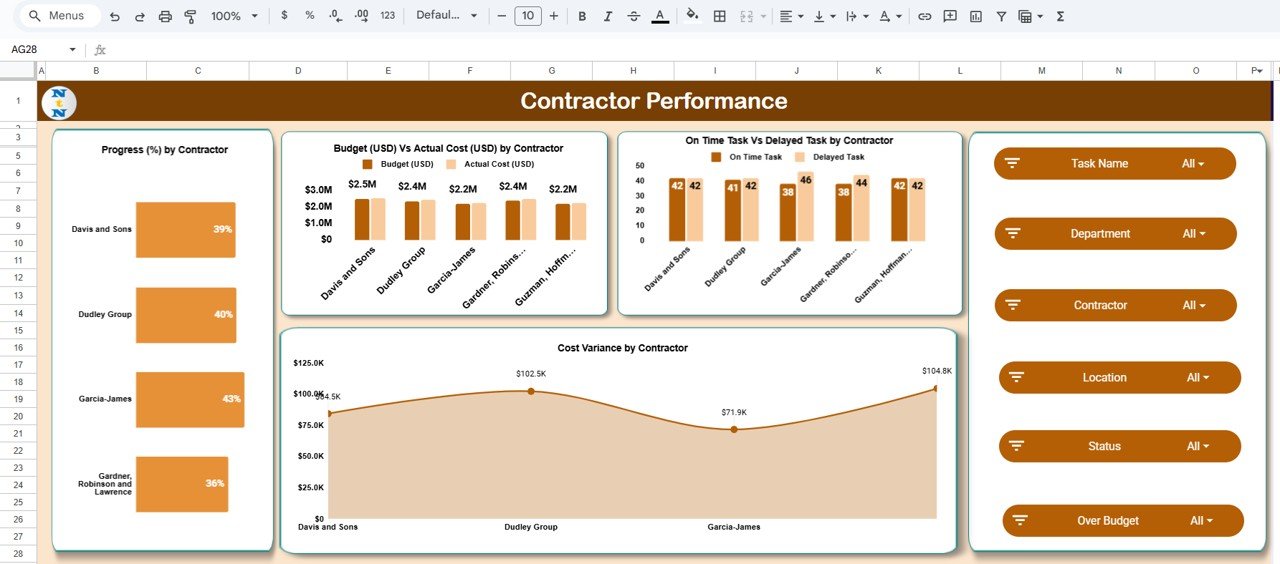
👷 Contractor Performance Sheet Tab
Monitor vendor efficiency and reliability with performance-based visuals.
-
Progress (%) by Contractor — Assess work completion rates.
-
Budget vs. Actual Cost by Contractor — Detect financial discrepancies.
-
On-Time vs. Delayed Tasks — Evaluate punctuality and reliability.
-
Cost Variance by Contractor — Compare contractors’ financial performance.
This page promotes vendor accountability and helps you select trustworthy partners for future projects.
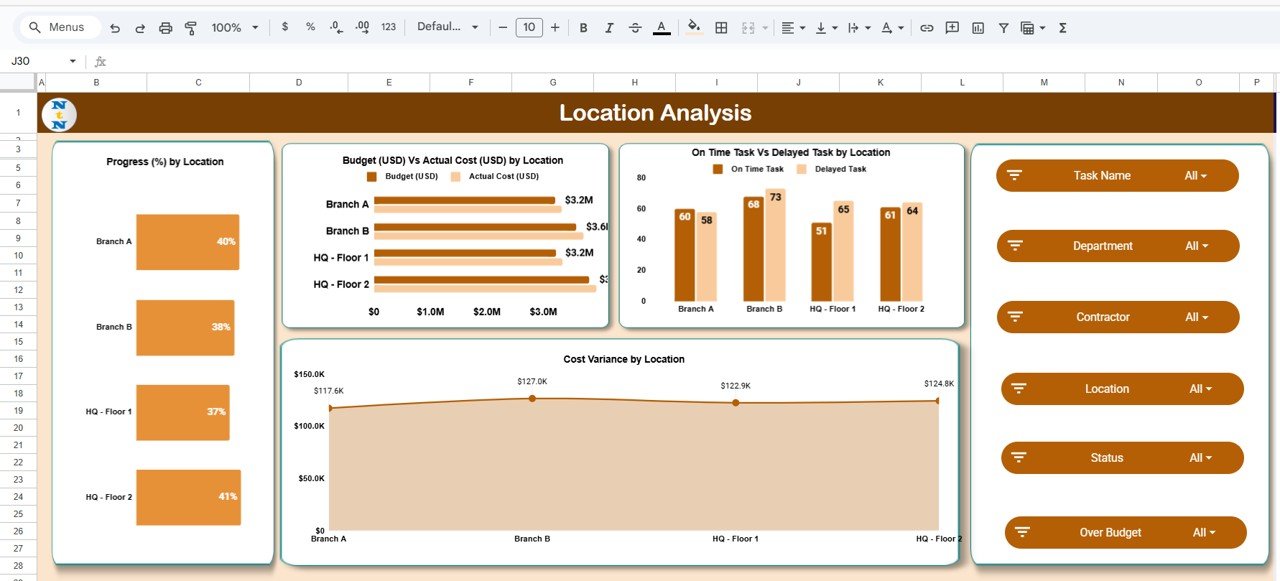
📍 Location Analysis Sheet Tab
Compare how renovation efforts are progressing across multiple office sites.
-
Progress (%) by Location — Check which sites are lagging behind.
-
Budget vs. Actual Cost by Location — Identify offices that exceed budget limits.
-
On-Time vs. Delayed Tasks — Monitor site-specific performance.
-
Cost Variance by Location — Keep all branches financially aligned.
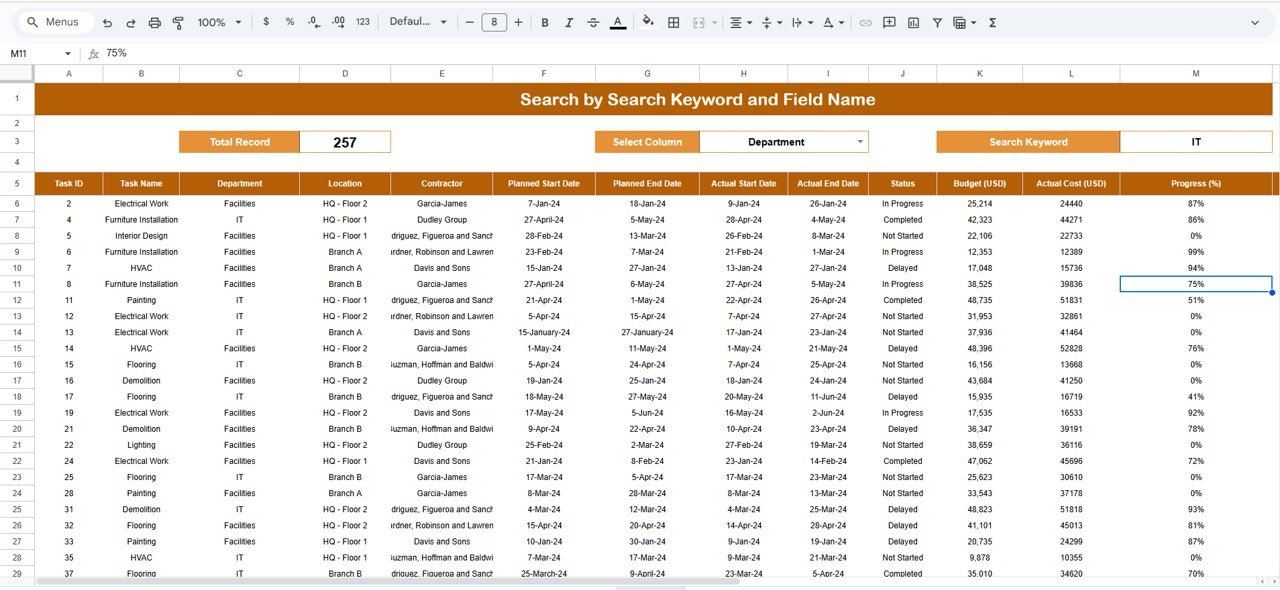
🔎 Search Function
Easily find any project record by typing a keyword or field name.
No more scrolling through endless data — locate what you need in seconds!
📊 Data Sheet Tab
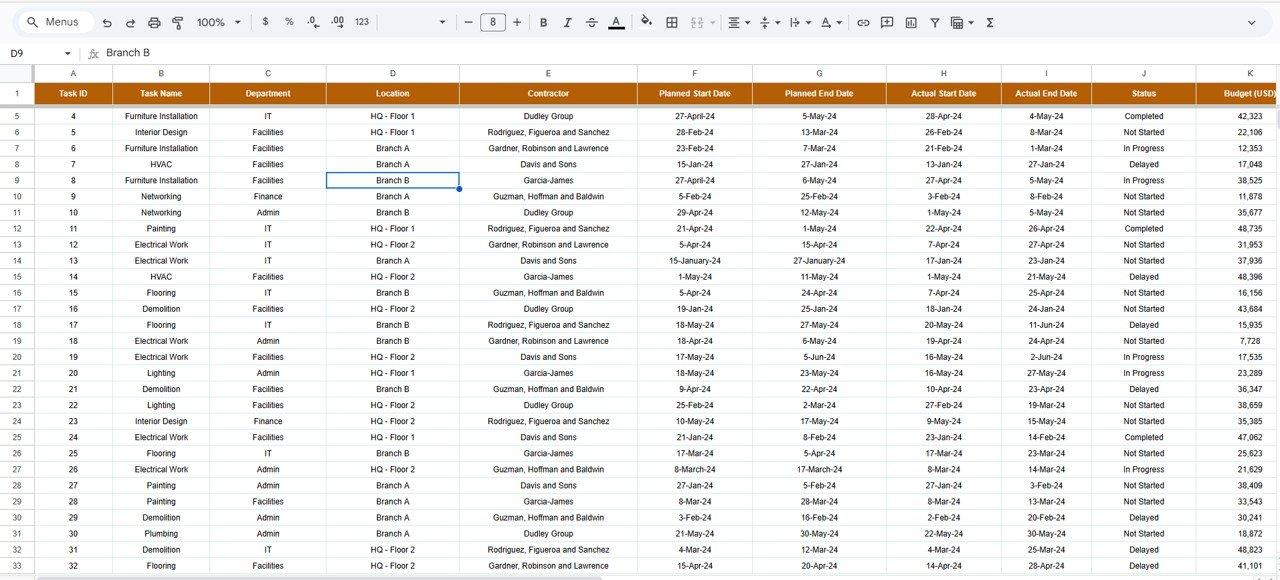
This is the engine that powers the entire dashboard.
-
Houses all essential project data: task name, cost, department, location, contractor, start/end dates, and status.
-
Updates all visuals and summaries automatically.
-
Ensures data consistency and real-time accuracy.
📦 What’s Inside the Dashboard Package?
✅ Overview Dashboard – Centralized visual summary of all renovation metrics
✅ Department Summary – Track spending and performance per team
✅ Contractor Analysis – Measure vendor reliability and timeliness
✅ Location Insights – Evaluate branch-level progress and costs
✅ Search Functionality – Quickly find any task or record
✅ Data Sheet – Master input area for all records
No complex setup. Just enter your data and watch your project visuals come to life. 🚀
🧑💼 Who Can Benefit from This Dashboard?
👷 Project Managers – Monitor overall progress and costs in one place.
🏢 Facility & Operations Teams – Manage departmental renovation requests.
💰 Finance Departments – Track spending against budget in real time.
📊 Executives – View high-level summaries for informed decision-making.
🤝 Contractors – Gain visibility into timelines and deliverables.
🧪 How to Use the Office Renovation Project Dashboard
-
Enter Project Data in the Data Sheet (costs, departments, timelines, contractors).
-
Review Summary Metrics on the Overview tab.
-
Analyze Departmental Trends using the Department Summary.
-
Assess Contractor Performance to identify high-value vendors.
-
Monitor Locations for budget adherence and progress percentage.
-
Use the Search Function for quick access to any record.
Collaborate seamlessly — this Google Sheets dashboard supports multiple users updating data in real time. ✅
🌟 Why Choose This Dashboard?
-
Centralized data management for full project visibility
-
Real-time updates with automated charts
-
Budget vs. Actual cost tracking
-
Contractor and department accountability metrics
-
Location-level comparisons for multi-site projects
-
Fully customizable and scalable
-
Beginner-friendly and requires no advanced technical skills
The Office Renovation Project Dashboard in Google Sheets turns complex renovation data into easy-to-read visuals — empowering project managers to stay on time, under budget, and in total control. 🏗️📉
🔗 Click here to read the Detailed blog post
Watch the step-by-step video Demo:







Reviews
There are no reviews yet.