

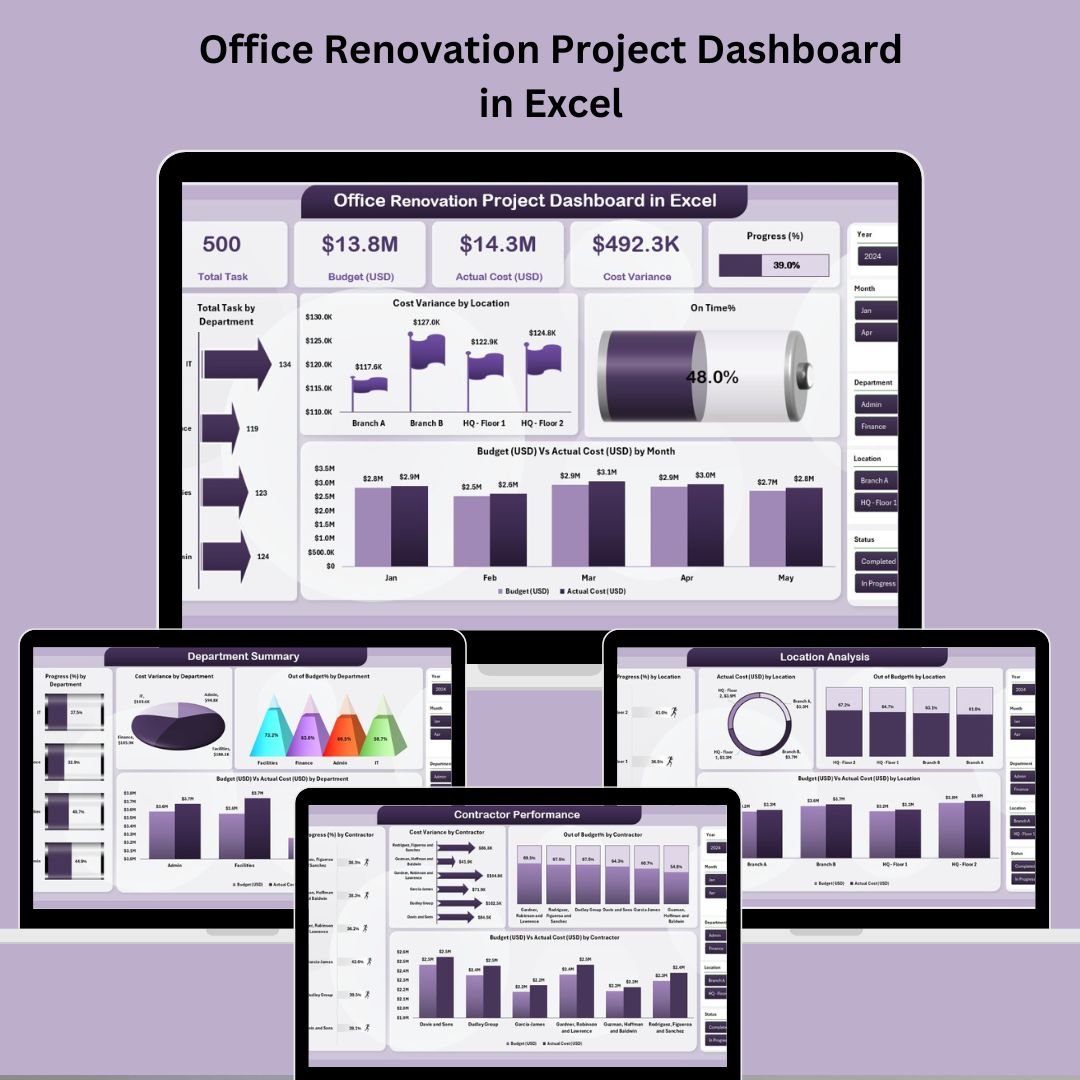

Managing an office renovation doesn’t have to be overwhelming. With multiple teams, deadlines, and budgets on the line, keeping everything in sync is a challenge—unless you have the Office Renovation Project Dashboard in Excel. 💼📊
This all-in-one Excel dashboard gives project managers, facility coordinators, and decision-makers a powerful visual tool to oversee every aspect of their renovation project. From cost control to contractor performance, it turns complex data into actionable insights—no special software needed!
✅ Key Features of Office Renovation Project Dashboard
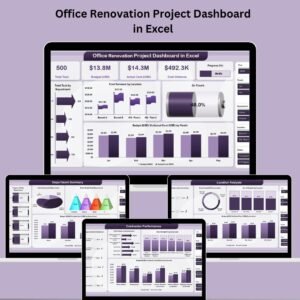
📌 Five Analytical Pages – Easily navigate across Overview, Department Summary, Contractor Performance, Location Analysis, and Monthly Trends.
📈 High-Level KPI Cards – View metrics like On-Time %, Total Tasks, Budget vs Actual at a glance.
📊 20+ Dynamic Charts – Visualize progress, costs, and variances in real-time.
🧩 Interactive Page Navigator – Quickly switch between key views from one control panel.
📍 Slicers for Custom Views – Filter by location, department, or contractor for targeted analysis.
📁 Data-Driven Design – Just update the Data Sheet and watch all visuals auto-refresh.
🧮 Budget vs Actual Insights – Control costs and spot overages early.
🏢 Contractor and Location Breakdown – Track performance across vendors and sites.
📦 What’s Inside the Office Renovation Dashboard
This Excel tool includes five performance dashboards and two supporting sheets:
🧭 Overview Page
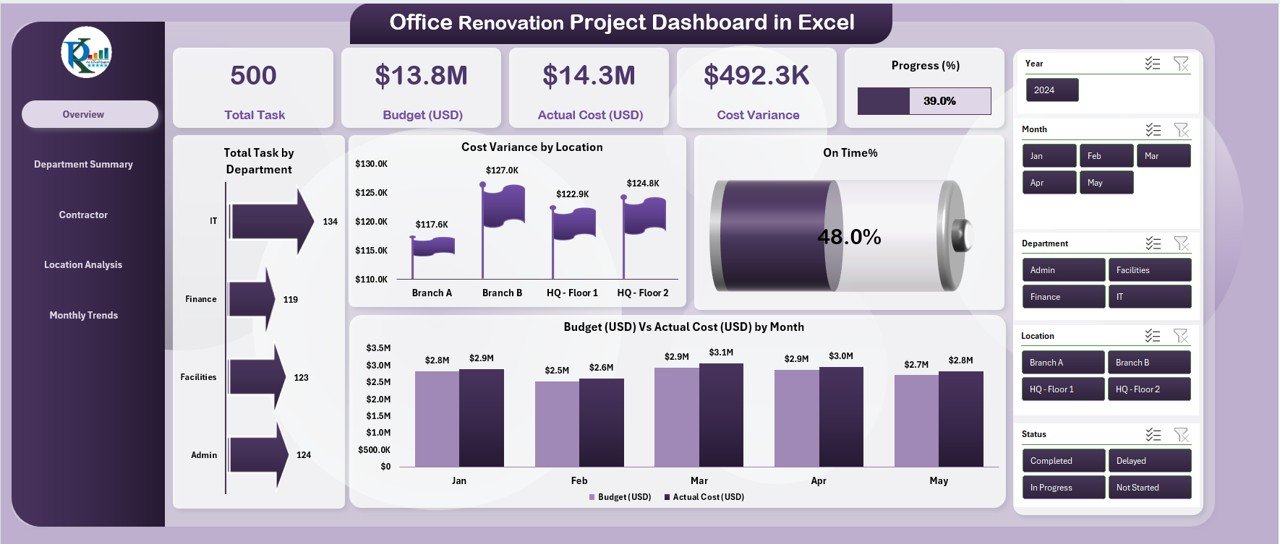
Your command center. Features 5 summary KPIs and 4 charts showing:
Total Tasks by Department
Cost Variance by Location
On-Time %
Budget vs Actual Cost by Month
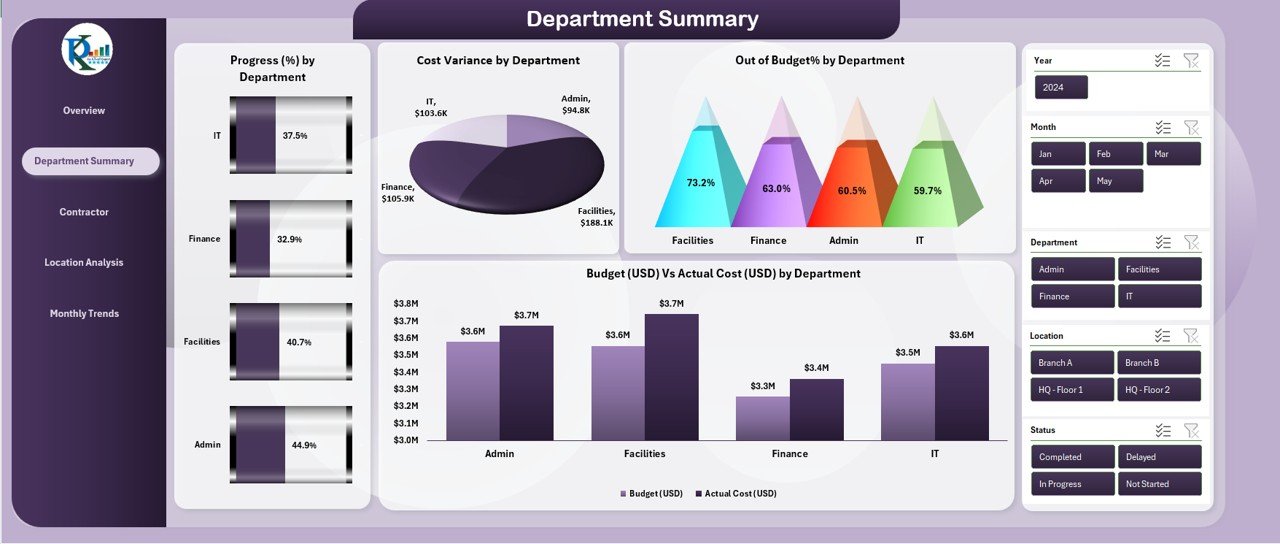
🏢 Department Summary
Analyze task and budget performance by department:
Progress %, Cost Variance, Out-of-Budget %, and Budget vs Actual Cost by Department
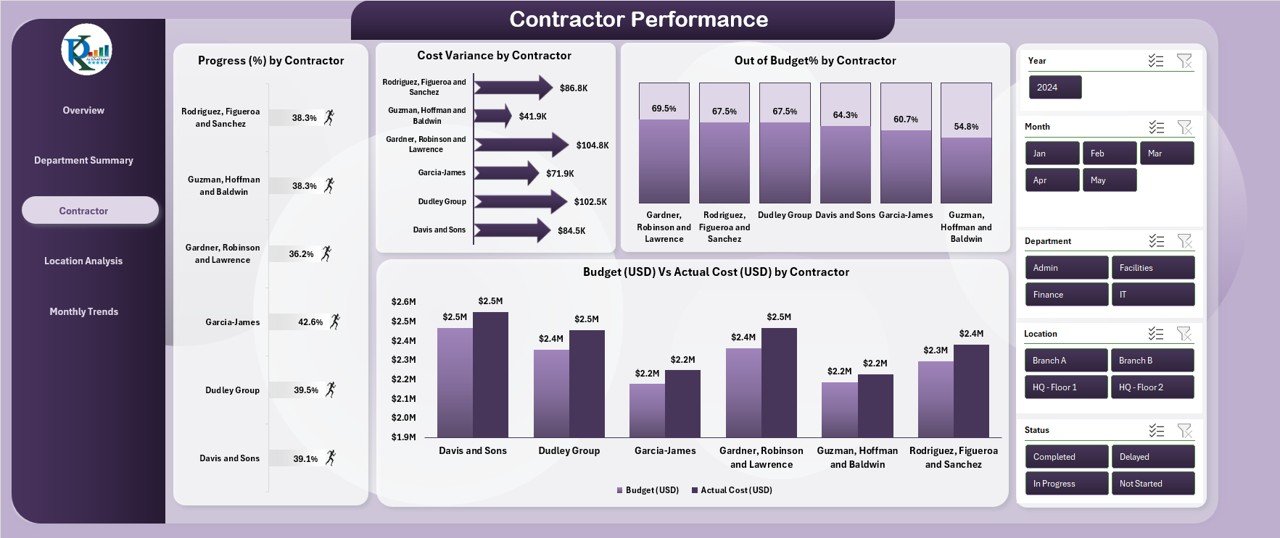
👷 Contractor Performance
Monitor contractor efficiency and spending:
Progress %, Cost Variance, Out-of-Budget %, and Budget vs Actual Cost by Contractor
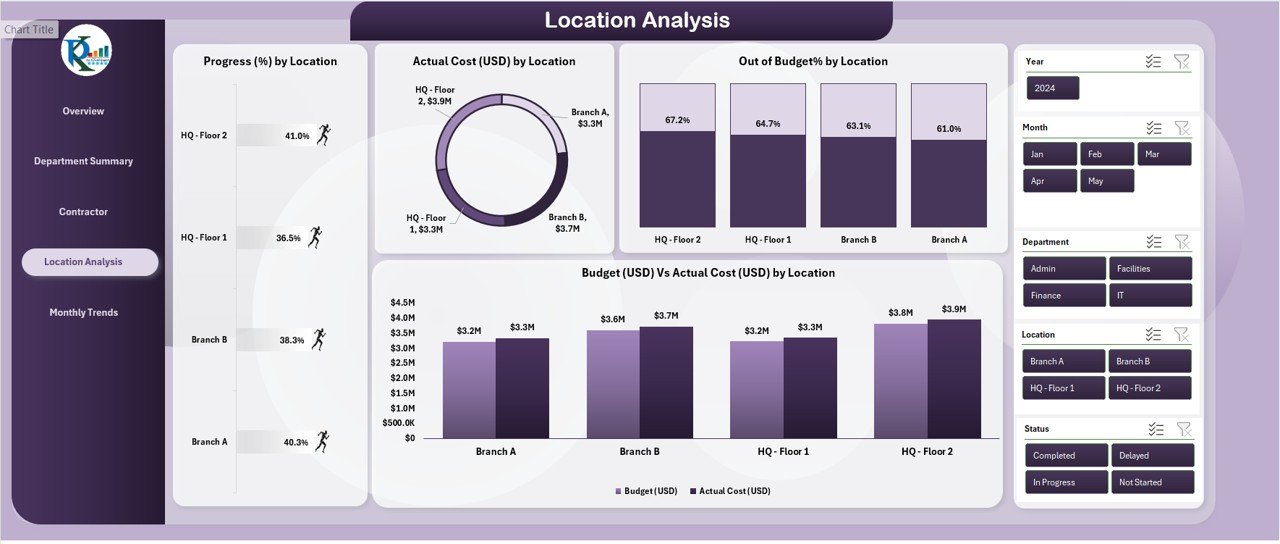
📍 Location Analysis
Track performance for multi-location renovations:
Progress %, Cost Variance, Out-of-Budget %, and Budget vs Actual by Location
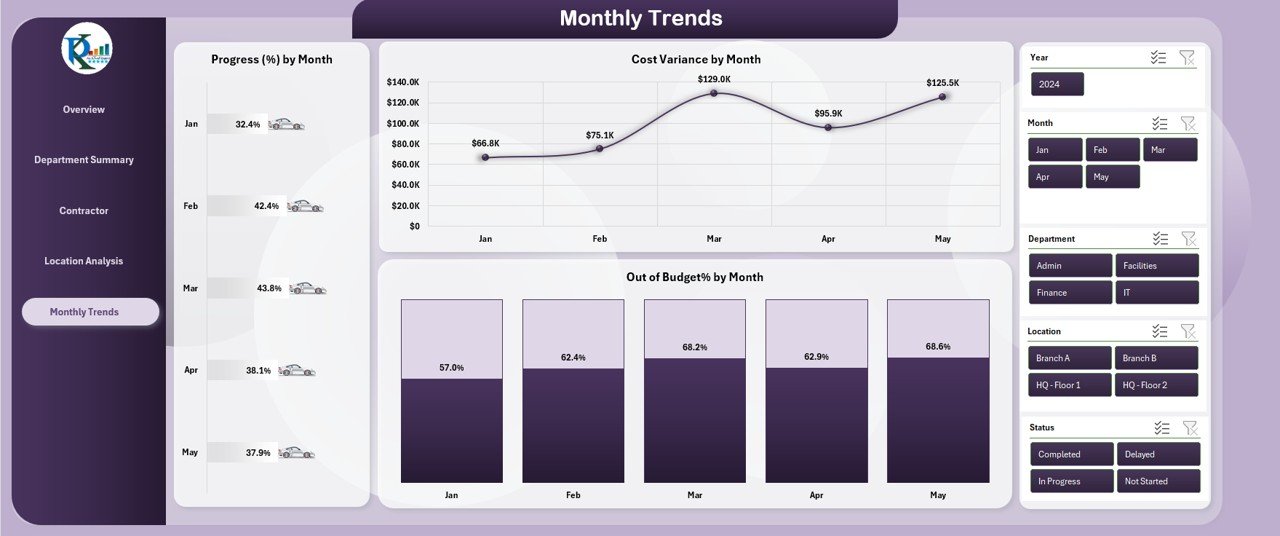
📆 Monthly Trends
Visualize progress over time:
Track changes in Progress, Cost Variance, Out-of-Budget %, and Budget vs Actual by Month
📋 Supporting Sheets
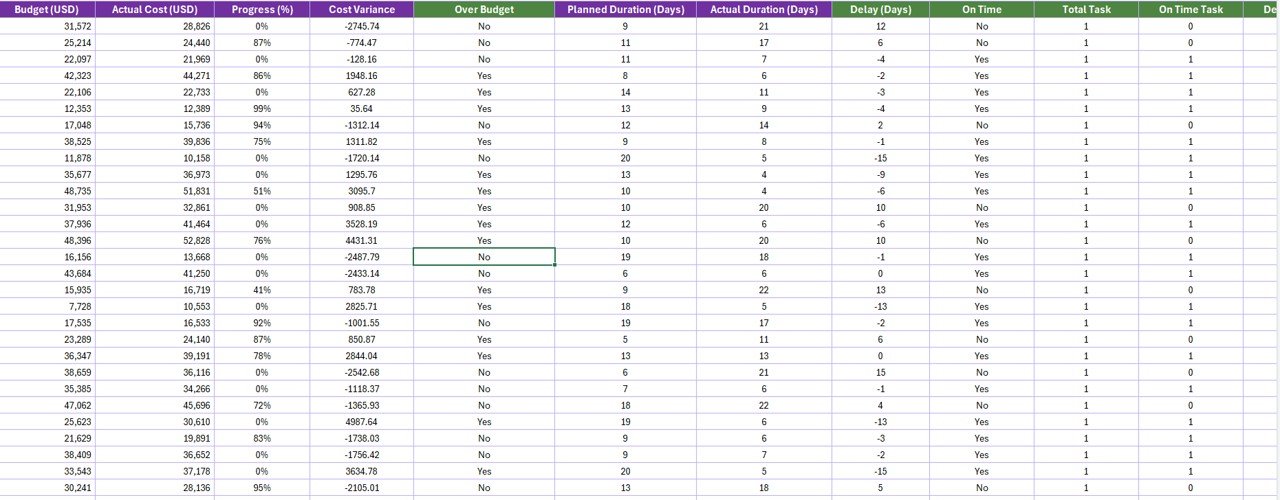
Data Sheet: Enter and update raw project data
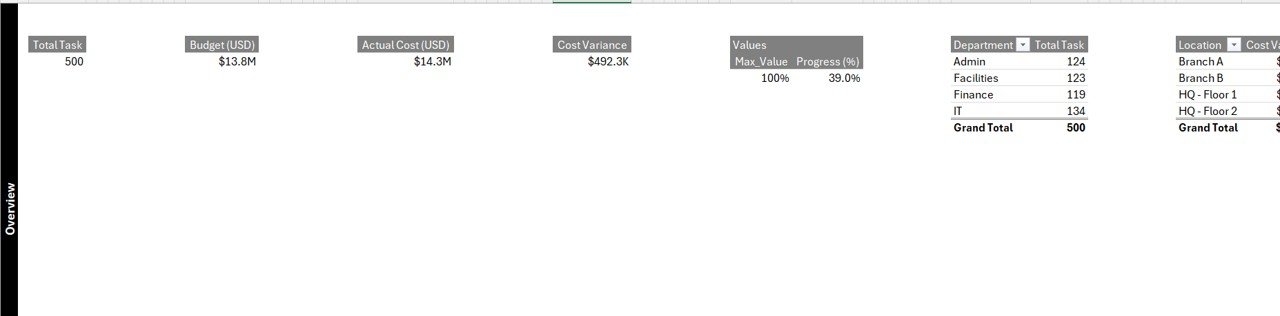
Support Sheet: Manage drop-downs and maintain data integrity
🛠️ How to Use the Office Renovation Project Dashboard
Download the Excel Template and open in Excel Desktop App.
Input Project Data into the Data Sheet.
Explore KPIs & Trends across all five interactive dashboard pages.
Use Slicers to filter by location, contractor, or department.
Update Weekly or after every milestone for real-time insights.
No coding. No complexity. Just clean, visual project tracking! 🧑💼📊
👥 Who Can Benefit from This Dashboard
👷 Project Managers – Gain full control over renovation timelines and budgets.
🛠️ Facilities Managers – Coordinate departments and locations more efficiently.
💰 Finance Teams – Monitor real-time budget adherence.
👨💼 Executives & Leadership – View big-picture performance at a glance.
📅 HR Teams – Stay aligned on space readiness for return-to-office planning.
If you manage space, money, or teams during renovations—this dashboard is built for you.
🔗 Click here to read the Detailed blog post
🔗 Visit our YouTube channel to learn step-by-step video tutorials
Watch the step-by-step video tutorial:
Compatibility and Requirements
- Works in Microsoft Excel desktop (Excel 2016 or later, or Microsoft 365). Open it in the Excel desktop app.
- The dashboard uses slicers to filter by location, department and contractor. Microsoft explains them in Use slicers to filter data.
Frequently Asked Questions
Which pages does the dashboard have?
Five analysis pages: Overview, Department Summary, Contractor Performance, Location Analysis and Monthly Trends. Two supporting sheets, the Data Sheet and the Support Sheet, hold your data and the drop-down lists.
How do I add my own project data?
Enter your project data in the Data Sheet. The charts and KPI cards on all five pages refresh from it.
Can I filter by contractor or location?
Yes. Slicers let you filter the views by location, department or contractor.
Does it compare budget with actual cost?
Yes. The Overview page shows Budget vs Actual Cost by Month and Cost Variance by Location. The other pages show Budget vs Actual by department, contractor, location and month, along with Out-of-Budget %.
Is there a Google Sheets or Power BI version?
Yes. See the Office Renovation Project Dashboard in Google Sheets and the Office Renovation Project Dashboard in Power BI.
Related Office Renovation and Project Templates
- Office Renovation Project Dashboard in Power BI: the same dashboard in Power BI
- Office Renovation Project Dashboard in Google Sheets: the Google Sheets edition
- Office Renovation Project Report in Excel: a report view of the same project
- Office Renovation Request Tracker in Excel: log and follow renovation requests
- Project Management Dashboard in Excel: a general project dashboard
Browse all Excel dashboards.













Reviews
There are no reviews yet.