

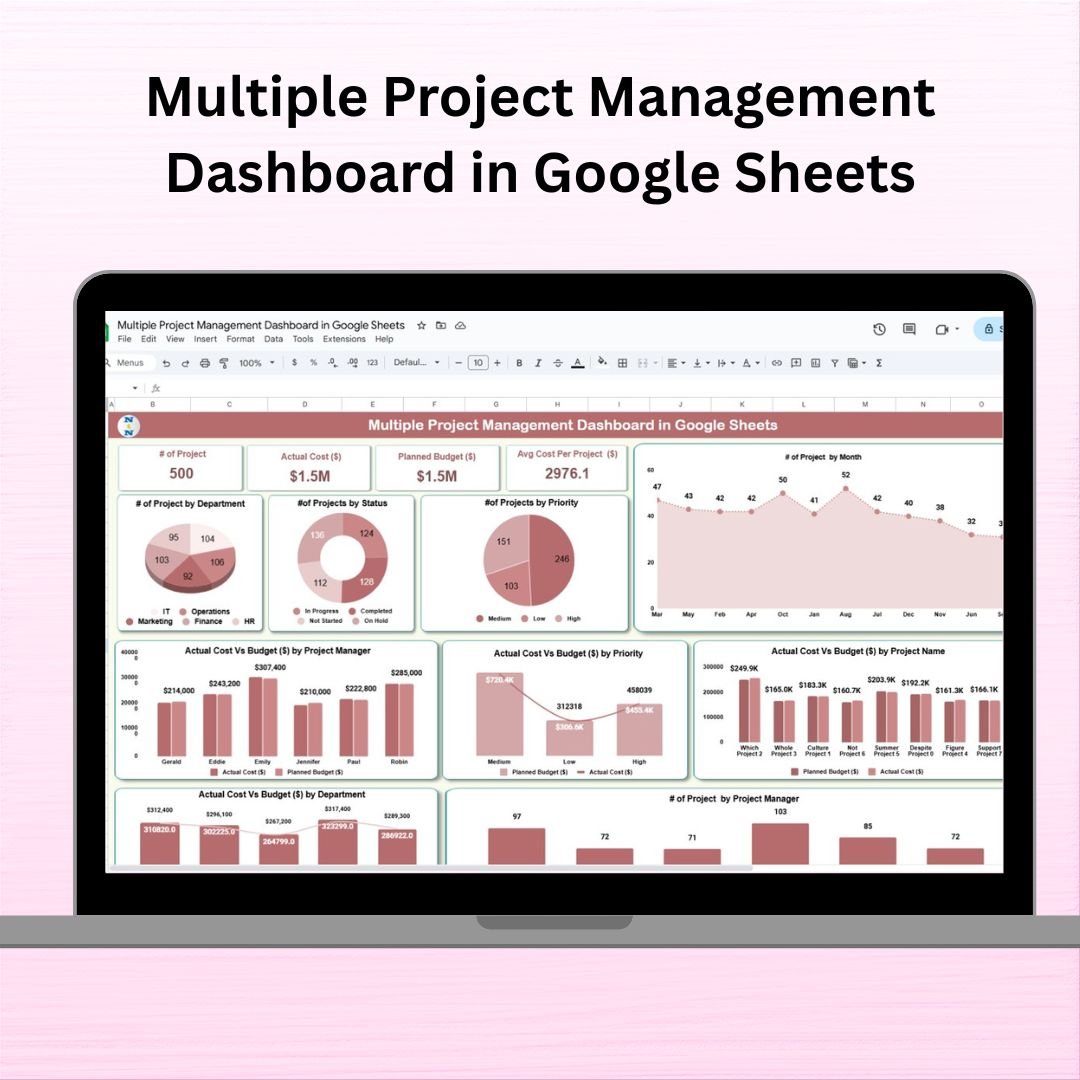
Stay on top of every project — budget, status, deadlines, team performance, and more — with the Multiple Project Management Dashboard in Google Sheets. This powerful and user-friendly tool empowers you to track multiple projects effortlessly, all in real-time and from one place. Whether you’re overseeing marketing campaigns, IT rollouts, or cross-functional initiatives, this dashboard gives you a clear picture of what’s happening, what’s lagging, and where to act — instantly. ✅
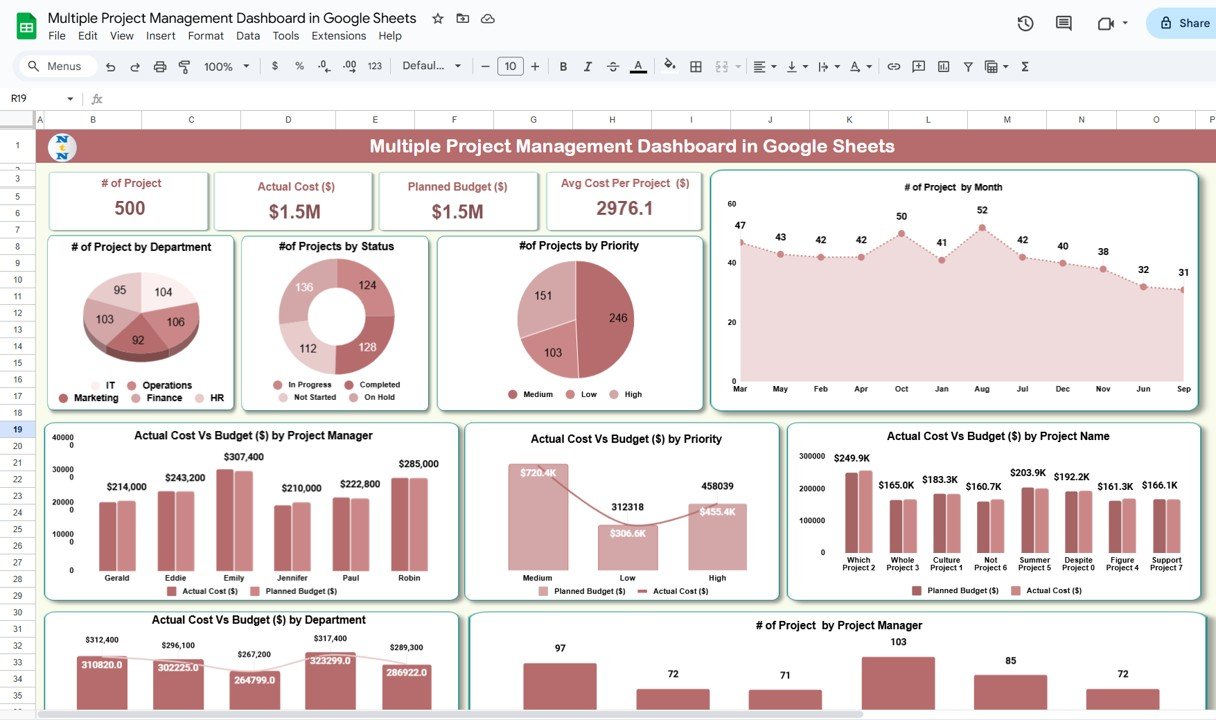
🛠️ Key Features of the Multiple Project Management Dashboard
📌 Real-Time Dashboard View
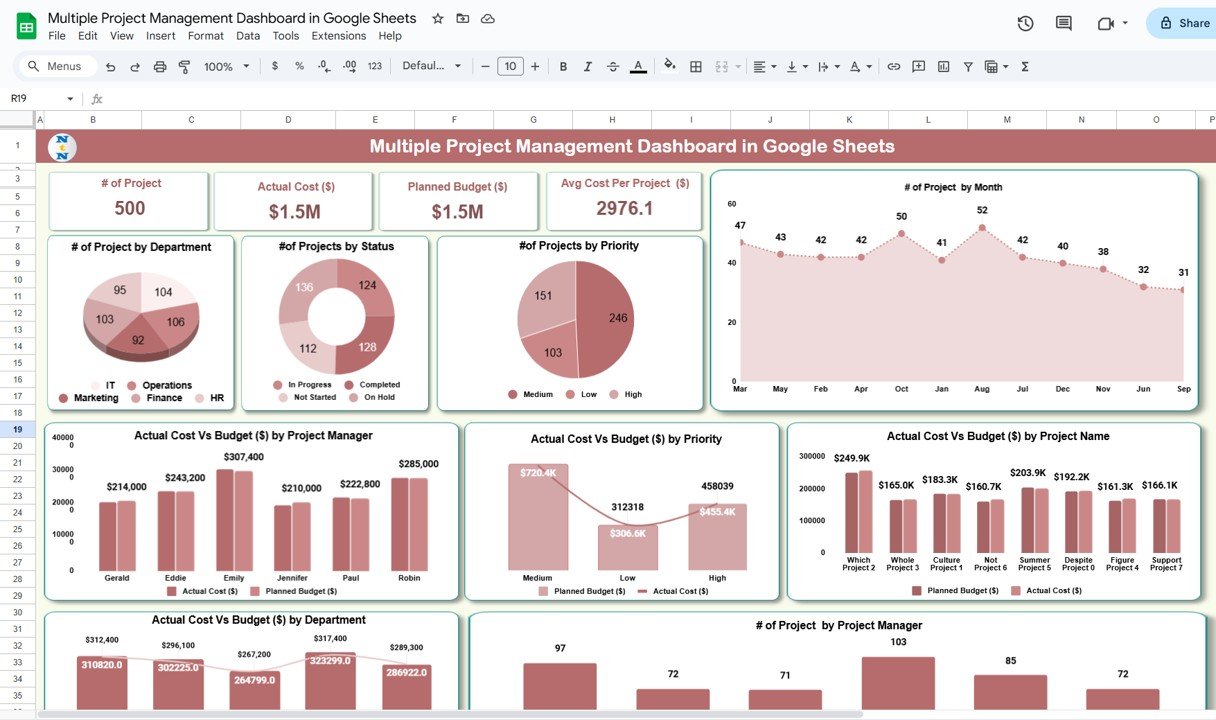
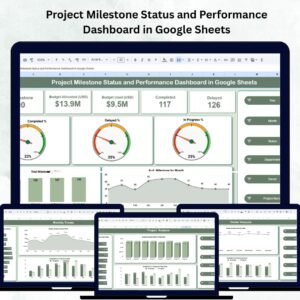
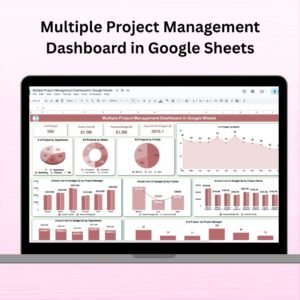
Instantly visualize how many projects are underway, what’s completed, and what’s over budget.
Interactive charts and summary cards show live updates for total projects, actual costs, planned budgets, and average cost per project.
📌 Visual Reports by Key Dimensions
See the number of projects by department, status, priority, project manager, and month.
Spot bottlenecks and performance gaps across any function with one glance.
📌 Budget vs. Actual Tracking
Compare actual expenses vs. planned budgets by project, priority, manager, and department.
Easily identify which projects are going off-track before it’s too late.
📦 What’s Inside the Multiple Project Management Dashboard
📁 Dashboard Sheet Tab
This is the control center. It includes:
KPI Cards: Total Projects, Planned Budget, Actual Cost, Avg. Cost/Project
9 Auto-Updating Charts (by department, priority, manager, etc.)
Budget Variance Analysis visuals by all key groups.
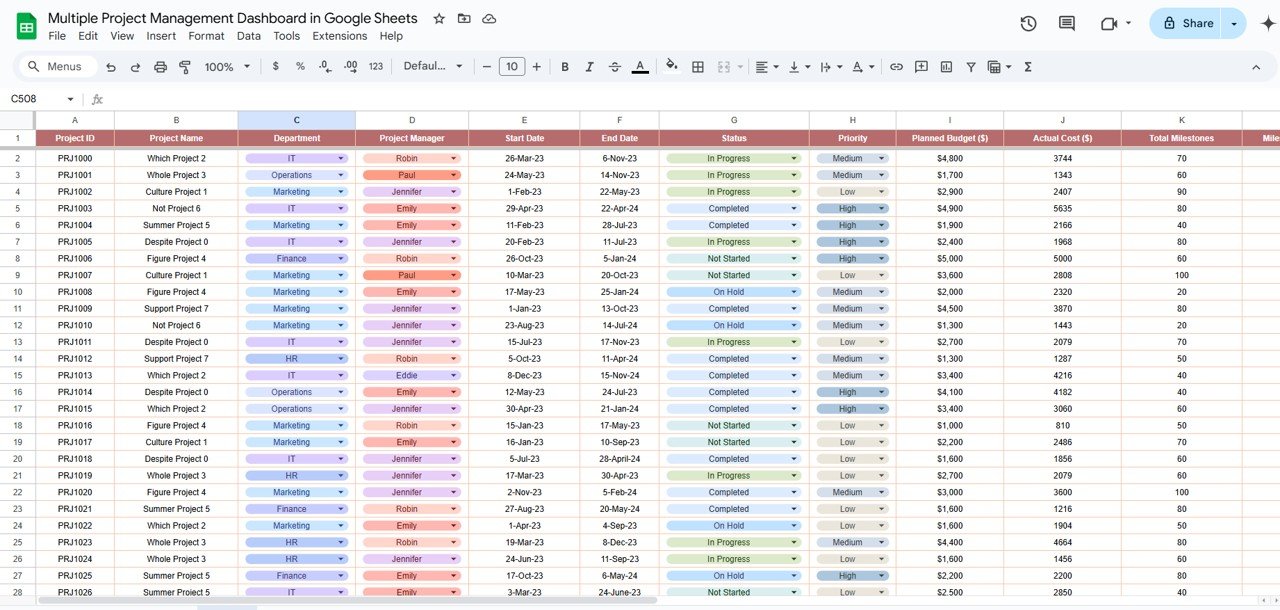
📁 Data Sheet Tab
Track and update all your project-level data here.
Fields include Project Name, Budget, Cost, Start Date, End Date, Status, Priority, Manager, Department — and more!
📈 How to Use the Product
Enter Your Project Data: Add project-level details in the Data Sheet tab (name, budget, cost, etc.)
Review Auto-Charts: Instantly see updated charts and metrics in the Dashboard tab.
Monitor KPIs: Track progress, spending, and team workload live.
Make Adjustments: Identify red flags quickly and take corrective actions.
Collaborate Freely: Share with your team — it’s Google Sheets, after all!
🎯 Who Can Benefit from This Dashboard?
✅ Project Managers – Track progress, status, and budget variance in one place.
✅ Marketing/IT/Ops Leaders – Oversee team performance across multiple initiatives.
✅ Finance Teams – Compare cost vs. budget across departments.
✅ Small Businesses & Startups – Manage all client or internal projects without expensive software.
✅ Remote Teams – Stay aligned in real-time with collaborative access and updates.
🚀 Why You’ll Love It
No coding or Power BI needed — fully Excel-style, simple to use!
Google Sheets means real-time collaboration and auto-saving.
Fully editable, reusable, and print-ready.
Saves HOURS every week on project reporting! 🕒





Reviews
There are no reviews yet.