


Managing resources effectively is one of the biggest challenges in project management. The Resource Allocation Dashboard in Google Sheets is a ready-to-use solution that empowers managers to track resource utilization, allocation, and productivity — all from one interactive dashboard. 🚀
Designed for project managers, HR professionals, and operations teams, this dashboard simplifies how organizations plan, allocate, and monitor their workforce. It helps identify underutilized and over-allocated employees, balance workloads, and ensure every team member contributes effectively to organizational goals.

🔑 Key Features of the Resource Allocation Dashboard in Google Sheets
📊 Dashboard Sheet Tab
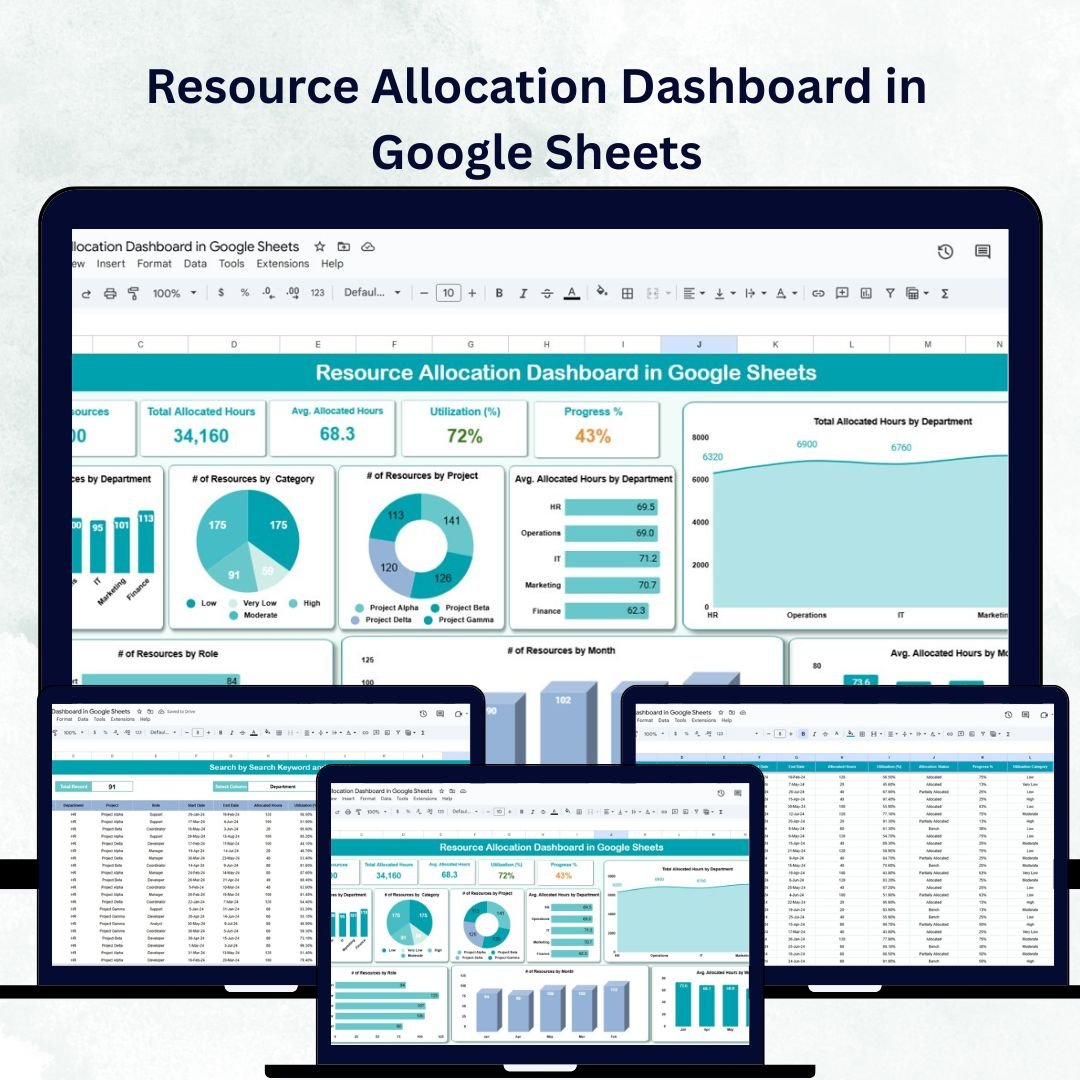
The Dashboard Sheet gives a complete visual summary of all allocation and utilization data:
Cards Section:
of Resources 👥 – Total number of employees or team members
Total Allocated Hours ⏱️ – Combined hours assigned across all projects
Avg. Allocated Hours 🕓 – Average hours per resource
Utilization (%) 💼 – Percentage of total capacity used
Progress % 📈 – Overall progress across all tasks or projects
Charts Section:
of Resources by Department – Shows distribution across departments
of Resources by Category – Analyzes allocation by skill or role category
of Resources by Project – Identifies which projects use the most resources
Avg. Allocated Hours by Department – Highlights workload balance
Total Allocated Hours by Department – Tracks departmental demand
Avg. Allocated Hours by Month – Detects utilization patterns over time
of Resources by Month – Shows monthly staffing trends
of Resources by Role – Breaks down workforce allocation by position
This sheet gives an at-a-glance overview of how your workforce is distributed and performing.
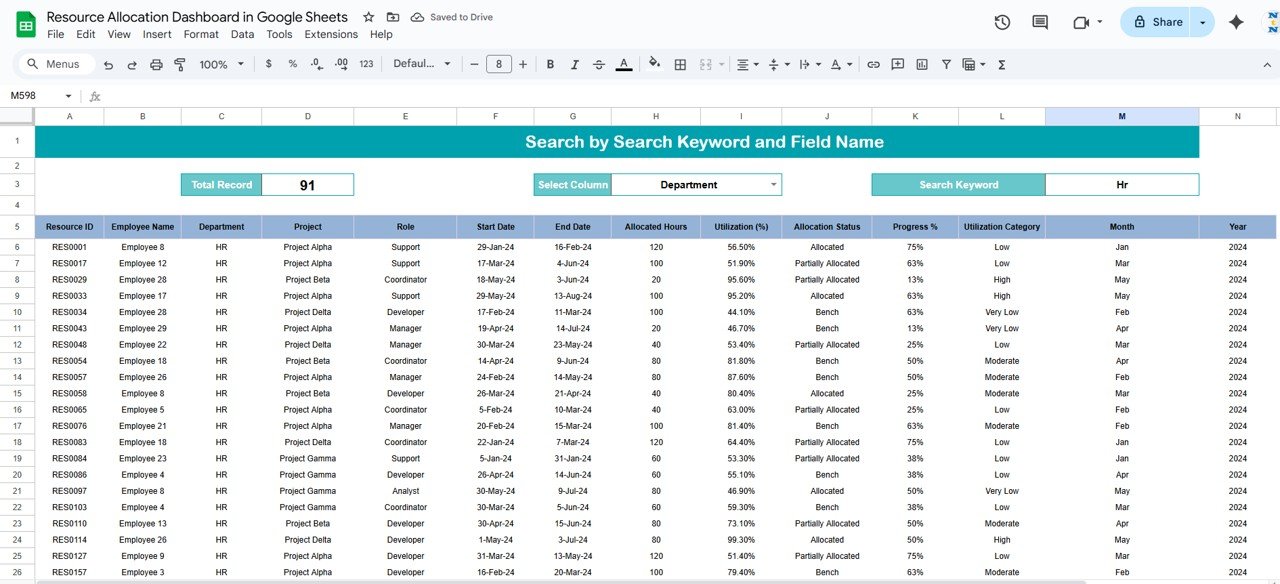
🔍 Search Sheet Tab
Instantly find any record using keyword or field-based search
Search by resource name, project, department, or role
Great for large teams and organizations managing multiple projects
This makes it simple for managers to locate, analyze, and verify resource records without wasting time scrolling through extensive datasets.
🧾 Data Sheet Tab
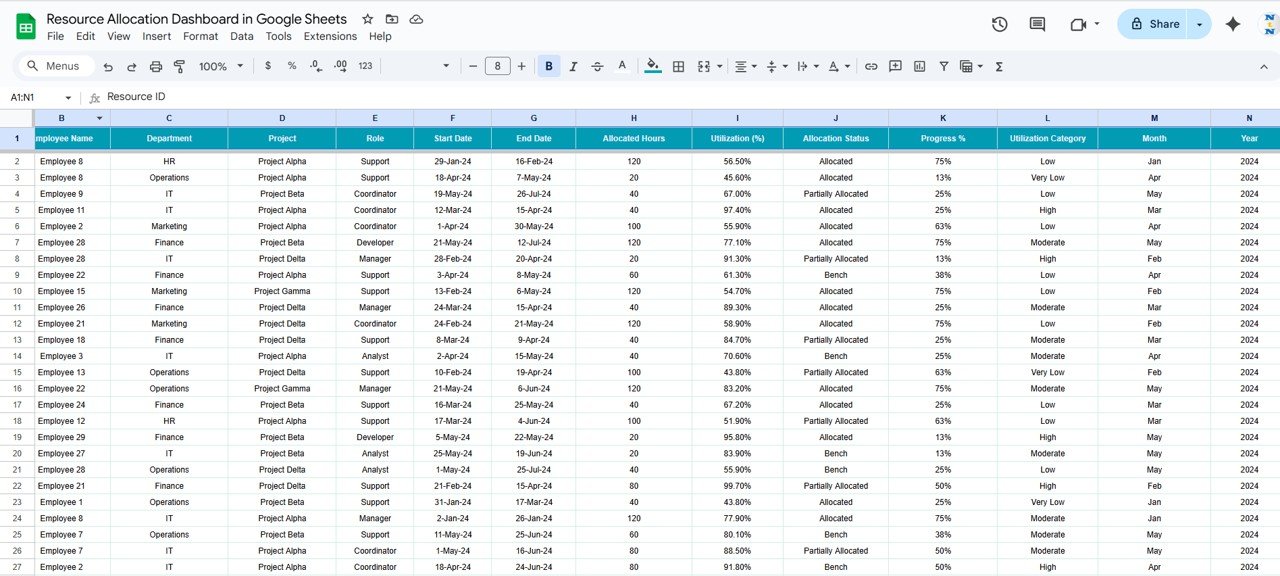
The Data Sheet is the backbone of the dashboard where all records are stored:
Fields include Resource Name, Department, Project, Role, Allocated Hours, Month, and Progress %
Automatically updates charts and KPIs across the dashboard
Supports real-time collaboration for multiple users in Google Sheets
With structured input and automated visualizations, it ensures accurate, reliable, and up-to-date tracking of your organization’s workforce allocation.
📦 What’s Inside the Resource Allocation Dashboard?
✅ Dashboard Sheet – Visual insights into allocation metrics
✅ Search Sheet – Quick record search and retrieval
✅ Data Sheet – Centralized data input and tracking
✅ Preloaded Sample Data – Ready to test and understand instantly
✅ Automated Charts & Cards – Real-time visualization
✅ Fully Customizable Fields – Add or modify based on your structure
Everything is interconnected and auto-updating — enter your data once and let the dashboard handle the rest. ⚡
🧑💼 Who Can Benefit from This Dashboard?
👨💼 Project Managers – Balance workloads and track team utilization
🏢 HR Professionals – Allocate staff efficiently across departments
🧩 Operations Managers – Identify resource gaps and optimize scheduling
📊 Department Heads – Track performance by department or role
💼 Executives – View overall workforce efficiency at a glance
It’s ideal for organizations managing multiple projects, departments, or client accounts simultaneously.
🧪 How to Use the Resource Allocation Dashboard
Input Data – Enter allocation details in the Data Sheet
Review Dashboard – Analyze charts and KPIs on the main dashboard
Search Records – Use the Search tab for quick lookups
Monitor Utilization – Track workload balance across teams
Optimize Resources – Use insights to redistribute underutilized employees
Built on Google Sheets, the dashboard supports real-time updates, team collaboration, and seamless sharing — making it perfect for remote or hybrid teams. 🌐
🌟 Why Choose This Dashboard?
Real-time visibility into workforce utilization
Interactive charts and automatic calculations
Department, project, and role-based tracking
Detect over-allocation and balance workloads
Fully editable and easy to customize
No coding or add-ons required — just plug and play!
With the Resource Allocation Dashboard in Google Sheets, you can transform how you manage human capital, reduce inefficiencies, and make data-driven staffing decisions to keep your projects on track and your team performing at its best. 💪📈
🔗 Click here to read the Detailed blog post
Watch the step-by-step video Demo:
🔗 Visit our YouTube channel to learn step-by-step video tutorials
Compatibility and Requirements
- Works in Google Sheets. You need a free Google account and a web browser.
- The Dashboard sheet has cards and charts that update from the Data sheet. Google explains how charts work in Add and edit a chart or graph.
Frequently Asked Questions
Which sheets are included?
Three sheets: Dashboard, Search and Data. The template also comes with preloaded sample data so you can see how it works before you enter your own.
What does the Dashboard sheet show?
Cards for number of resources, total allocated hours, average allocated hours, utilization (%) and progress %. Charts break resources and hours down by department, category, project, role and month.
Which fields do I fill in on the Data sheet?
Resource name, department, project, role, allocated hours, month and progress %. The charts and cards update from these entries.
Can I find a single resource record quickly?
Yes. Use the Search sheet to look up a record by resource name, project, department or role.
Is there an Excel or Power BI version?
Yes. See the Resource Allocation Dashboard in Excel and the Resource Allocation Dashboard in Power BI.
Related Resource Planning Templates
- Resource Allocation Dashboard in Excel: the same dashboard for Excel users
- Resource Allocation Dashboard in Power BI: the Power BI edition
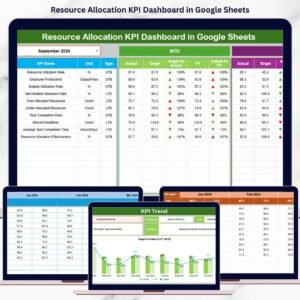
- Resource Allocation KPI Dashboard in Google Sheets: a KPI view with MTD and YTD figures
- Resource Booking Management Tracker in Google Sheets: track resource bookings
- Project Management Pro Bundle: 9 project templates in one download
Browse all Google Sheets dashboards.







Reviews
There are no reviews yet.