
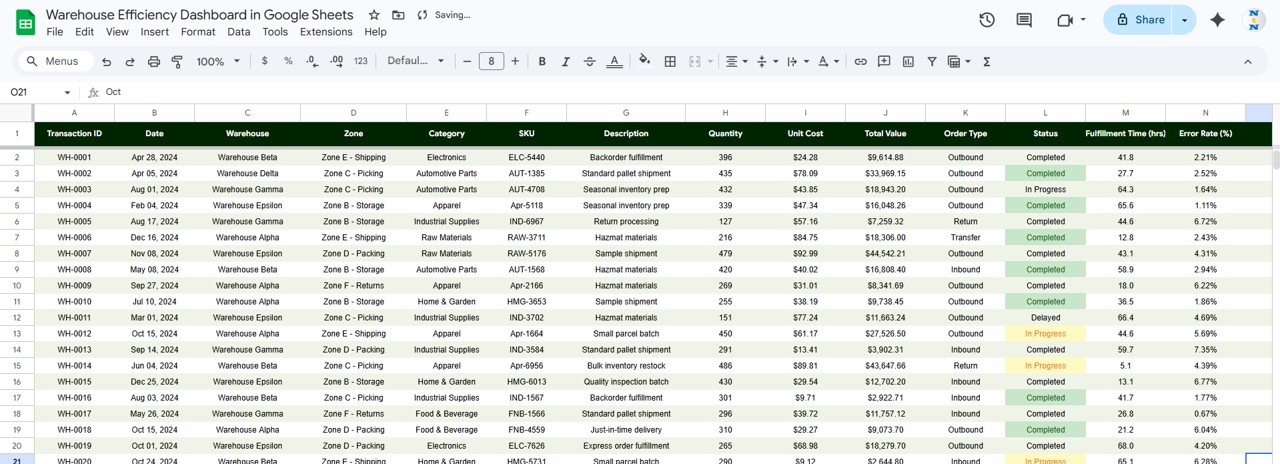
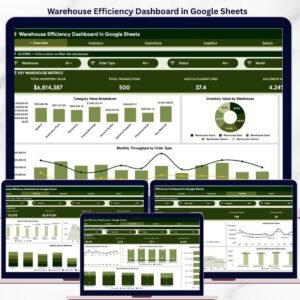
The Warehouse Efficiency Dashboard in Google Sheets tracks 4 core KPIs across 6 interactive pages, with 15+ pre-built charts and slicer-based filters. Setup takes under 10 minutes — just replace the 500 rows of sample data and every chart, card, and analysis updates automatically.Warehouse Efficiency Dashboard in Google Sheets
🌍 Join 8,400+ teams in 40+ countries using NextGenTemplates to replace paid SaaS tools with one-time-purchase Excel, Google Sheets, Power BI, and HTML templates.
✅ Instant download · One-time payment · No subscription · No per-user fees · Lifetime access
🔑 Key Features of Warehouse Efficiency Dashboard in Google Sheets
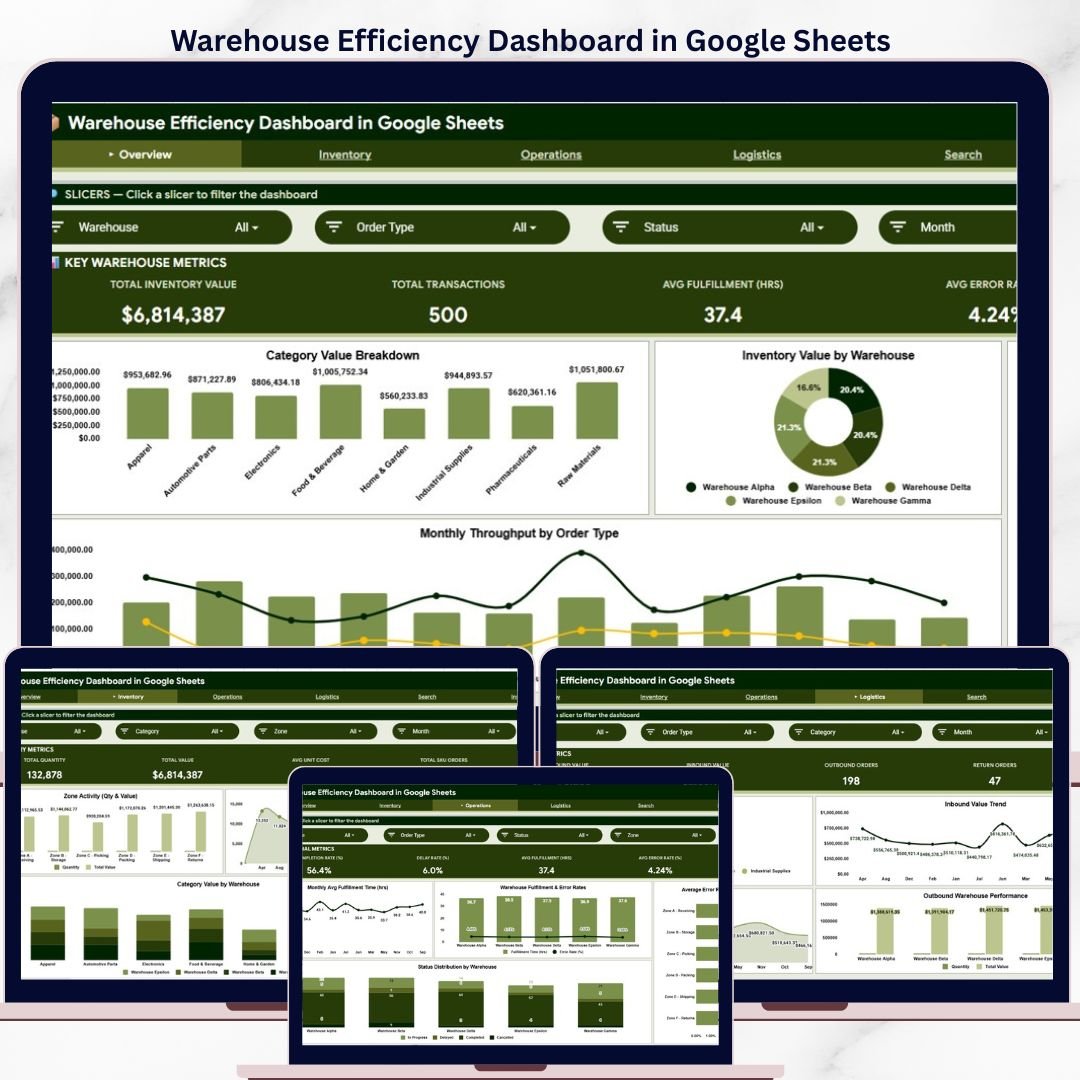
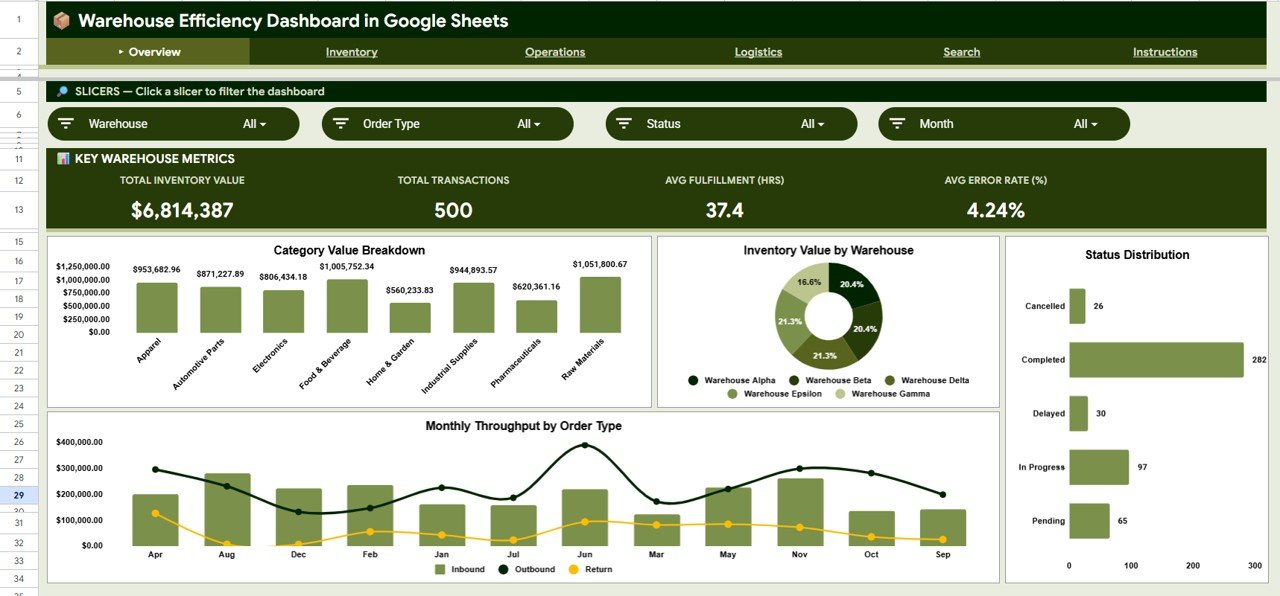
This dashboard delivers 6 purpose-built pages covering inventory analysis, operations monitoring, logistics tracking, and instant transaction search — all inside Google Sheets with zero add-ons required. The Overview page displays 4 KPI cards (Total Inventory Value, Total Transactions, Avg Fulfillment Hours, Avg Error Rate) alongside category and warehouse breakdowns with interactive slicers for on-the-fly filtering.
The Inventory tab breaks down quantity and value by zone, month, category, and warehouse so you can spot overstocking or shortages before they become costly. The Operations tab visualizes fulfillment time trends, error rate comparisons across zones and warehouses, and status distributions to help identify bottlenecks. The Logistics tab tracks inbound and outbound value by category, month, and warehouse — giving your supply chain team a clear picture of goods flow.
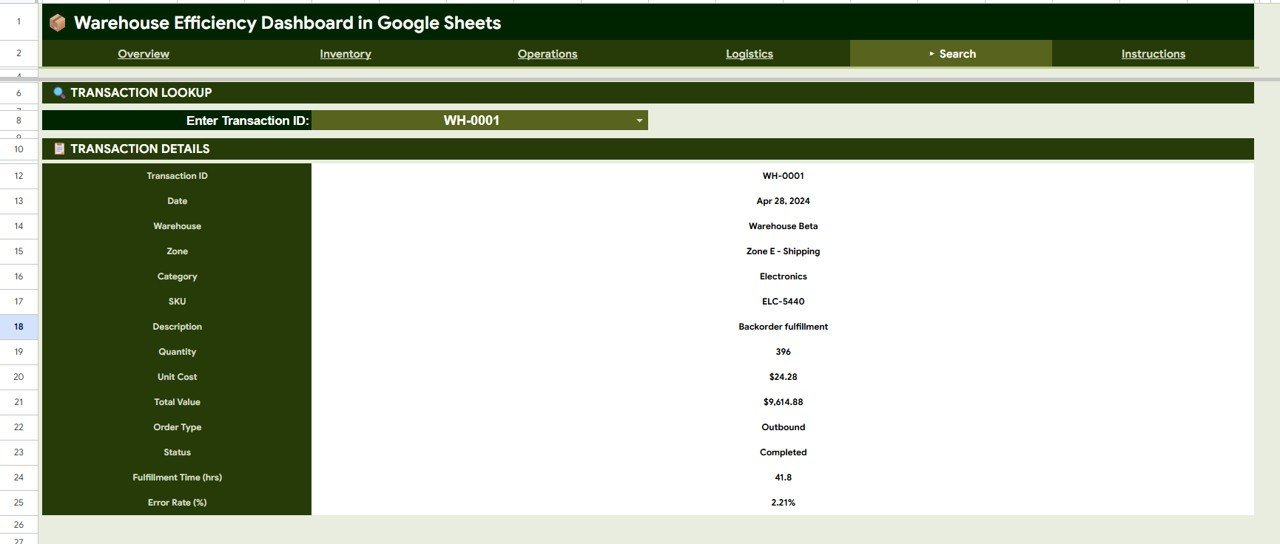
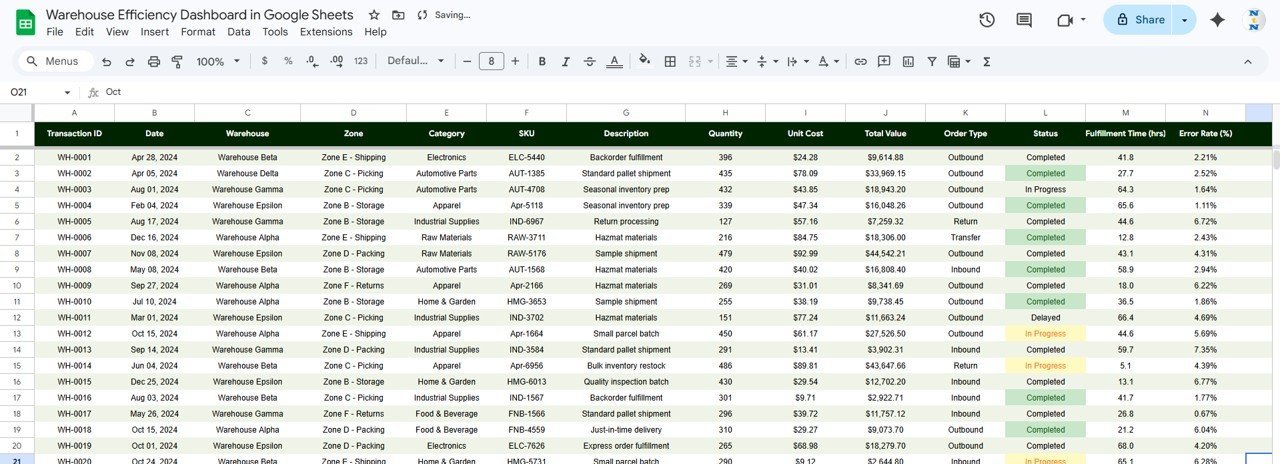
A dedicated Search sheet lets any team member enter a Transaction ID and instantly pull the full record — Date, Warehouse, Zone, Category, SKU, Description, Quantity, Unit Cost, Total Value, Order Type, Status, Fulfillment Time, and Error Rate — without scrolling through the data sheet. If you manage warehouse operations for a mid-size distribution center or third-party logistics provider, this template replaces manual spreadsheet tracking with a structured, visual reporting system.
📦 What’s Inside the Warehouse Efficiency Dashboard in Google Sheets
📊 Overview Page — 4 KPI cards (Total Inventory Value, Total Transactions, Avg Fulfillment Hrs, Avg Error Rate) plus 4 analysis charts: Total Value by Category, Inventory Value by Warehouse, Transactions by Status, and Monthly Throughput by Order Type. Multiple slicers let you filter the entire page by warehouse, zone, category, or date range instantly.
 Warehouse Efficiency Dashboard in Google Sheets
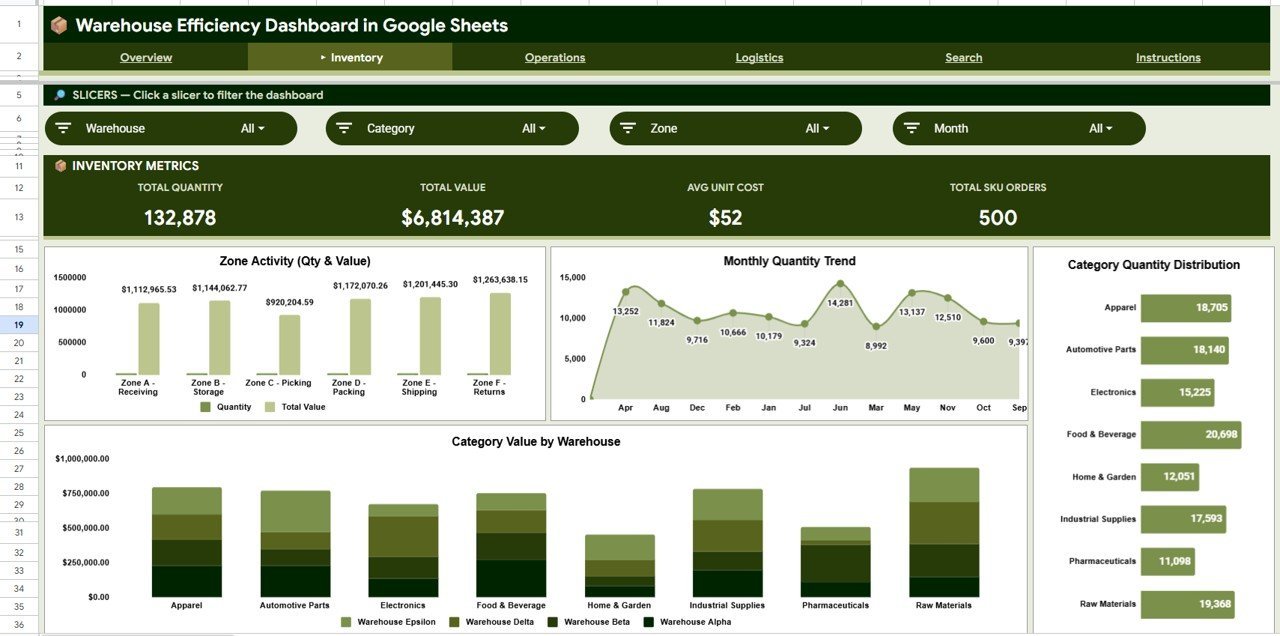
📦 Inventory Page — Analyzes stock levels through 4 focused charts: Quantity and Value by Zone shows how inventory distributes across storage zones, Quantity by Month reveals seasonal stocking patterns, Quantity by Category highlights which product groups hold the most stock, and Category Value by Warehouse compares category-level valuation across locations.
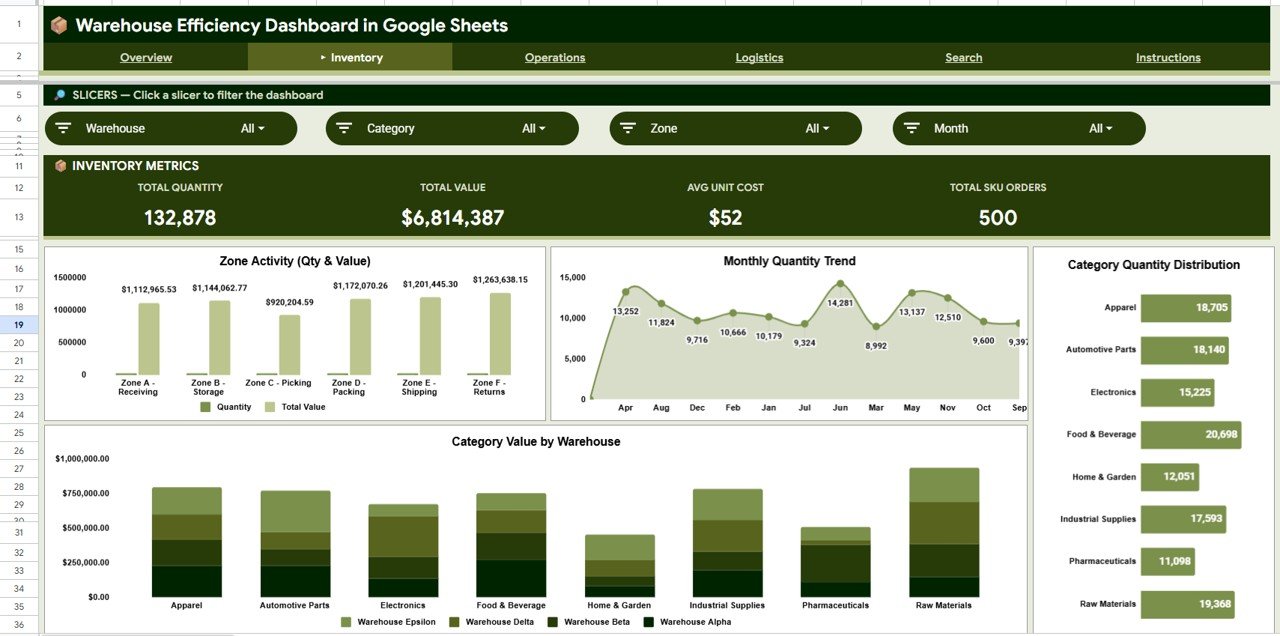 Inventory Analysis
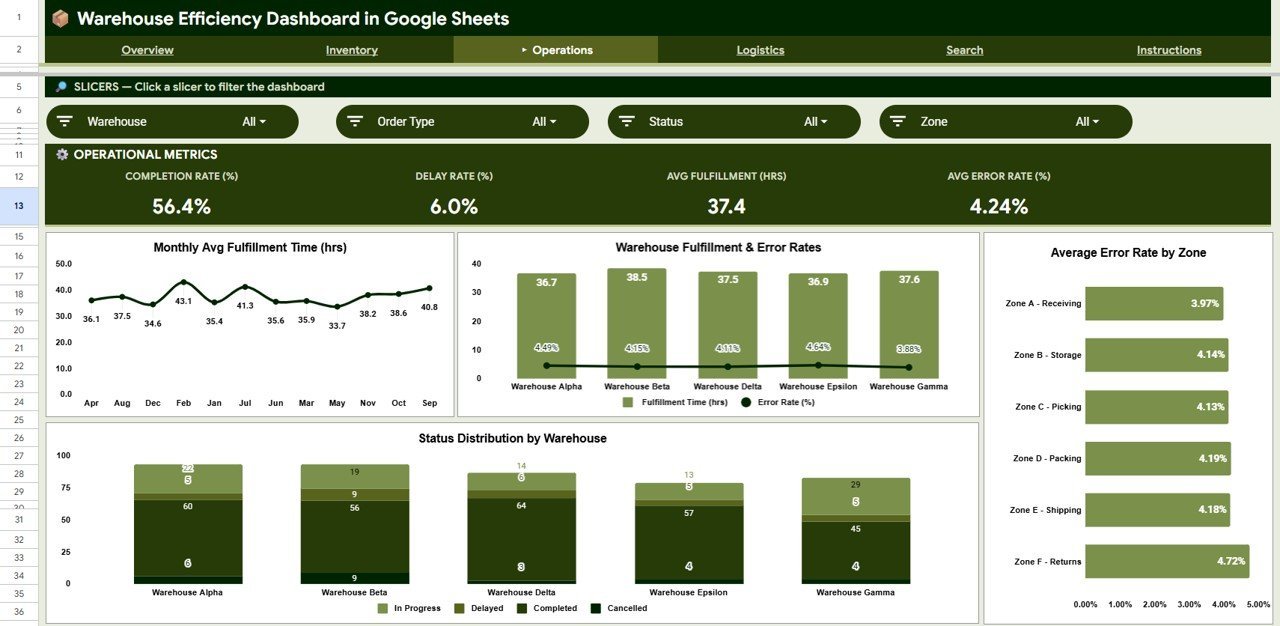
⚙️ Operations Page — Monitors operational health with 4 charts: Avg Fulfillment Time by Month tracks whether order processing speed is improving or declining, Fulfillment Time and Error Rate by Warehouse identifies which facilities need attention, Average Error Rate by Zone pinpoints problem areas within a warehouse, and Status Distribution by Warehouse shows the mix of completed, pending, and delayed orders.
 Operations Analysis
🚚 Logistics Page — Tracks goods movement through 4 visualizations: Outbound Value by Category shows which product categories are shipping the most value, Inbound Value by Month reveals receiving trends over time, Outbound Value by Month tracks shipping volume patterns, and Outbound Quantity and Value by Warehouse compares dispatch performance across locations.
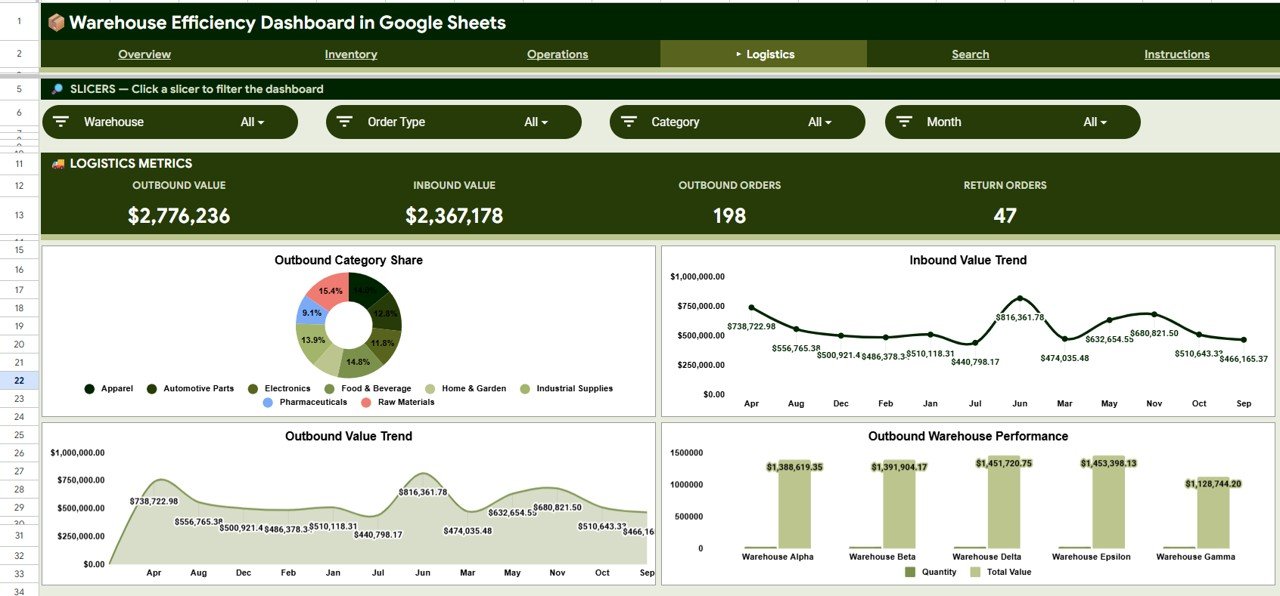 Logistics Analysis
🔍 Search Sheet — Enter any Transaction ID and instantly view the complete details: Transaction ID, Date, Warehouse, Zone, Category, SKU, Description, Quantity, Unit Cost, Total Value, Order Type, Status, Fulfillment Time, and Error Rate. Ideal for investigating individual records without scrolling through the entire data sheet.
 Search Sheet
📋 Data Sheet — The raw data tab holds 500 sample warehouse transaction records. Replace these with your own records in the same column format (Transaction ID, Date, Warehouse, Zone, Category, SKU, Description, Quantity, Unit Cost, Total Value, Order Type, Status, Fulfillment Time, Error Rate) and the entire dashboard refreshes automatically.
 Data Sheet
📊 Warehouse Efficiency Dashboard in Google Sheets vs. Microsoft Excel Dashboard vs. Zoho Inventory — Where This Fits
| Feature | Warehouse Efficiency Dashboard in Google Sheets | Excel Warehouse Dashboard | Zoho Inventory |
|---|---|---|---|
| Cost | $9.99 one-time | $17.99 one-time | $29-249/month |
| Platform | Google Sheets (browser-based) | Microsoft Excel (desktop) | Web app |
| Setup time | Under 10 minutes | Under 10 minutes | 2-5 days onboarding |
| Real-time team collaboration | ✅ Built-in (Google Sheets) | Limited (file sharing) | ✅ Multi-user |
| Mobile access | ✅ Google Sheets app | Limited mobile support | ✅ Mobile app |
| Customizable fields | ✅ Fully editable formulas and layout | ✅ Fully editable | Limited to plan tier |
| Share with link | ✅ One-click sharing | ❌ File attachment needed | ✅ Role-based access |
| Year-1 cost at 5 users | $9.99 total | $17.99 total | $1,740-14,940 |
| Transaction search / lookup | ✅ Built-in Search sheet | ❌ Manual filtering | ✅ Search module |
For warehouse teams that want visual KPI tracking and inventory analysis without monthly SaaS fees, the Warehouse Efficiency Dashboard in Google Sheets sits in the sweet spot.
👥 Who This Template Is For — and Who It’s Not For
✅ This template is built for:
- Warehouse managers at distribution centers tracking 50-5,000 SKUs across multiple zones
- Supply chain coordinators at mid-size companies who need a visual reporting layer without SAP or Oracle licensing
- 3PL operators managing fulfillment for multiple clients and needing per-warehouse performance comparisons
- Operations leads at e-commerce businesses monitoring pick-pack-ship efficiency and error rates
❌ This template is NOT for:
- Enterprise warehouses with 50,000+ SKUs needing real-time WMS integration — consider NetSuite WMS or Manhattan Associates
- Teams requiring barcode scanning or IoT sensor integration — this is a reporting dashboard, not a WMS
- Organizations needing SOC 2 compliance or SSO-based access control
⚙️ How to Use the Warehouse Efficiency Dashboard in Google Sheets
- Open the PDF guide included in your download and click the Google Sheets copy link to create your own editable version in Google Drive.
- Navigate to the Data sheet tab and review the 500 sample records to understand the column structure.
- Replace sample data with your warehouse transaction records — match the existing columns: Transaction ID, Date, Warehouse, Zone, Category, SKU, Description, Quantity, Unit Cost, Total Value, Order Type, Status, Fulfillment Time, Error Rate.
- Check the Overview page — all 4 KPI cards and charts update automatically based on your data.
- Use slicers on the Overview page to filter by warehouse, zone, category, or date range.
- Explore the Inventory, Operations, and Logistics tabs for deeper analysis on stock levels, fulfillment trends, and goods flow.
- Use the Search sheet to look up any individual transaction by entering its Transaction ID.
💼 Real-World Use Cases
Raj manages a 3PL warehouse in Pune handling fulfillment for 8 e-commerce clients. He uses the Warehouse Efficiency Dashboard to compare fulfillment time and error rates across zones, identifying that Zone C consistently runs 22% slower than Zone A. With this data, he reallocated two pickers and cut Zone C fulfillment time by 15% within a month — without investing in a $500/month WMS platform.
Lisa coordinates supply chain operations for a mid-size consumer electronics distributor in Ohio. She tracks inbound and outbound value by month using the Logistics tab, spotting a seasonal spike in Q4 outbound shipments. She used the data to pre-position inventory in September, reducing late shipments by 30% during peak season.
Amir runs warehouse ops for a regional food distributor with 3 locations. He uses the Inventory tab to compare category value across warehouses and identified $42,000 in slow-moving frozen goods at one location. He transferred stock and avoided a $12,000 write-off — all tracked inside a Google Sheets dashboard his entire team can access from their phones.
❓ Frequently Asked Questions
What KPIs does the Warehouse Efficiency Dashboard in Google Sheets track?
The dashboard tracks 4 core KPIs: Total Inventory Value, Total Transactions, Average Fulfillment Time (in hours), and Average Error Rate (%). These update automatically when you replace the sample data with your own warehouse records.
How long does it take to set up this warehouse dashboard?
Setup takes under 10 minutes. Open the PDF guide, click the Google Sheets copy link, navigate to the Data sheet, and paste your warehouse transaction records. All 6 pages update automatically once your data is in place.
Can I use this dashboard for multiple warehouses?
Yes. The Data sheet includes a Warehouse column, and all charts break down metrics by warehouse. You can compare performance across locations using the Overview page slicers and the per-warehouse charts on the Inventory, Operations, and Logistics tabs.
How does this compare to Zoho Inventory for warehouse tracking?
Zoho Inventory starts at $29/month ($348/year) and includes WMS features this template does not. However, for visual KPI tracking, reporting, and performance comparison across zones and warehouses, this $9.99 one-time template covers what most mid-size teams need without monthly fees.
Does this template work on mobile devices?
Yes. Google Sheets is fully accessible through the Google Sheets mobile app on iOS and Android. You can view all dashboard pages, apply slicer filters, and use the transaction search from your phone or tablet.
Can I add more data columns or customize the charts?
Absolutely. Since this is a native Google Sheets file, you can add columns to the Data sheet, modify chart ranges, change colors, and adjust formulas. The file is fully editable — no locked cells or add-on dependencies.
Is this dashboard suitable for a small warehouse with fewer than 100 transactions per month?
Yes. The dashboard works with any volume of data. Whether you have 50 or 5,000 rows in the Data sheet, all charts and KPI cards scale automatically. Smaller datasets simply produce cleaner, easier-to-read visualizations.
👤 About the Author
Built by PK — Microsoft Certified Professional with 15+ years of Excel, Google Sheets, and Power BI experience. Founder of NextGenTemplates, reaching 300K+ subscribers across YouTube channels (@PK-AnExcelExpert, @NextGenTemplates, @NeoTechNavigators). Every template is hand-built and tested before release.
🔗 Explore Related Templates
📊 Warehouse Efficiency Dashboard in Excel — The same warehouse tracking dashboard built for Microsoft Excel users who prefer desktop-based analysis.
📊 Warehouse Efficiency Dashboard in Power BI — Advanced interactive version with drill-through pages and DAX-powered calculations for larger datasets.
📊 Supply Chain Procurement Dashboard in Google Sheets — Track procurement KPIs, supplier performance, and purchasing trends alongside your warehouse data.
📊 Trucking and Logistics Dashboard in Google Sheets — Monitor fleet utilization, delivery performance, and route efficiency to complement your warehouse operations tracking.
📊 Inventory Tracker in Google Sheets — A focused stock tracking template for teams that need detailed item-level inventory management.
Browse all Google Sheets Dashboard Templates or explore Supply Chain & Logistics Templates.
📖 Click here to read the Detailed Blog Post
Watch the step-by-step video tutorial:
🎥 Visit our YouTube channel for step-by-step video tutorials
👉 YouTube.com/@NextGenTemplates


Reviews
There are no reviews yet.