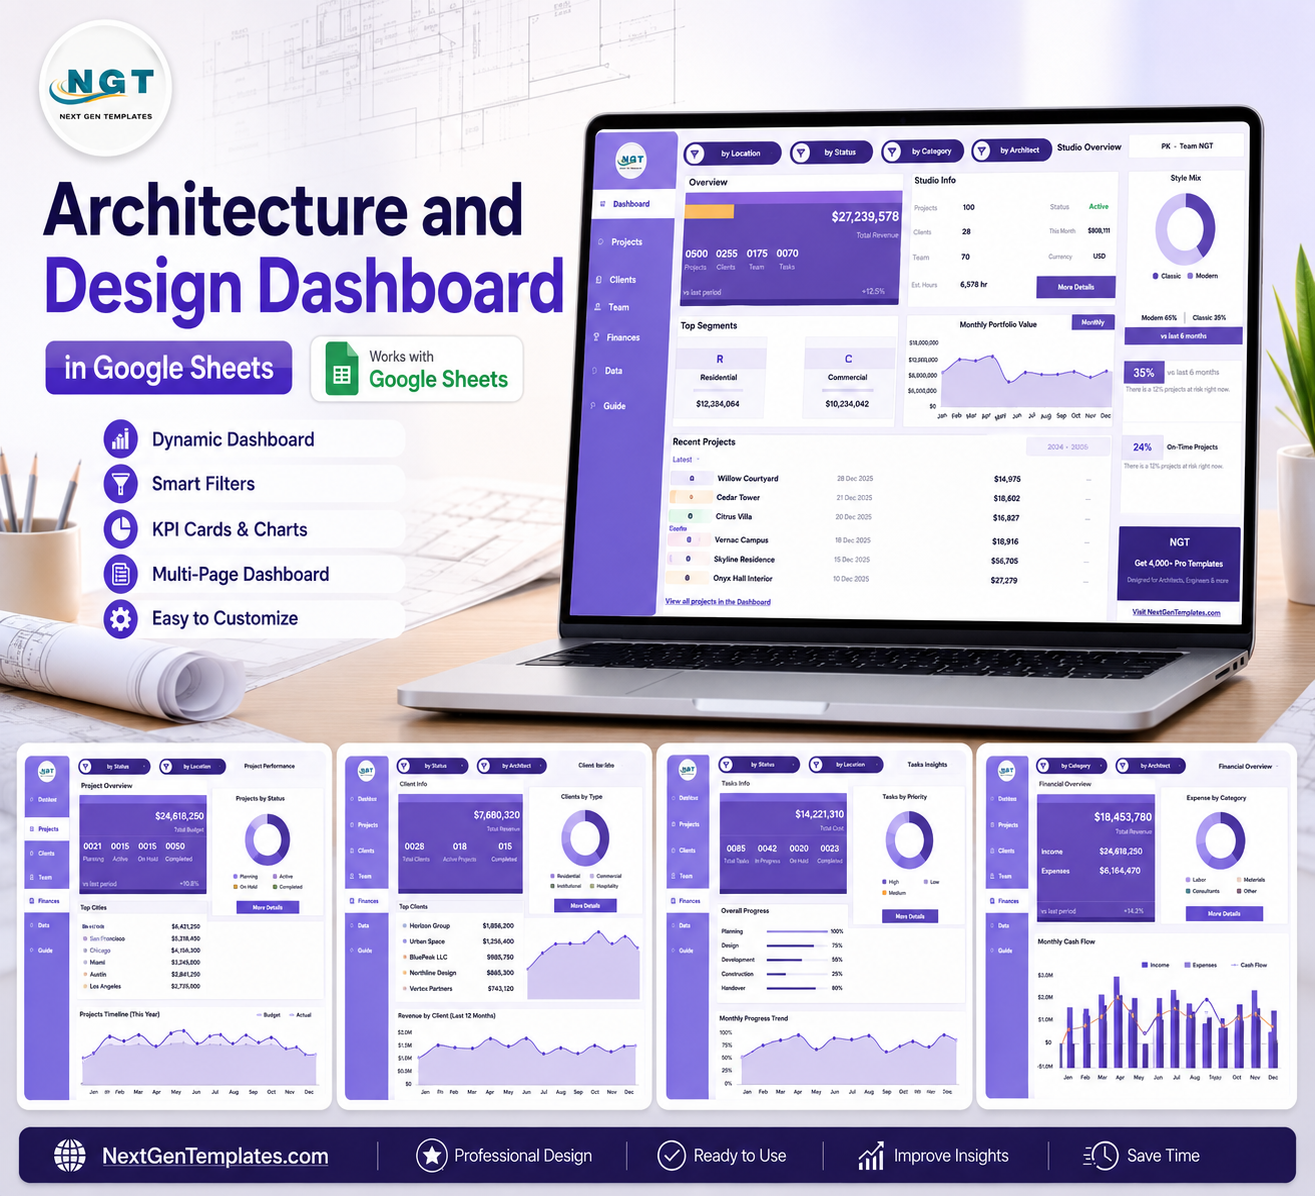
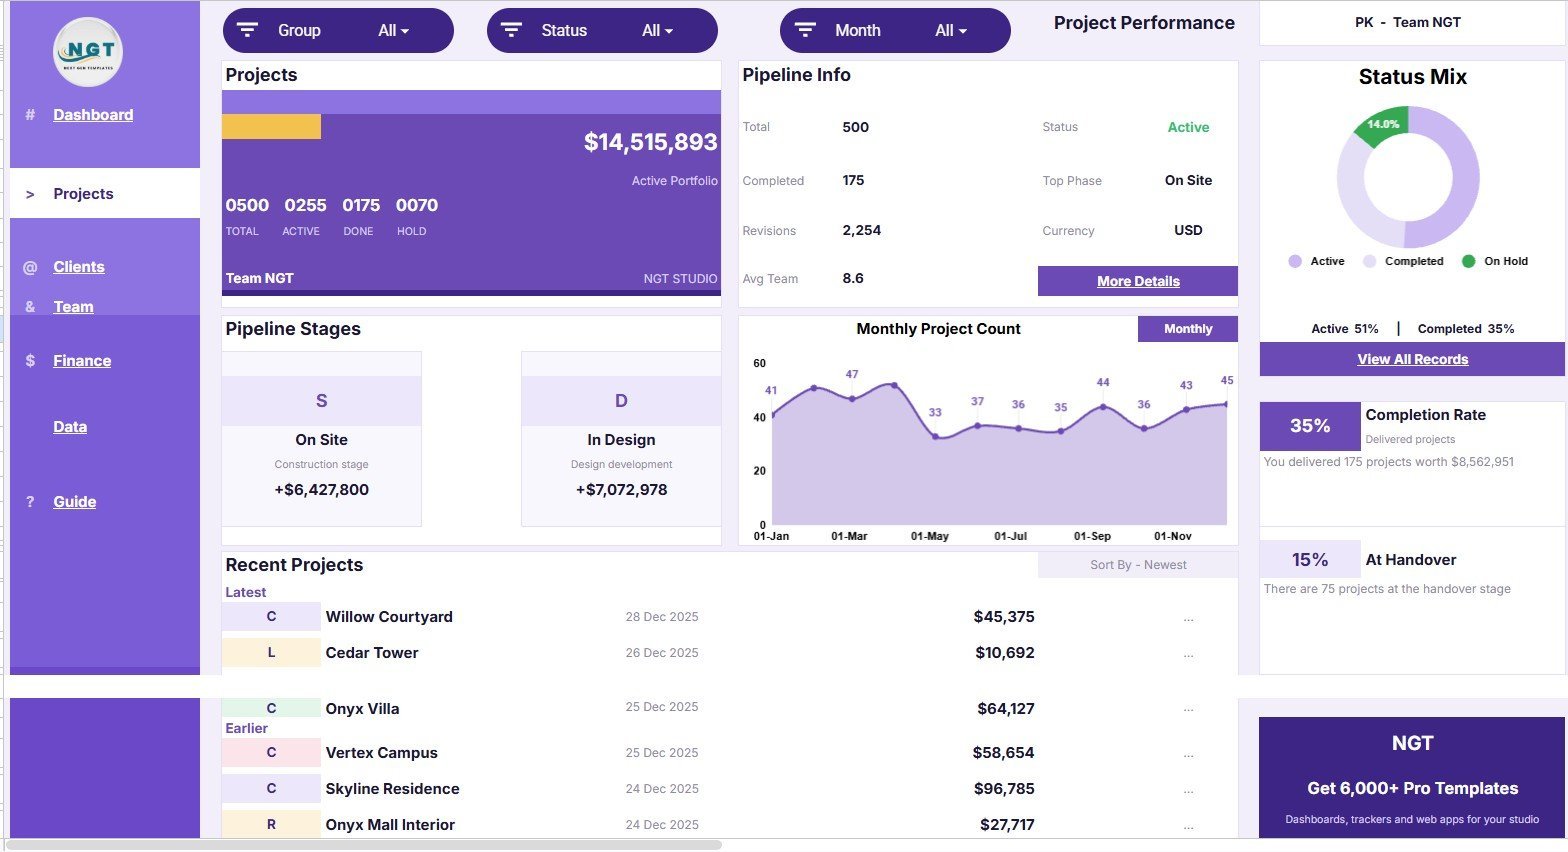
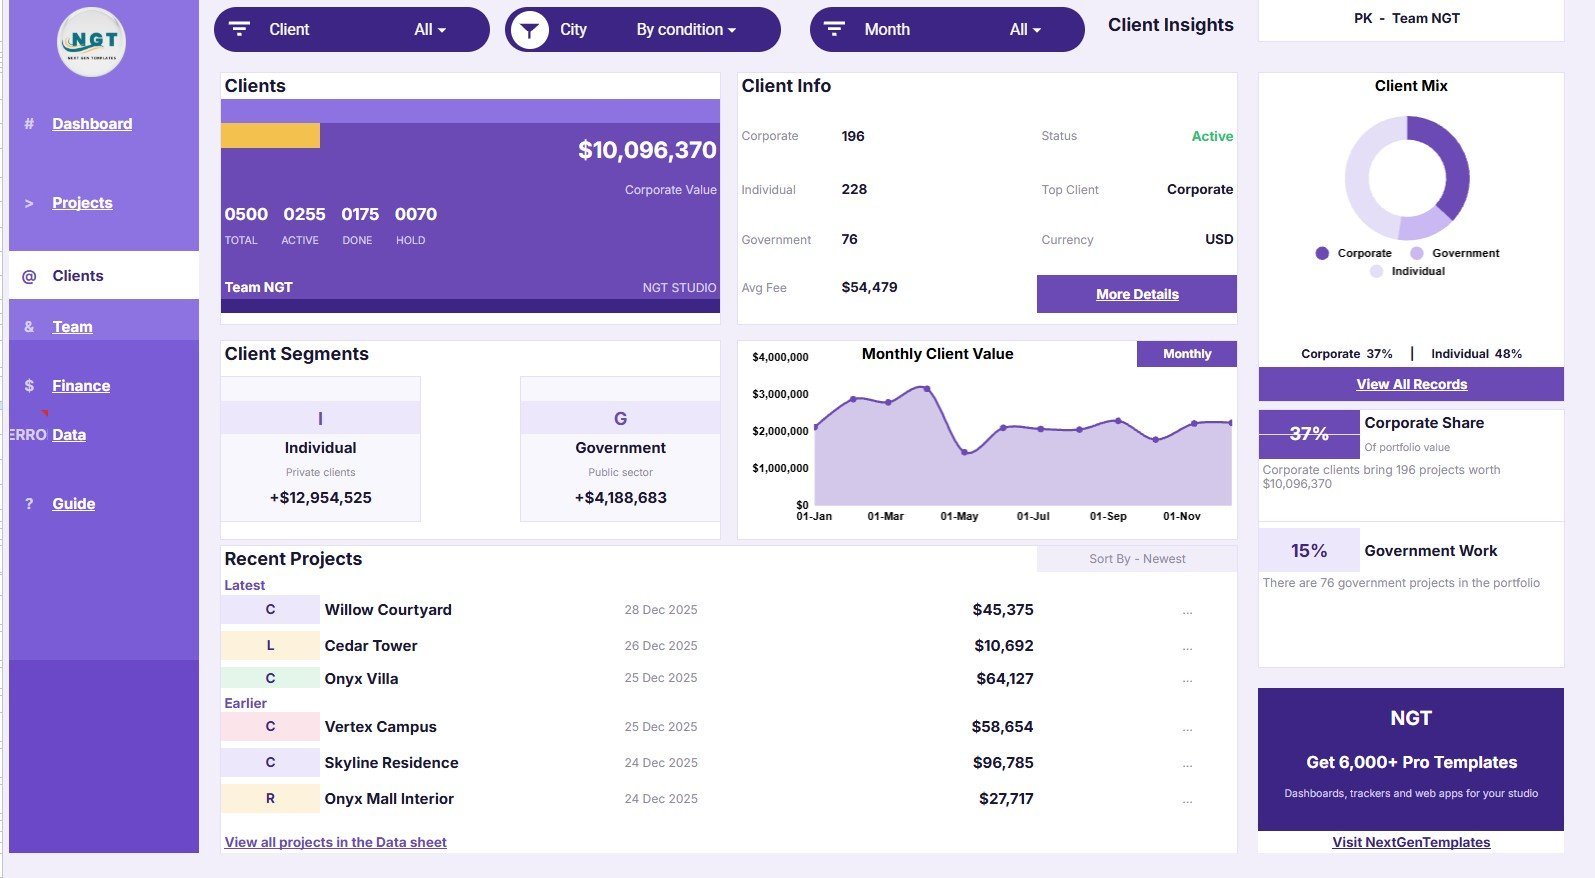
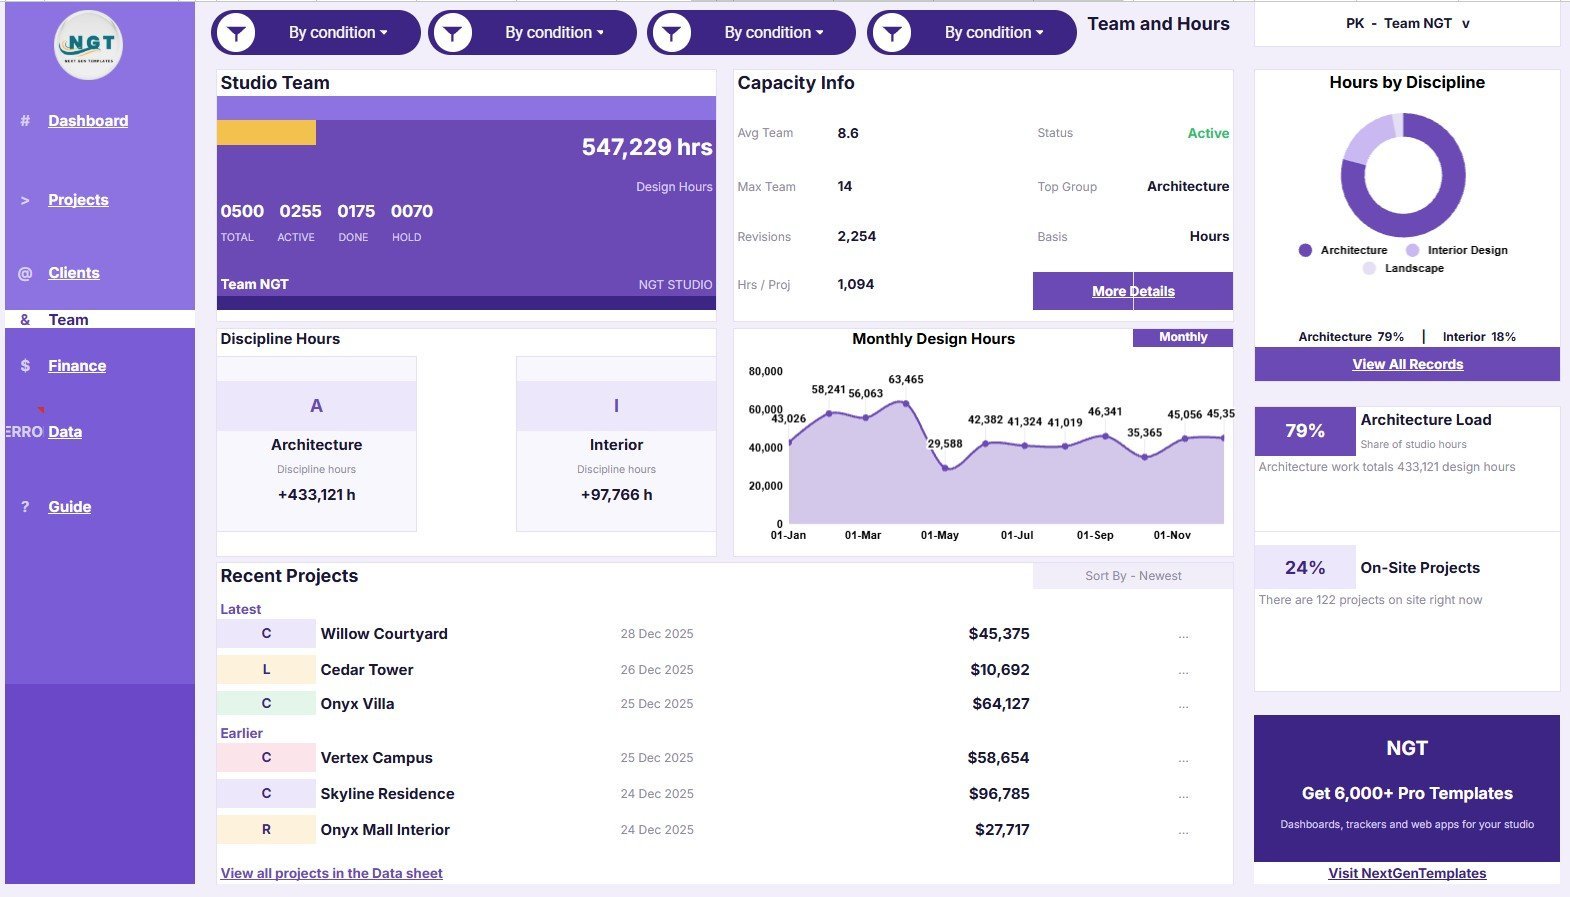
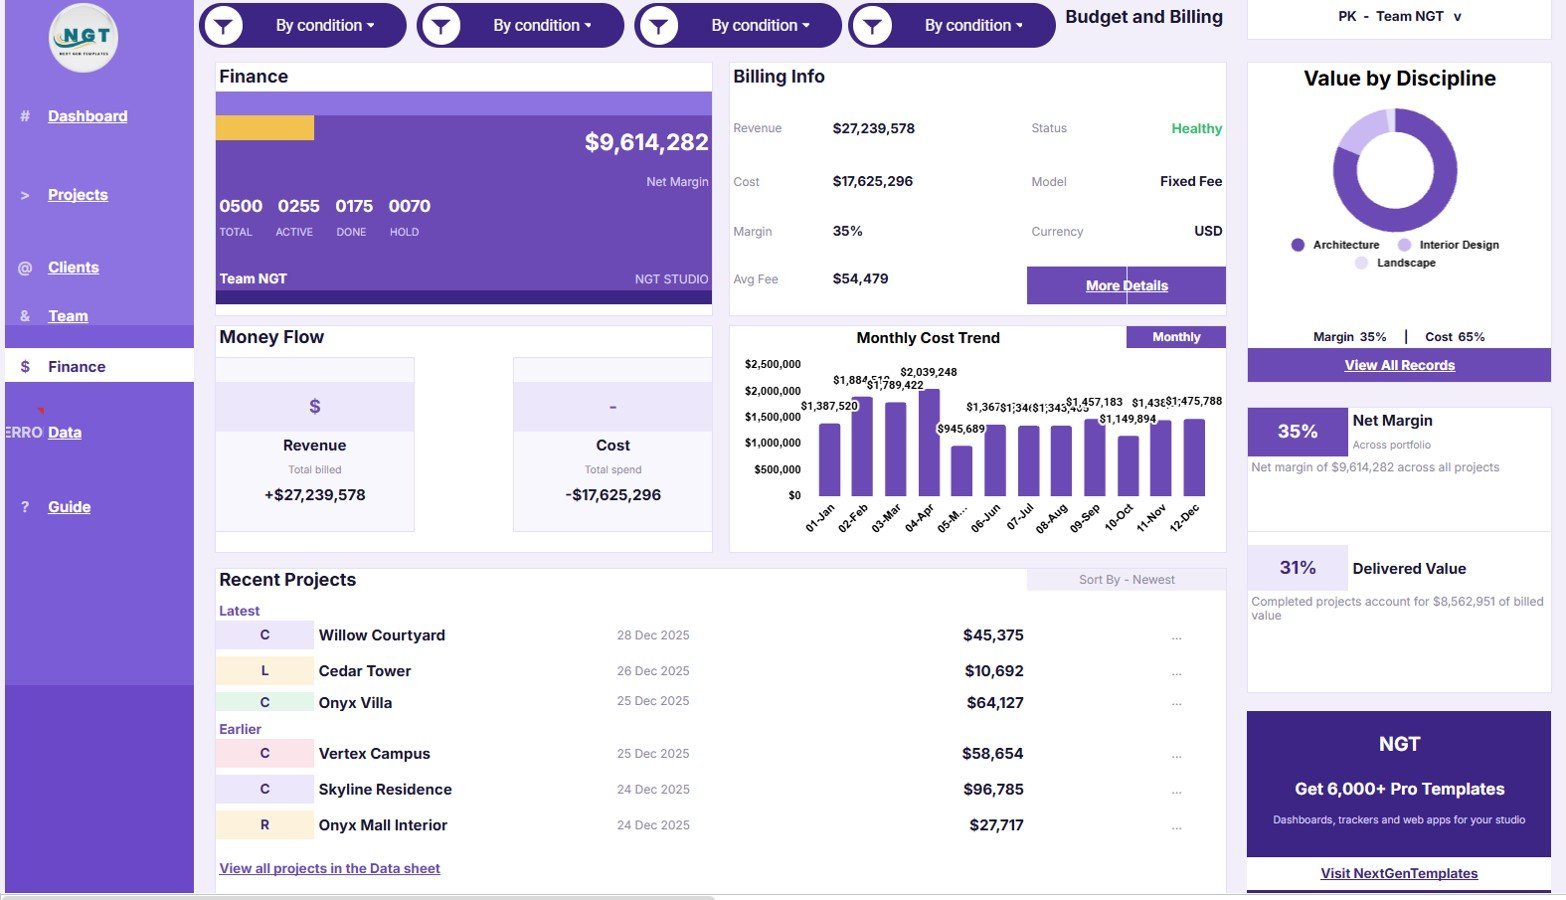
Architecture and Design Dashboard in Google Sheets turns project records into 6 working tabs, 5 dashboard pages, 13 overview KPI cards, and 34 analysis views for portfolio value, delivery status, client mix, team hours, budgets, costs, billing, and margins. Design studios often manage active work, client expectations, hours, and cash flow across separate trackers. This template gives architecture firms, interior design teams, and project managers an editable Google Sheets dashboard with a one-time template price instead of another recurring reporting tool. Built by PK, whose template tutorials reach 300K+ YouTube subscribers, it is ready for your own Google Drive copy. Review all screenshots before purchase and replace the sample data with your own records.
Key Features of Architecture and Design Dashboard in Google Sheets
- 6 connected sheet tabs: Overview, Project Performance, Client Insights, Team and Hours, Budget and Billing, and Data Sheet.
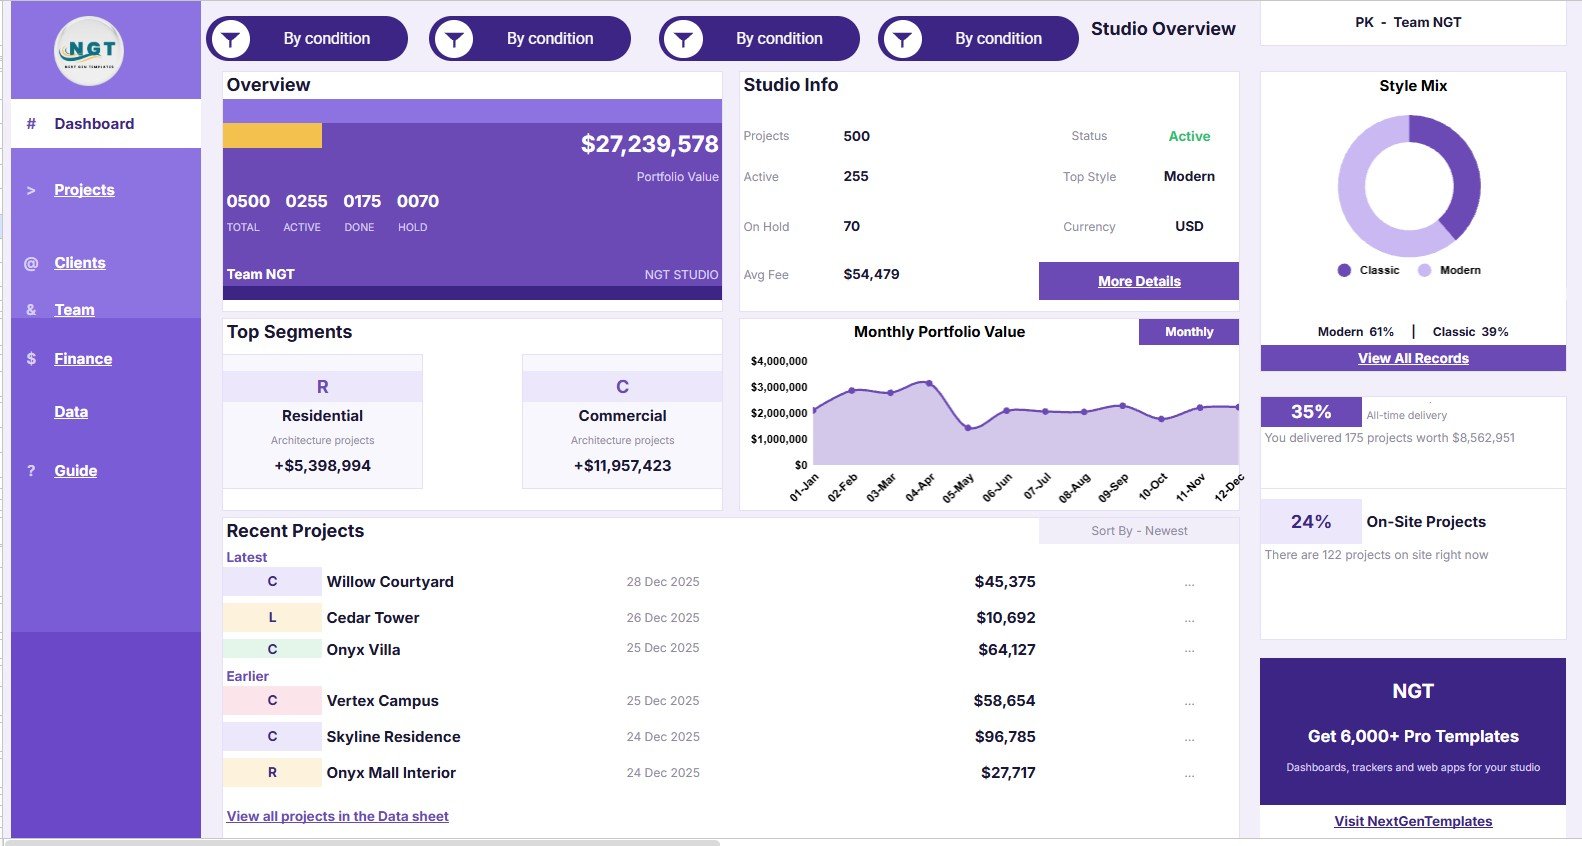
- 13 overview cards: track Total, Active, Done, Hold, Portfolio Value, Projects, On Hold, Avg Fee, Status, Top Style, Currency, All-time delivery, and On-Site Projects.
- 34 analysis views: review portfolio value, style, segment, delivery, site status, project status, clients, hours, capacity, cost, revenue, and margin.
- Slicer-based filtering: narrow the dashboard quickly by the available project, client, status, date, style, and financial dimensions.
- Architecture portfolio tracking: compare active, done, hold, on-site, handover, and delivery-stage work in one place.
- Client and segment reporting: analyze corporate, government, client type, and client segment contribution.
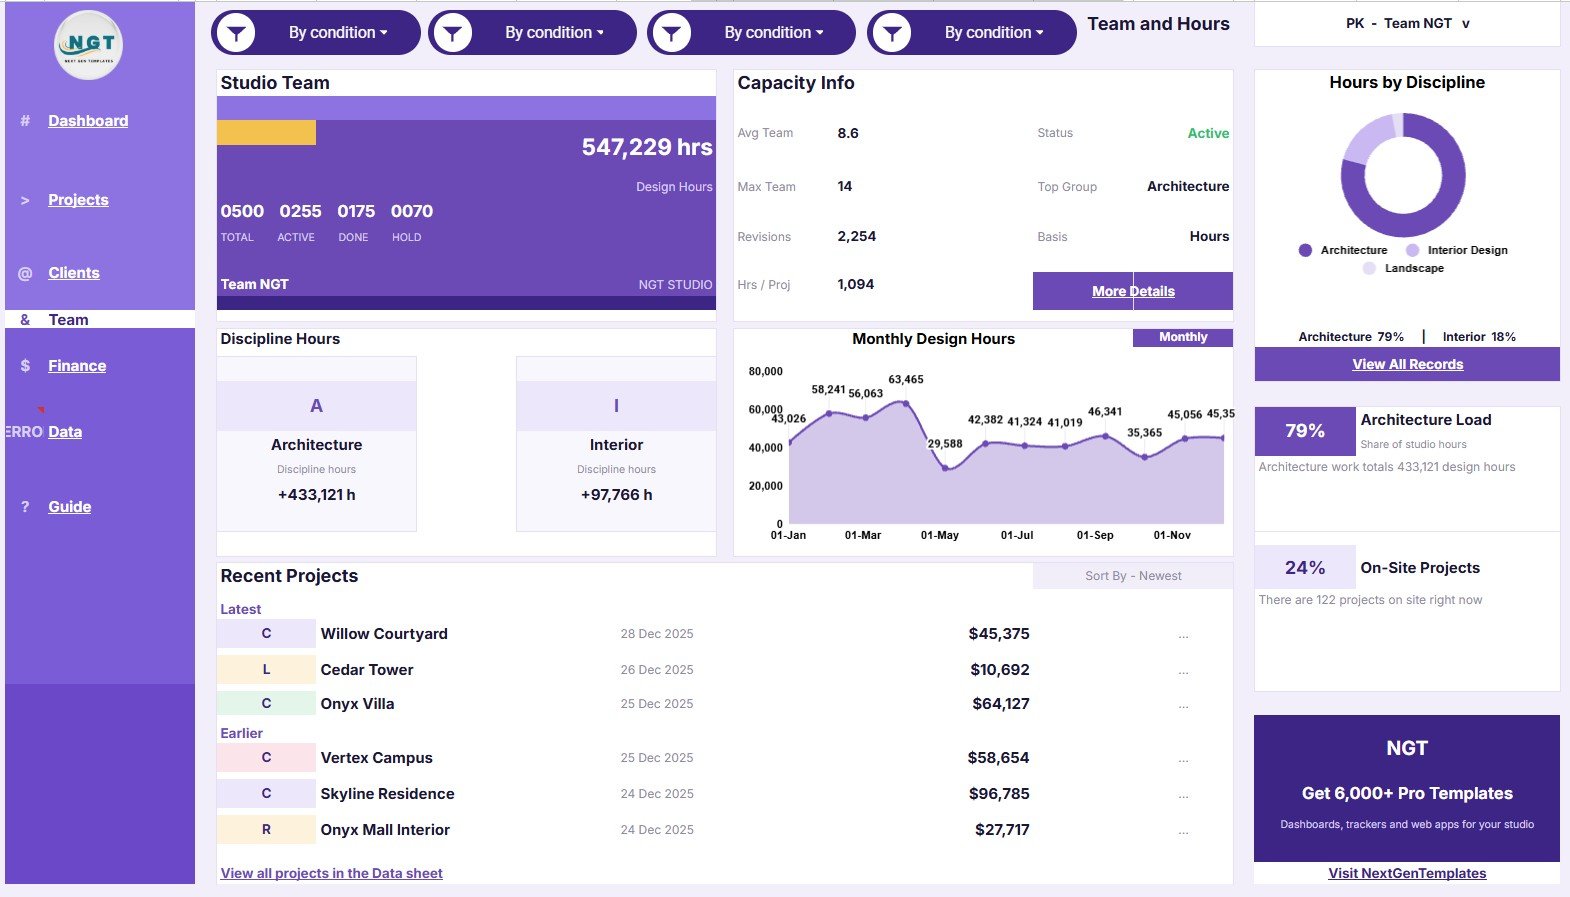
- Team capacity and hours: review design hours by month, discipline, team, and site status.
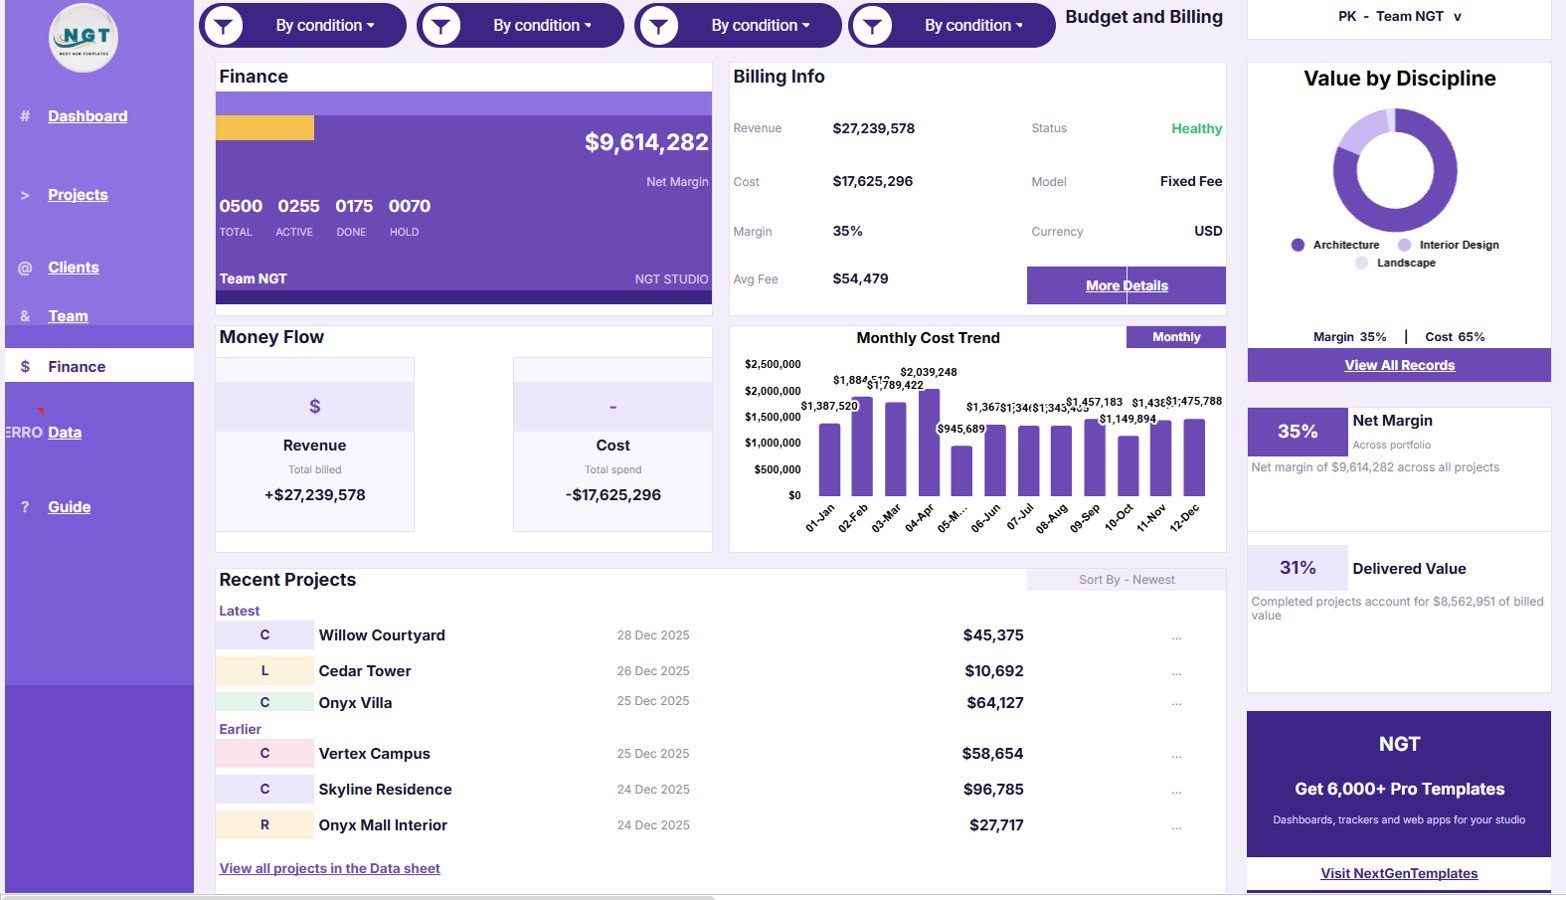
- Budget and billing review: connect revenue, cost, net margin, discipline value, and delivered value.
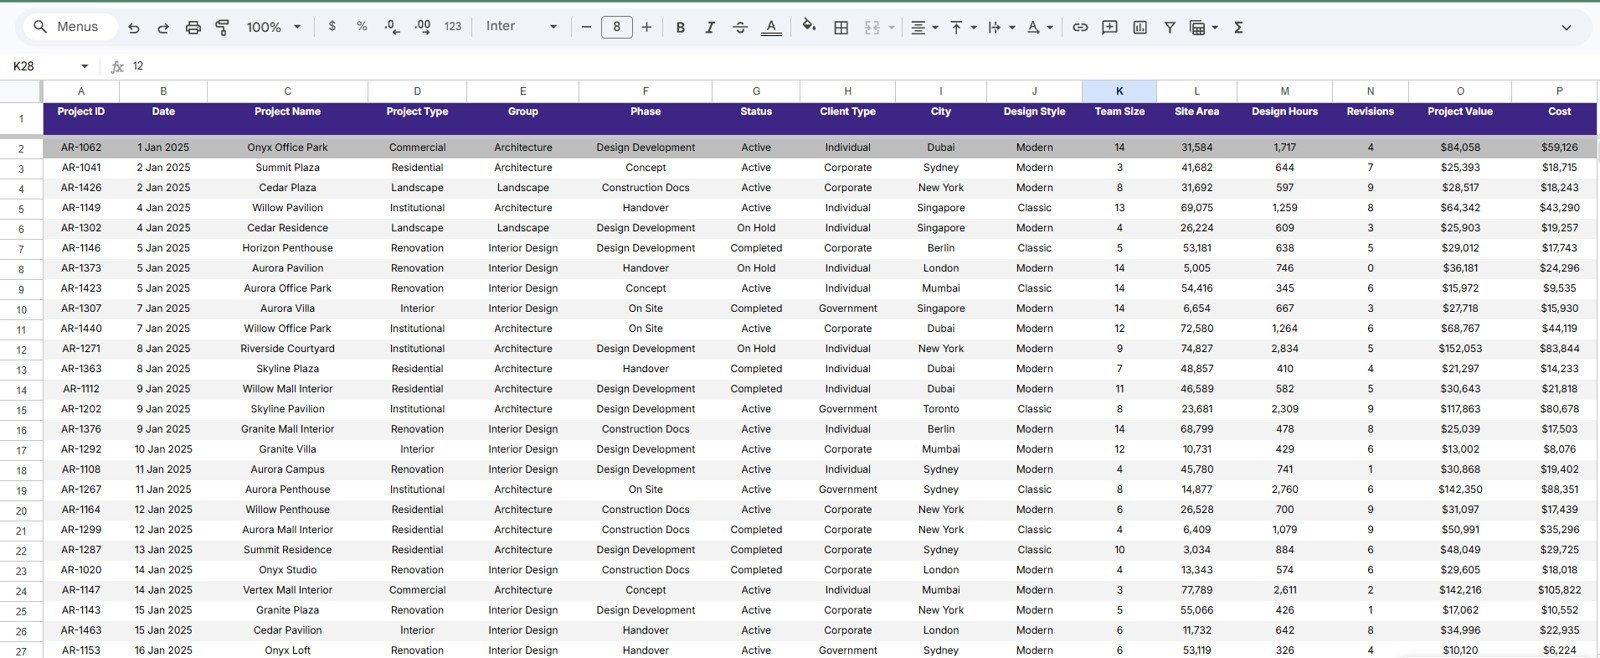
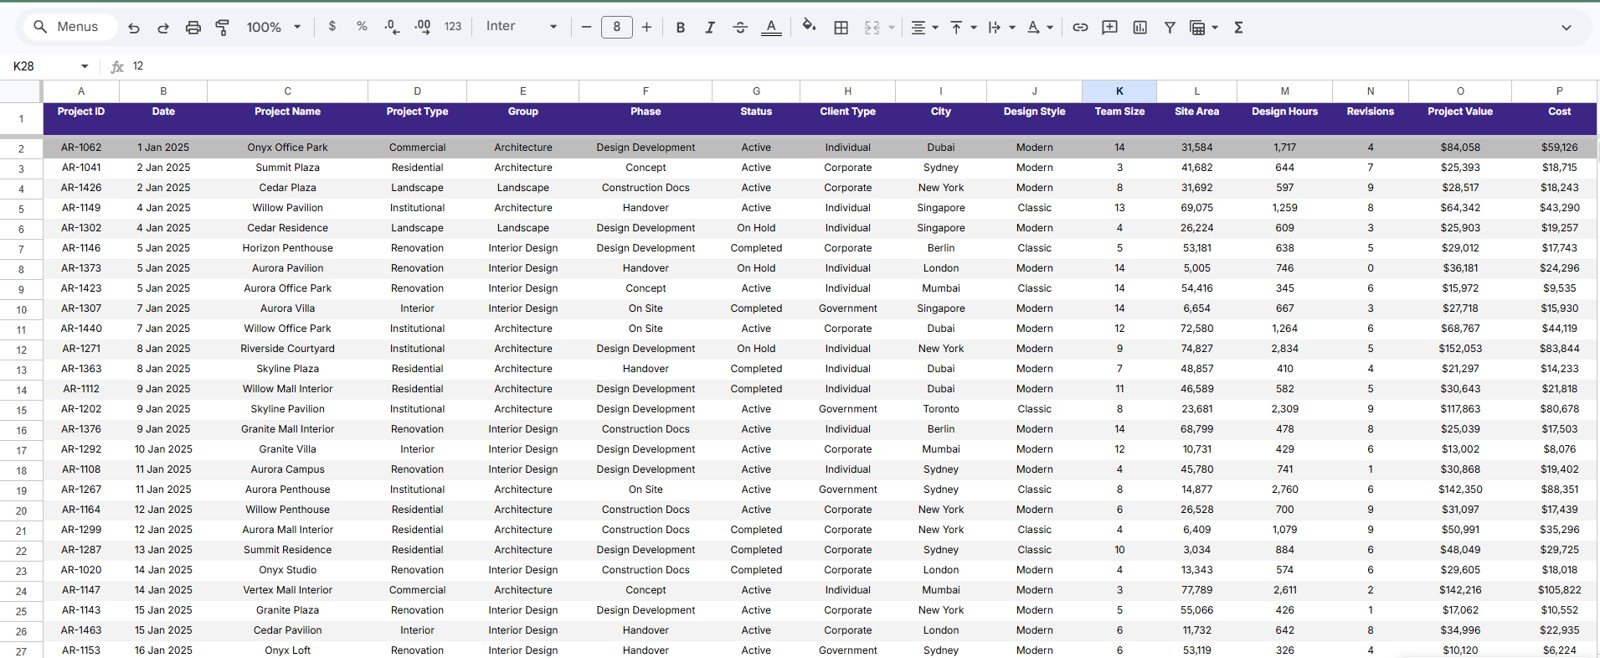
- Editable Data Sheet: replace sample rows using the same column format and refresh your reporting workflow.
What’s Inside the Architecture and Design Dashboard in Google Sheets
1. Overview Page
The Overview page gives decision-makers a fast read on Total, Active, Done, Hold, Portfolio Value, Projects, On Hold, Avg Fee, Status, Top Style, Currency, All-time delivery, and On-Site Projects. It is designed as the first stop for a portfolio review, weekly studio meeting, or project status check.
Portfolio Value by Month shows how project value moves over time. Projects by Style helps compare the design mix across architectural styles, while Portfolio Value by Segment shows which business segments drive the most value.
Projects by Delivery Status and Projects by Site Status help separate completed, active, hold, and on-site work. Recent Projects by Date keeps the latest project activity visible without searching through the raw data.
2. Project Performance
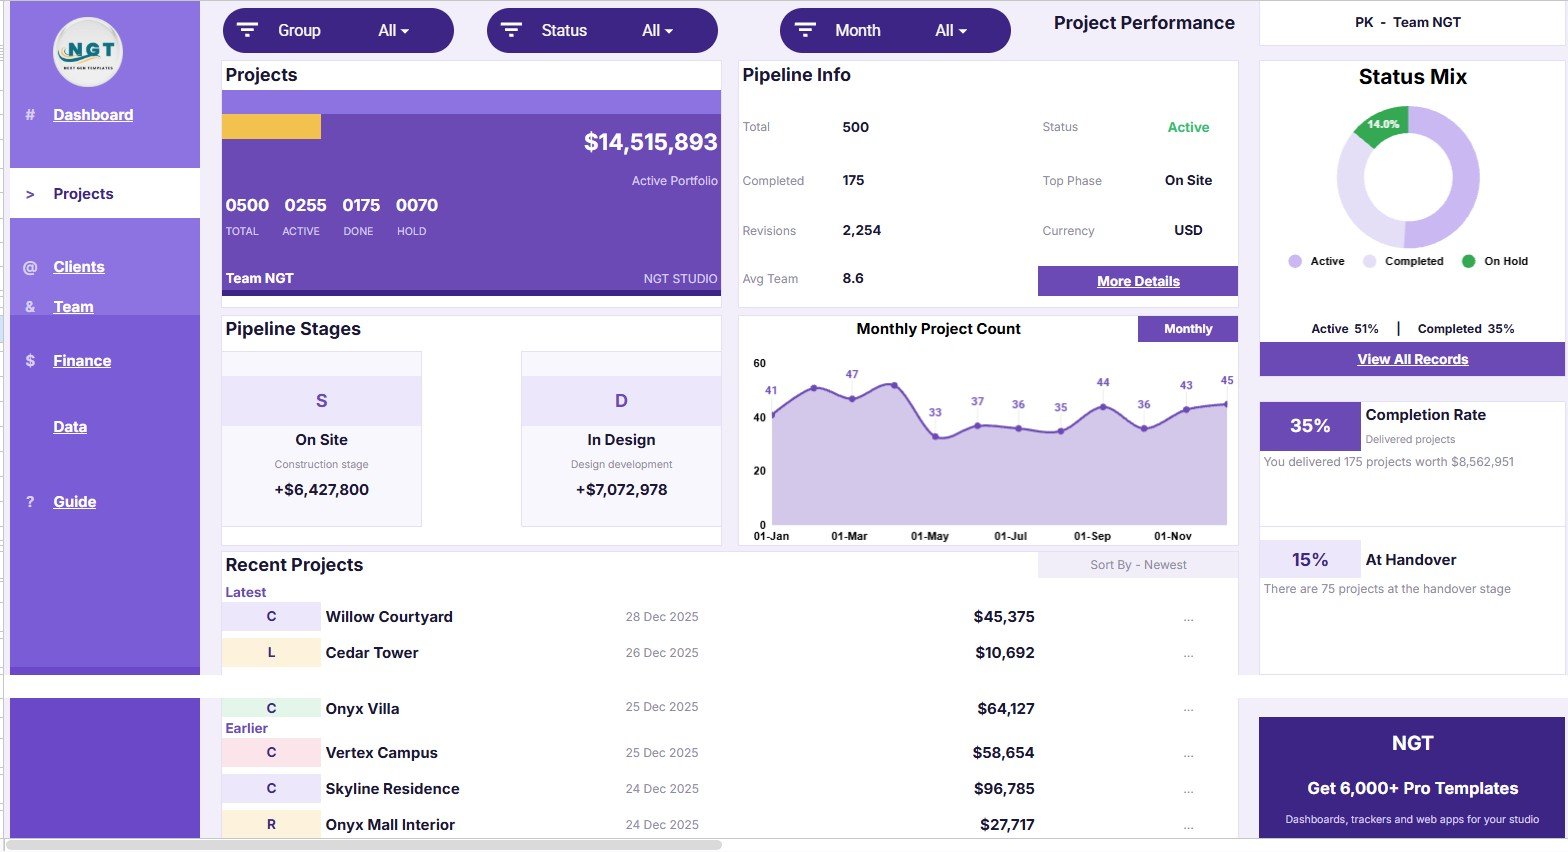
The Project Performance tab reviews Active Portfolio by Project Status, Project Count by Month, Projects by Status, Project Value by Pipeline Stage, Completion Rate by Delivery Status, Projects by Handover Stage, and Recent Projects by Date. This page is useful for project managers who need to understand status, pipeline movement, handover progress, and completion quality.
3. Client Insights
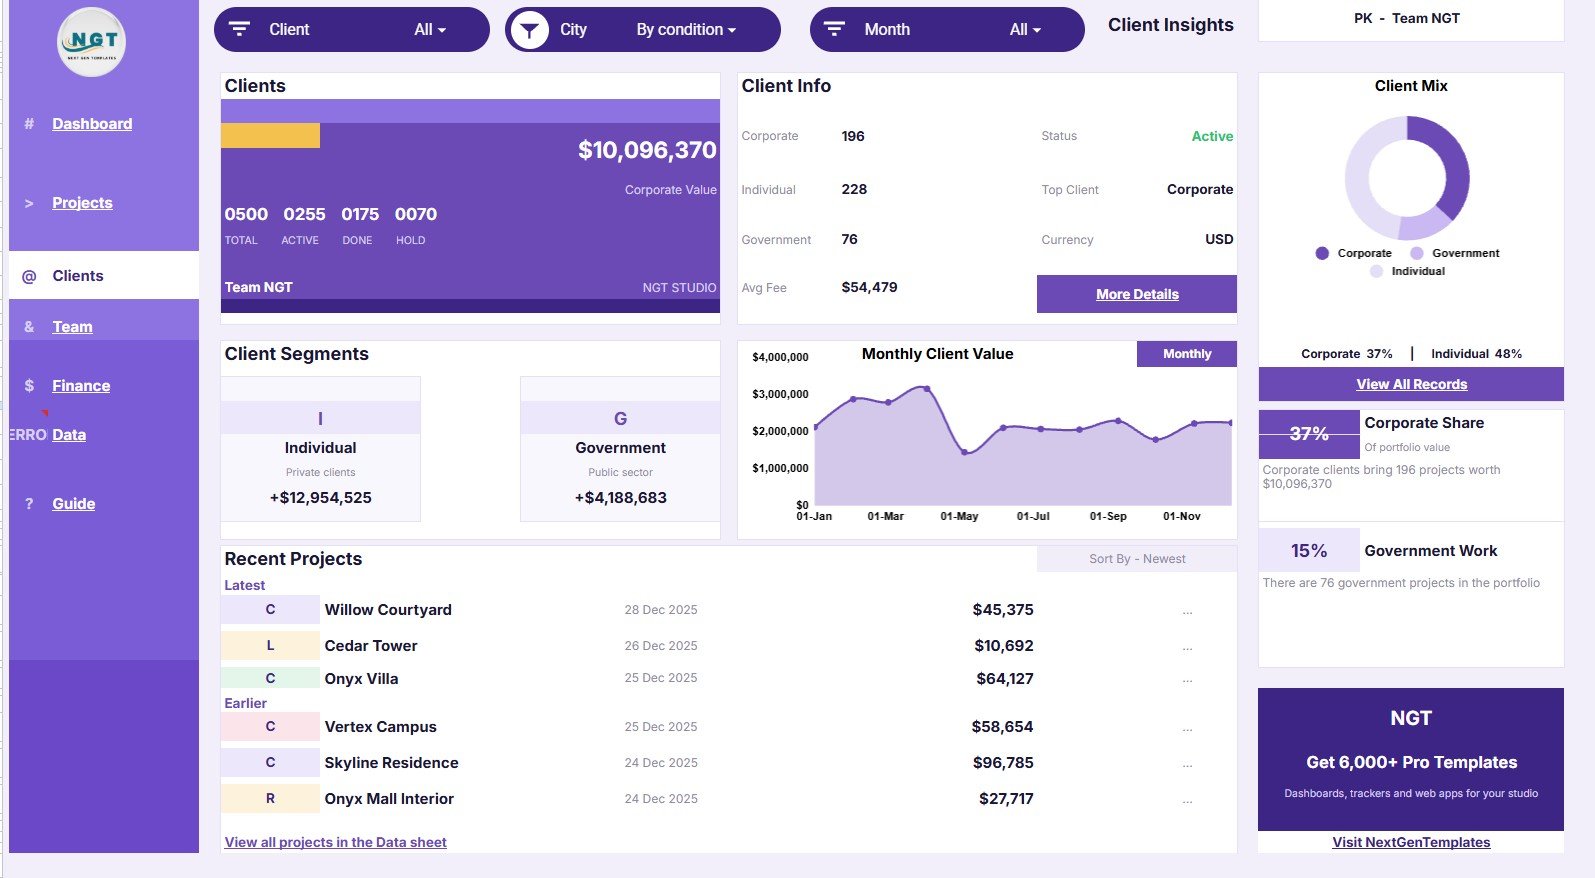
The Client Insights tab shows Corporate Value by Client Type, Client Value by Month, Projects by Client Type, Client Value by Client Segment, Portfolio Value by Corporate Share, Projects by Government Work, and Recent Projects by Date. Use it to compare client groups, understand corporate and government exposure, and identify where client value is concentrated.
4. Team and Hours
The Team and Hours tab tracks Design Hours by Month, Hours by Discipline, Design Hours by Discipline, Capacity by Team, Architecture Load by Discipline, Projects by Site Status, and Recent Projects by Date. It helps studio leads compare workload, team capacity, discipline demand, and on-site project movement.
5. Budget and Billing
The Budget and Billing tab reviews Net Margin by Finance Summary, Revenue by Money Flow, Cost by Month, Value by Discipline, Margin by Portfolio, Delivered Value by Completion Status, and Recent Projects by Date. This page helps owners and finance leads see how design work turns into revenue, cost, delivered value, and margin.
6. Data Sheet Tab
The Data Sheet is where you add architecture and design project records in the same format used by the template. Keep the column structure consistent so the dashboard pages, cards, charts, and slicers continue to read the data correctly.
Architecture and Design Dashboard in Google Sheets vs. Microsoft Excel Dashboard vs. Paid Project Management SaaS – Where This Fits
| Feature | This Google Sheets Template | Microsoft Excel Dashboard | Paid Project Management SaaS |
|---|---|---|---|
| Cost | $9.99 sale price | Template cost plus Excel access where needed | Monthly or annual subscription |
| Platform | Google Sheets in browser | Desktop or web Excel | Vendor-hosted application |
| Setup time | Copy the file and replace sample rows | Open workbook and replace data | Account setup, permissions, and workflow configuration |
| Real-time team collaboration | Native Google Drive sharing | Available with Microsoft cloud sharing | Usually included by plan |
| Mobile access | Google Sheets app or browser | Excel app or browser | Vendor app or browser |
| Customizable fields | Editable sheet structure | Editable workbook structure | Limited by vendor configuration |
| Share with link | Yes, with owner-controlled permissions | Yes, with compatible cloud storage | Usually account based |
| Year-1 cost at 5 users | $9.99 template price | Depends on existing licenses | Often a recurring team subscription |
| Architecture-specific views | Project, client, hours, capacity, budget, billing, and data tabs included | Possible with custom setup | Varies by product and plan |
Who This Template Is For – and Who It’s Not For
Best for: architecture firms, interior design studios, project managers, design consultants, studio owners, and operations teams that track projects from manual entries or exported records.
Not the right fit for: teams that need automatic BIM integration, live accounting sync, timesheet approval workflows, proposal automation, CRM pipelines, or enterprise-grade permissions. This is a reporting and tracking template, not a full practice-management platform.
How to Use the Architecture and Design Dashboard in Google Sheets
- Open the PDF guide from your download and use the Google Sheets copy link.
- Create your own editable copy in Google Drive.
- Review the Data Sheet and keep the supplied column order.
- Replace sample records with your architecture and design project data.
- Use slicers to filter the dashboard by project, client, status, style, date, discipline, and financial fields where available.
- Start with Overview, then move into project, client, team, and billing pages for deeper analysis.
Real-World Use Cases
Aarav, studio owner: reviews Portfolio Value, Active work, On Hold projects, and Avg Fee before a weekly leadership meeting, then uses Budget and Billing to check margin pressure.
Meera, project manager: filters Project Performance by status and pipeline stage to understand what is active, delayed, handed over, or waiting for client action.
Daniel, design operations lead: uses Team and Hours to compare design hours by discipline and team capacity before reallocating work across architects and designers.
Frequently Asked Questions
What does this architecture dashboard track?
It tracks project status, portfolio value, delivery status, site status, design style, client type, client segment, corporate share, government work, design hours, team capacity, discipline load, cost, revenue, margin, and billing performance.
Is this built for Google Sheets?
Yes. The template is designed for Google Sheets and is used from your own editable Google Drive copy.
Does it connect automatically to project management or accounting software?
No. Add or paste project records into the Data Sheet. API integrations, accounting sync, and automatic imports are not included in this version.
Can I customize the dashboard?
Yes. Google Sheets files are editable, but preserve formulas, chart ranges, and the data column structure unless you are comfortable updating them.
Can multiple people use the dashboard?
Yes. You can share the Google Sheet through Google Drive with viewer, commenter, or editor access depending on your team’s needs.
What should I check before using it for reporting?
Check missing project values, inconsistent status labels, duplicate project names, date formats, currency consistency, and discipline names before relying on the dashboard for decisions.
About the Author
Built by PK – Microsoft Certified Professional with 15+ years of Excel, Google Sheets, and Power BI experience. Founder of NextGenTemplates, reaching 300K+ subscribers across YouTube channels. Every template is hand-built and tested before release.
Explore Related Templates
- Interior Design KPI Dashboard in Google Sheets
- Construction Project Cost Dashboard in Google Sheets
- Project Task Management Dashboard in Google Sheets
- Browse more Google Sheets templates and Google Sheets dashboards.
Click here to read the Detailed Blog Post
Visit our YouTube channel for step-by-step dashboard tutorials
Download the Architecture and Design Dashboard in Google Sheets to turn project records into clearer portfolio, client, team, budget, and billing insights.
Watch the step-by-step video Demo:
Last updated: July 26, 2026.