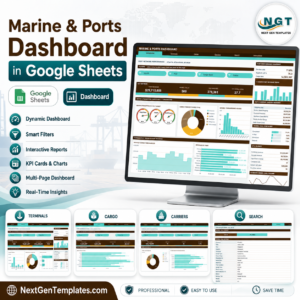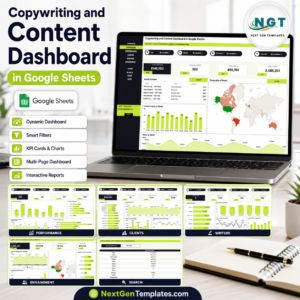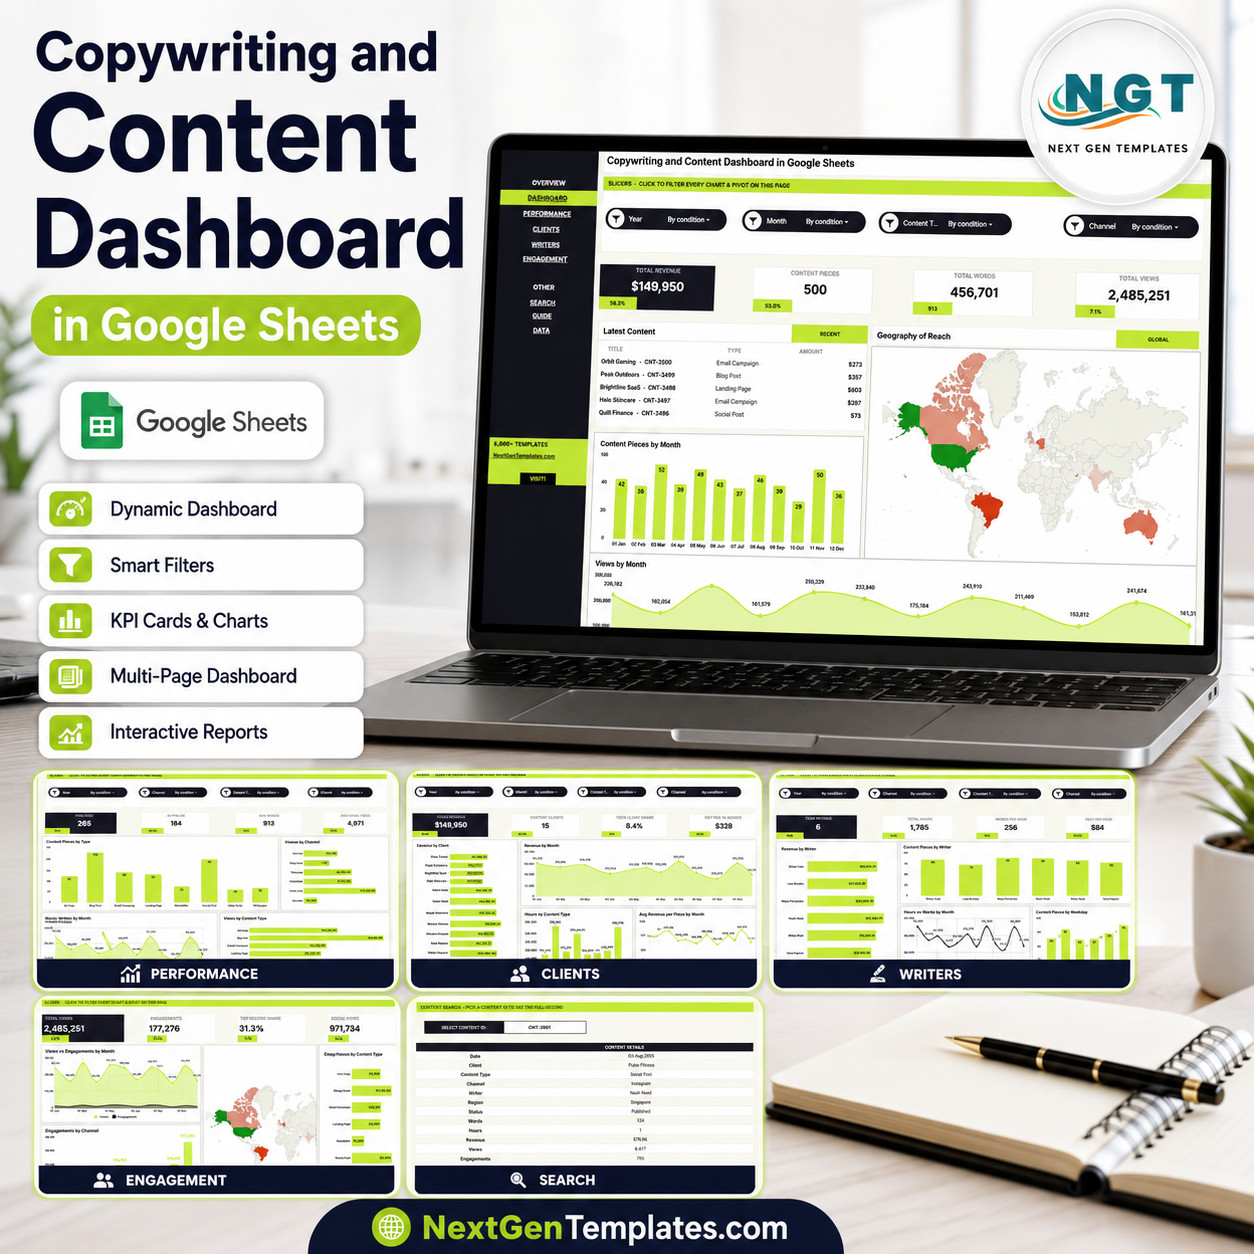
The Copywriting and Content Dashboard in Google Sheets turns one content operations table into 7 working tabs, 4 headline KPI cards, and 16 chart views. It tracks Total Revenue, Content Pieces, Total Words, and Total Views, then lets teams filter results by client, writer, channel, status, country, region, content type, and time period. Built by PK, whose template tutorials reach 300K+ YouTube subscribers, this editable Google Sheets template gives marketers, agencies, and content teams a one-time purchase alternative to recurring reporting software.
Key Features of Copywriting and Content Dashboard in Google Sheets
- 4 executive KPI cards: Review Total Revenue, Content Pieces, Total Words, and Total Views from the top of the Overview page.
- 7 structured sheet tabs: Overview, Performance Analysis, Clients Analysis, Writers Analysis, Engagement Analysis, Search Sheet, and Data Sheet.
- 16 chart views: Analyze revenue, production, reach, views, words, hours, clients, writers, countries, regions, channels, and engagement.
- Multiple slicers: Filter the dashboard quickly without rebuilding charts or formulas.
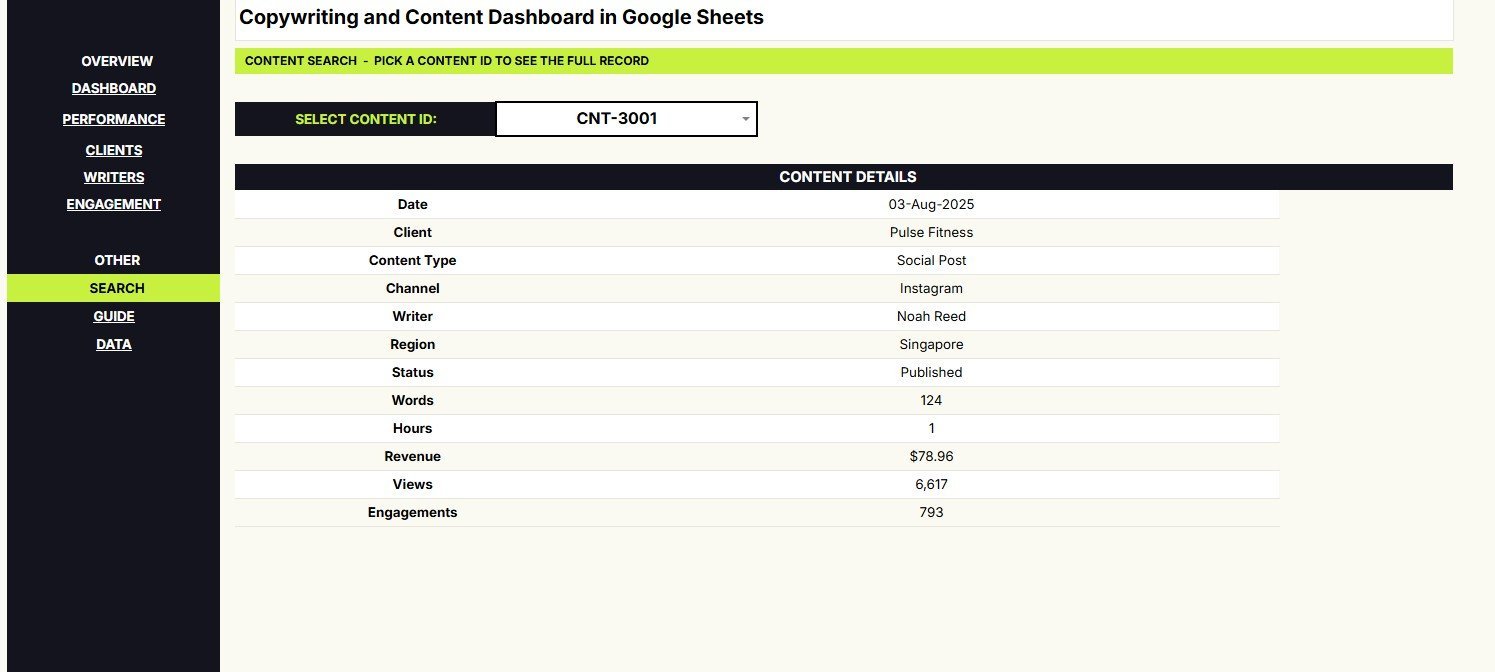
- Content ID lookup: Use the Search Sheet to view one complete content record in a clean format.
- Google Drive friendly: Share the copied workbook with teammates and manage access through standard Google Sheets permissions.
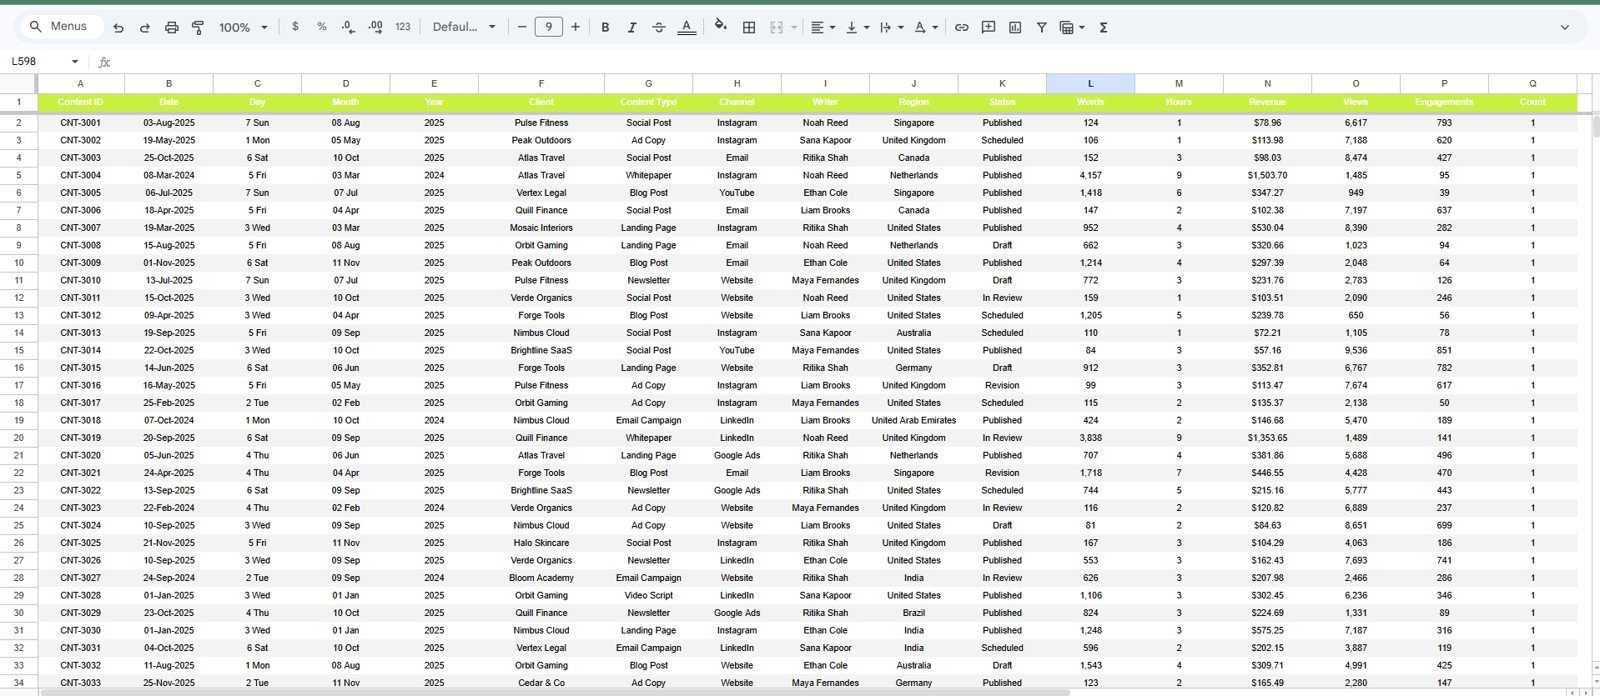
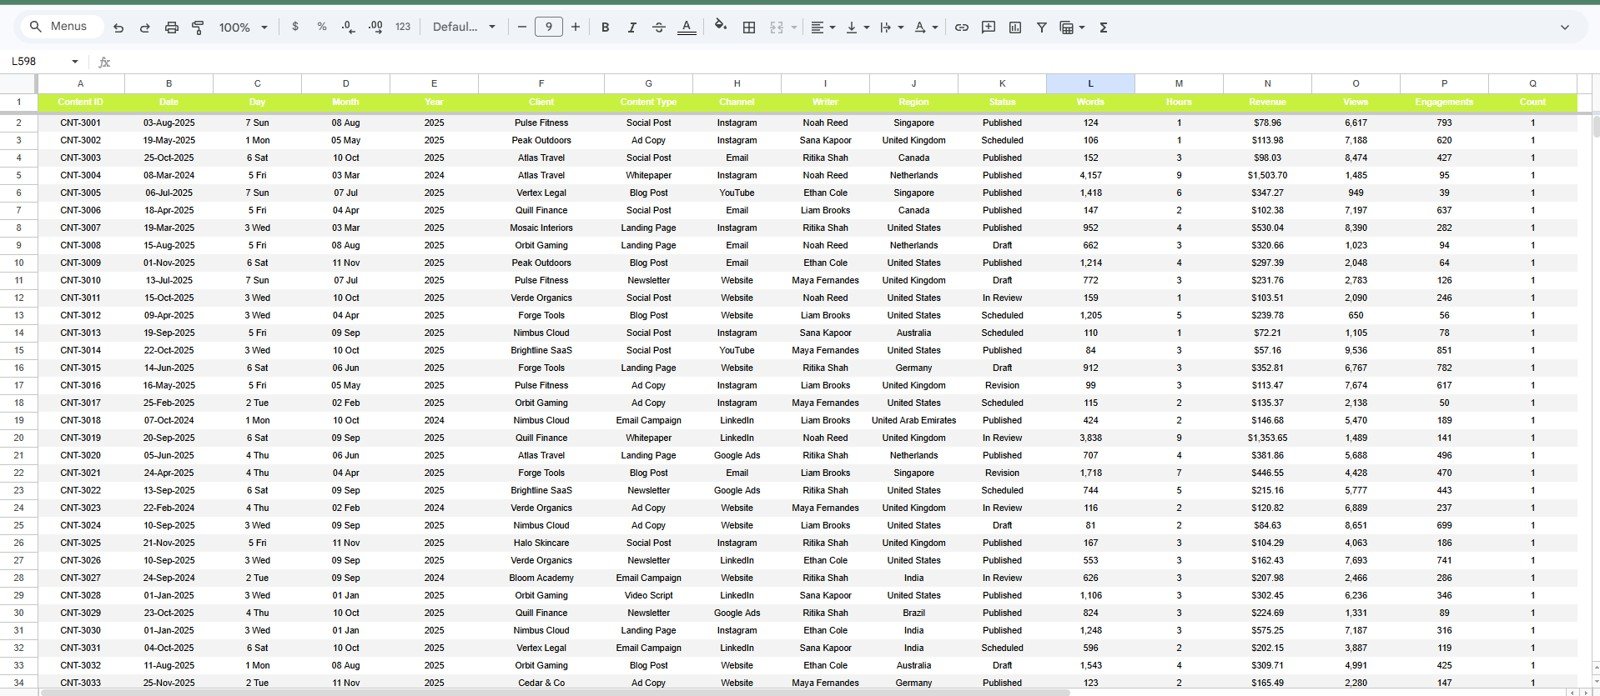
- Editable source data: Replace the sample rows in the Data Sheet and keep the same column structure for clean reporting.
What’s Inside the Copywriting and Content Dashboard in Google Sheets
1. Overview Page
The Overview page gives leaders a high-level view of content output and value. The top cards show Total Revenue, Content Pieces, Total Words, and Total Views, while slicers make it easy to review a filtered segment.
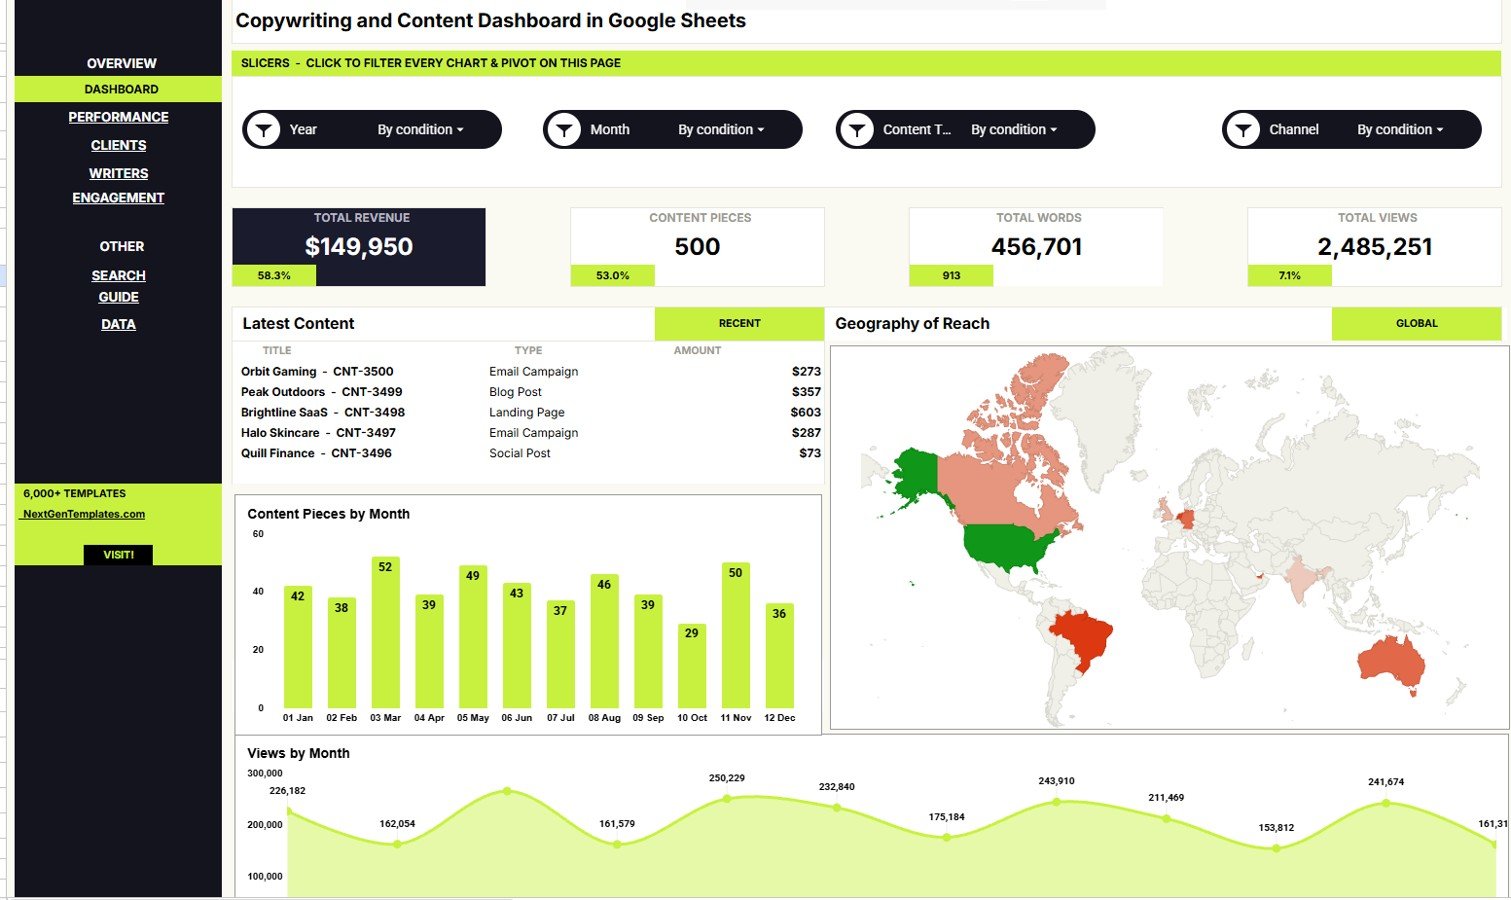
- Recent Content Amount by Title: This chart highlights the most recent content titles by revenue amount. It helps managers see which published items or client deliverables are creating the most immediate value.
- Content Pieces by Month: This chart shows monthly production volume. Use it to spot seasonality, workload spikes, or periods where the team shipped fewer assets.
- Reach by Country: This chart compares audience reach across countries. It helps identify markets where content is getting wider visibility.
- Views by Month: This chart tracks monthly view movement. It helps teams see whether content attention is rising, flat, or slipping over time.
2. Performance Analysis
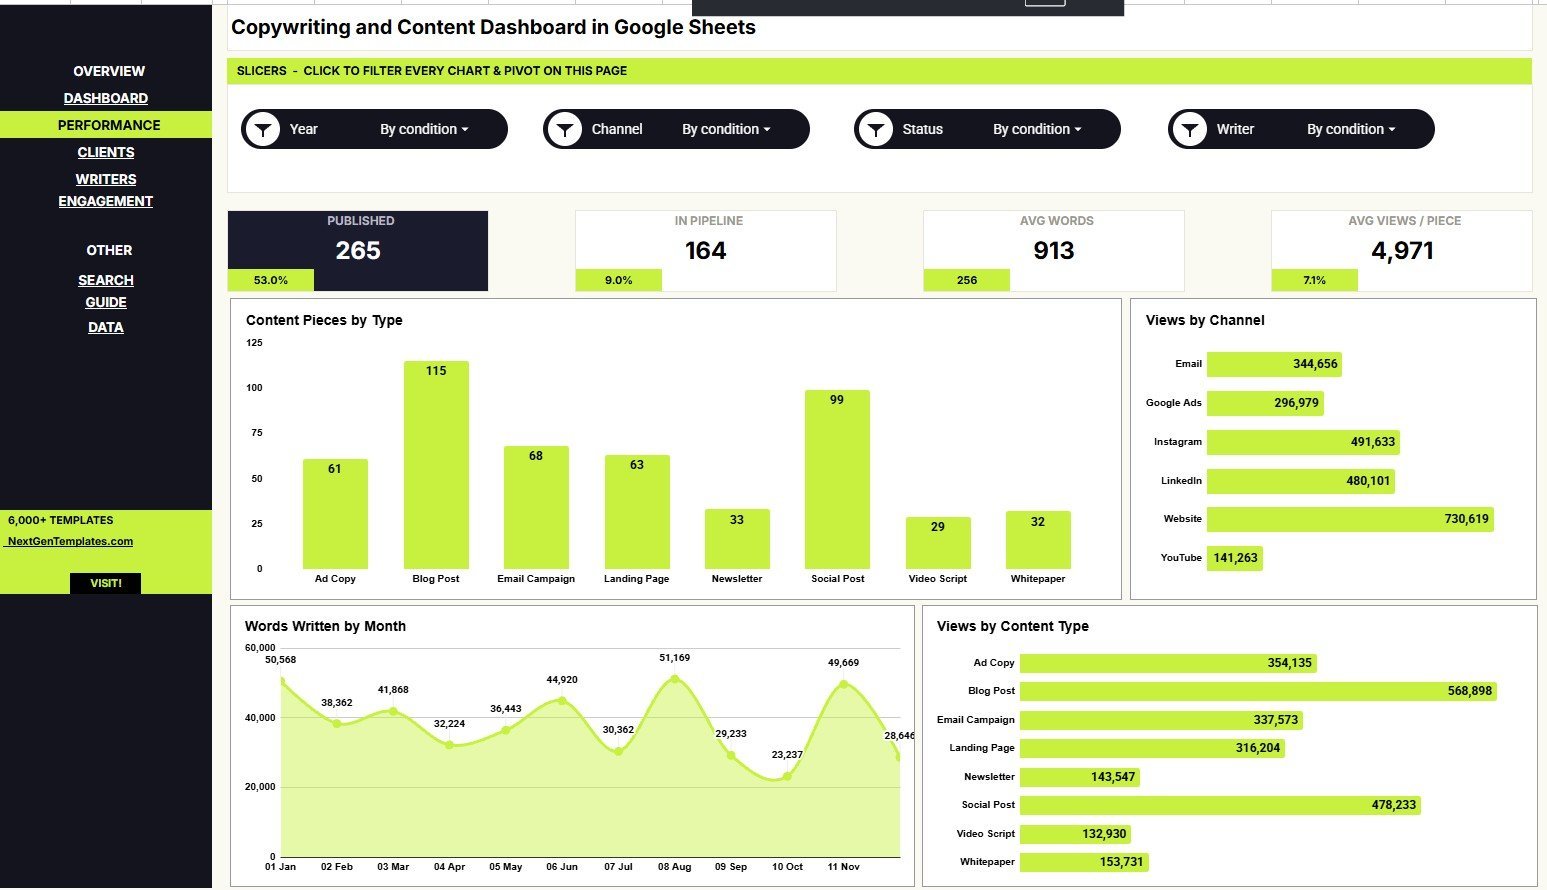
The Performance Analysis tab focuses on production mix, channel performance, and content consumption. It is useful for weekly reviews of what the team created and where the audience responded.
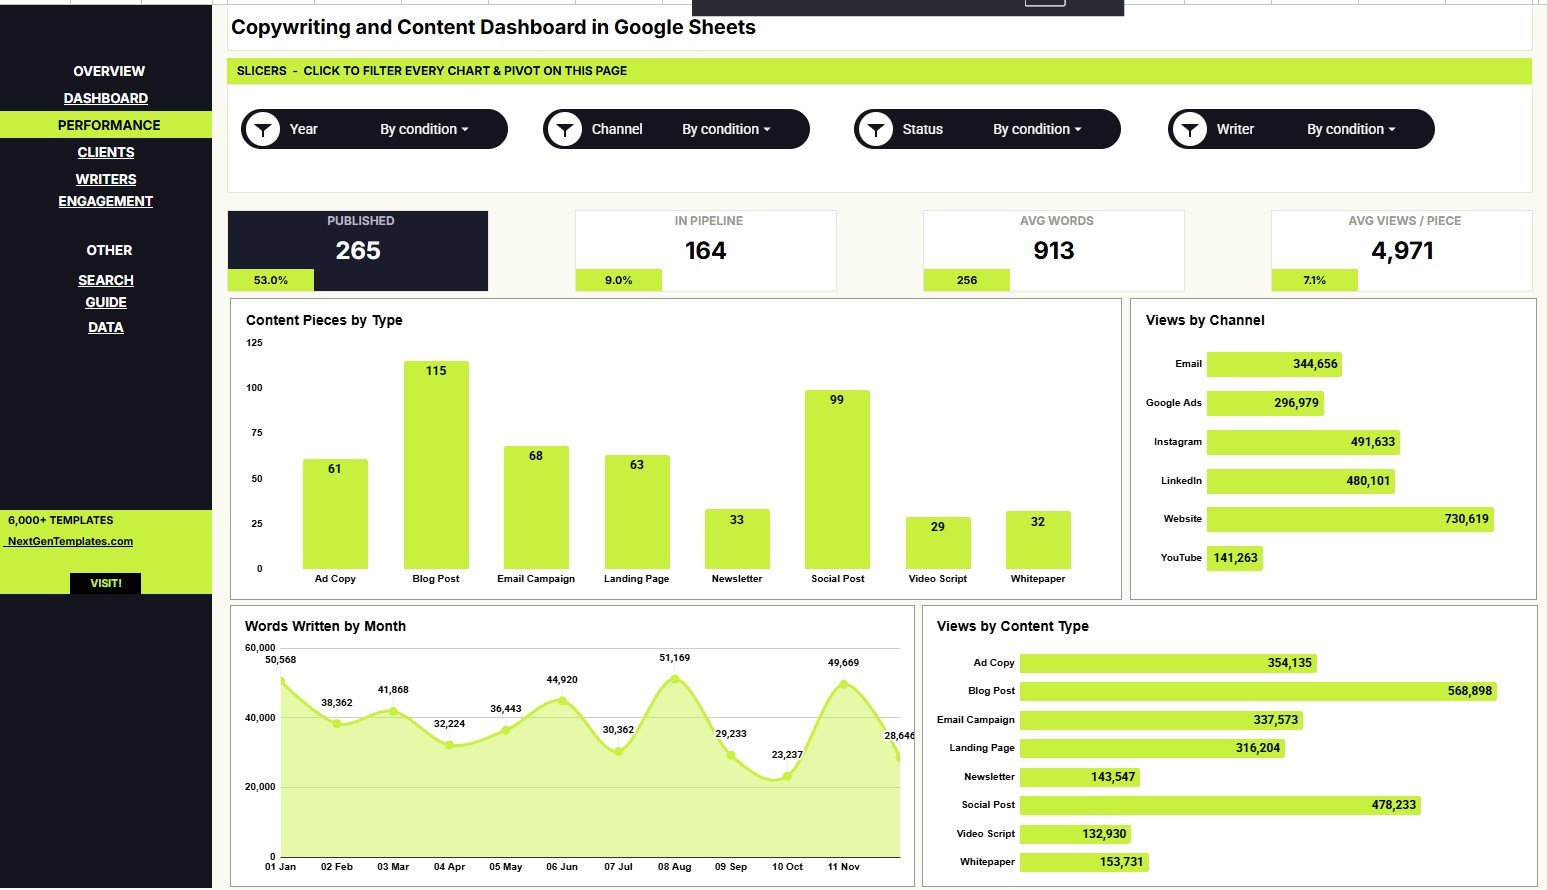
- Content Pieces by Type: This chart shows how many items were created by content type. It helps compare blogs, emails, ads, landing pages, social posts, or other formats.
- Views by Channel: This chart breaks views by publishing or marketing channel. It helps teams decide where content distribution is getting the best attention.
- Words Written by Month: This chart tracks total writing output month by month. It helps review workload and content production capacity.
- Views by Content Type: This chart compares audience views across content formats. It helps identify formats that deserve more planning time or promotion.
3. Clients Analysis
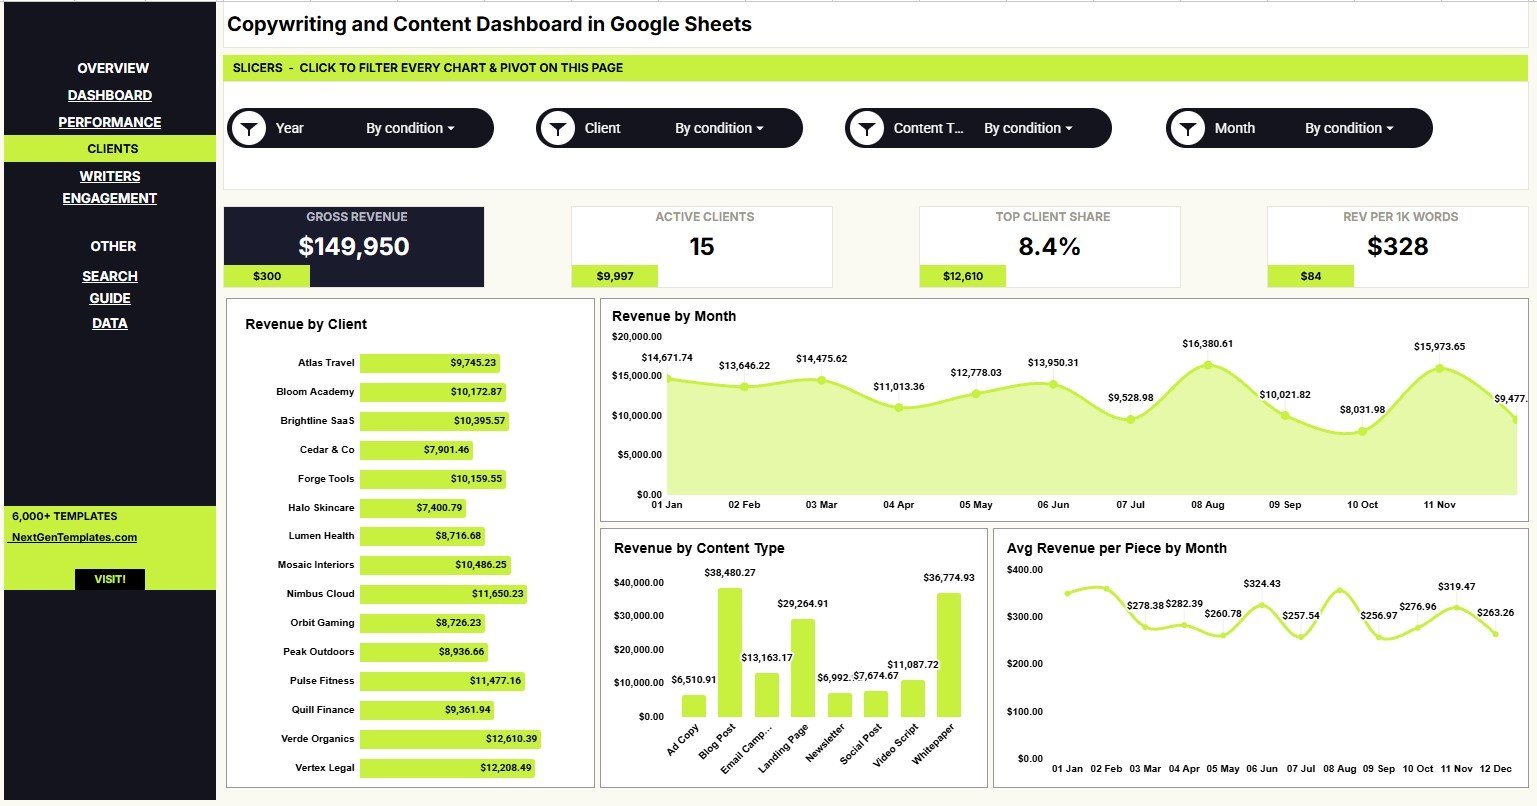
The Clients Analysis tab connects content work to client revenue and monthly value. Agencies, freelancers, and marketing service teams can use it to review account contribution.
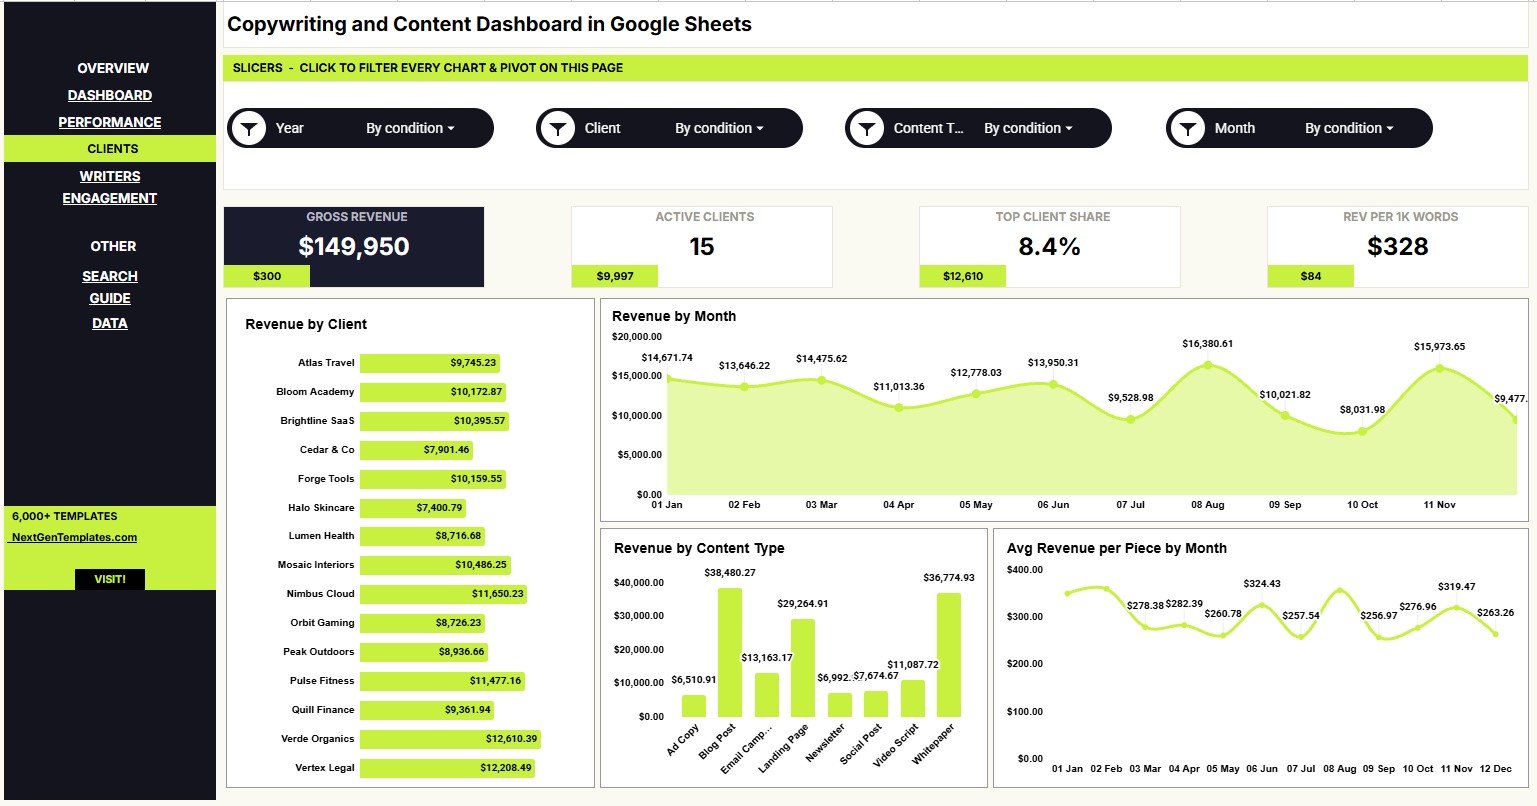
- Revenue by Client: This chart ranks clients by total revenue. It helps account owners understand which clients are driving the largest share of content income.
- Revenue by Month: This chart shows how client revenue changes over time. It supports monthly review meetings and helps identify slow or strong periods.
- Revenue by Content Type: This chart compares revenue across deliverable types. It helps reveal whether blogs, landing pages, email copy, or other content formats are most valuable.
- Average Revenue per Piece by Month: This chart tracks average value per content item. It helps distinguish higher volume months from genuinely higher value months.
4. Writers Analysis
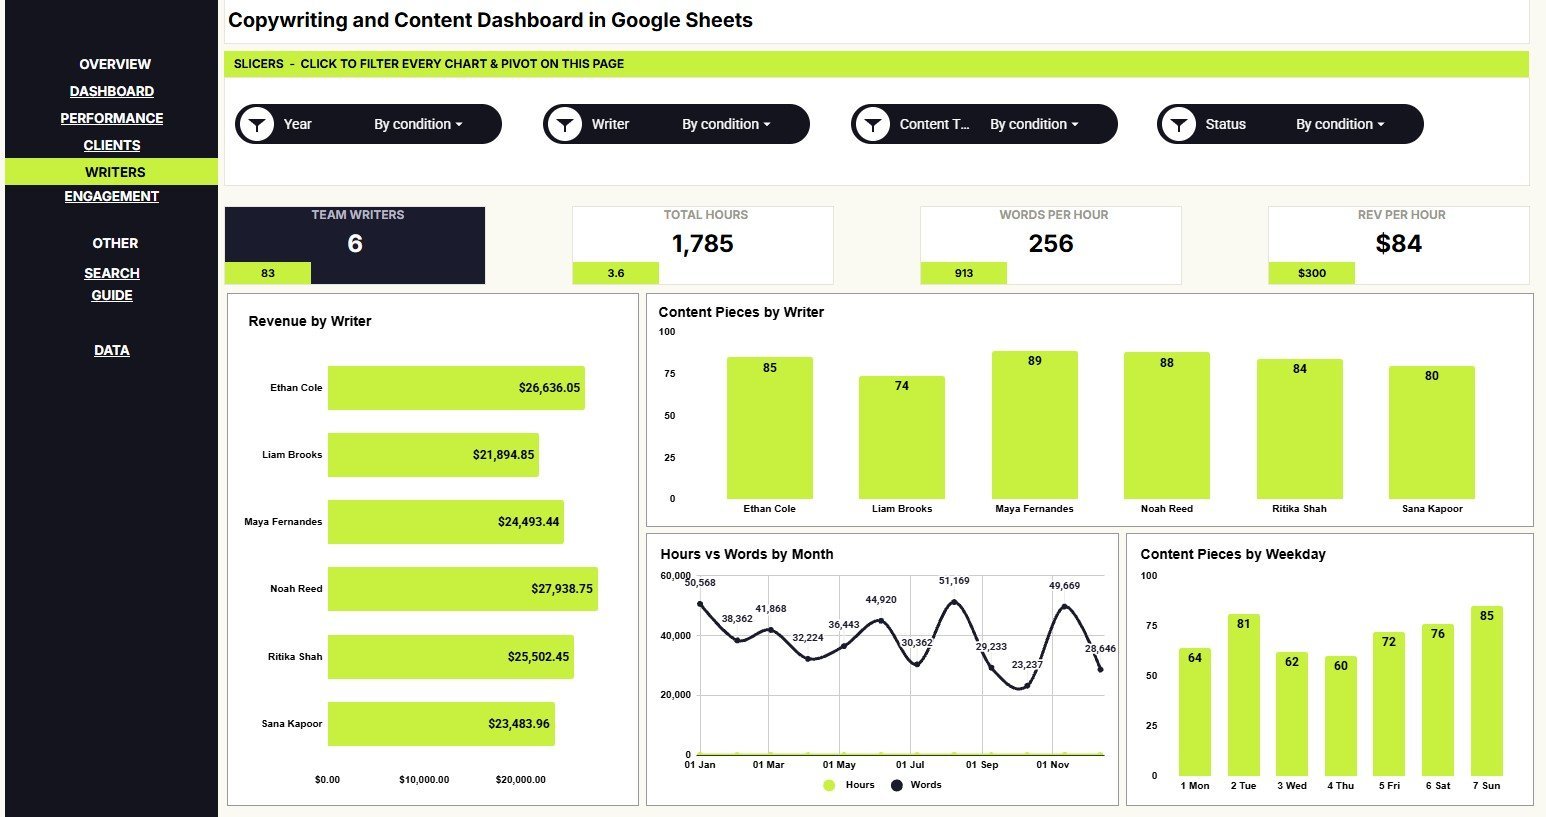
The Writers Analysis tab reviews individual contribution, output, hours, and weekday patterns. It is helpful for team leads who need to balance work fairly while still tracking business results.
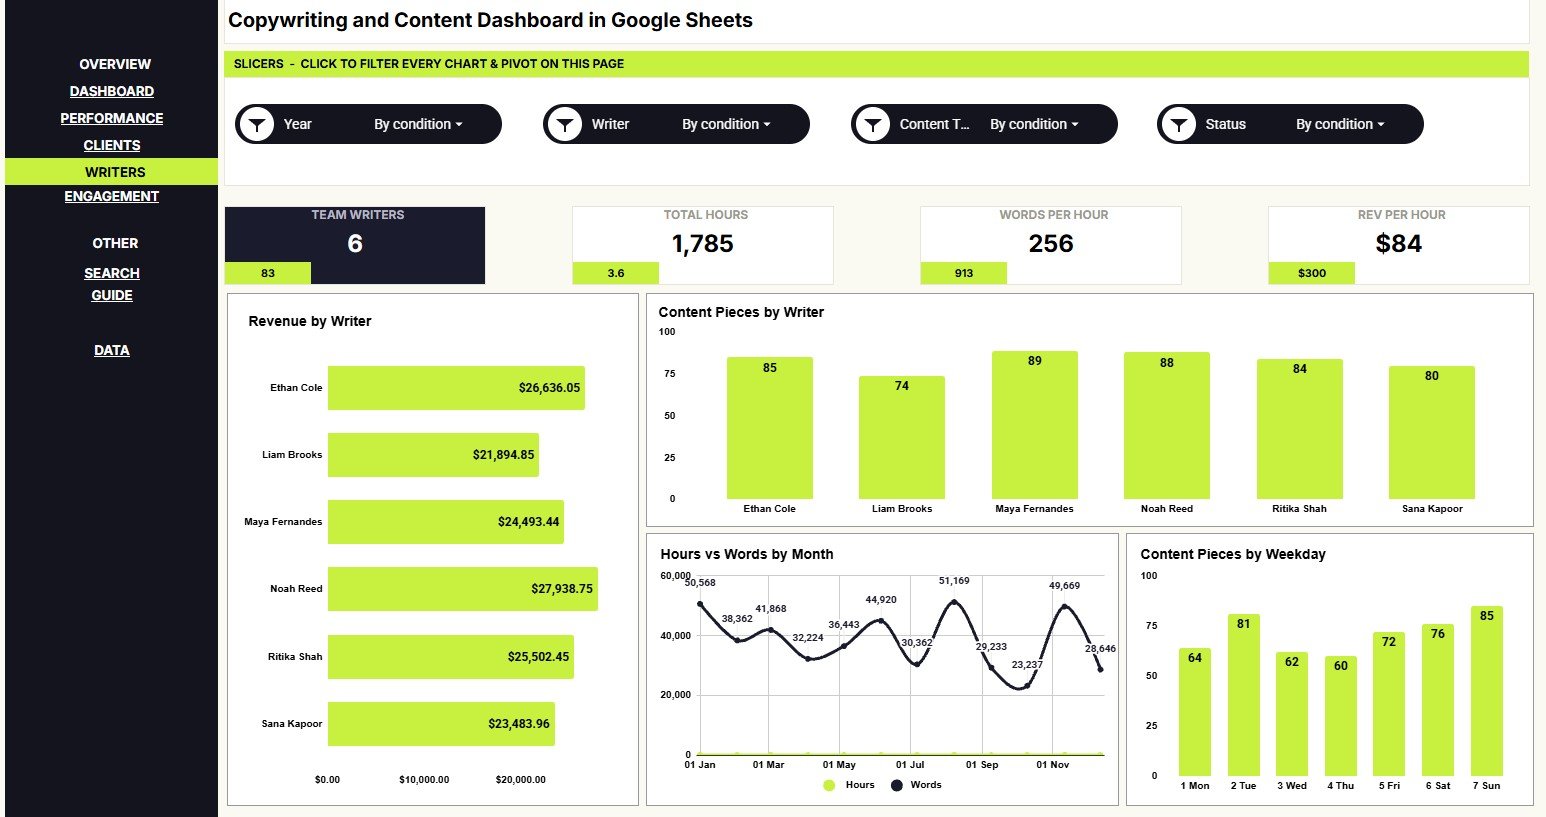
- Revenue by Writer: This chart compares the revenue connected to each writer. It helps managers review contribution while considering client mix and assignment type.
- Content Pieces by Writer: This chart counts produced items by writer. It helps monitor workload distribution and spot over-assignment early.
- Hours and Words by Month: This chart places time investment beside word output. It helps review productivity and the effort needed for different content periods.
- Content Pieces by Weekday: This chart shows production by weekday. It helps teams understand when work is usually completed and where scheduling may need adjustment.
5. Engagement Analysis
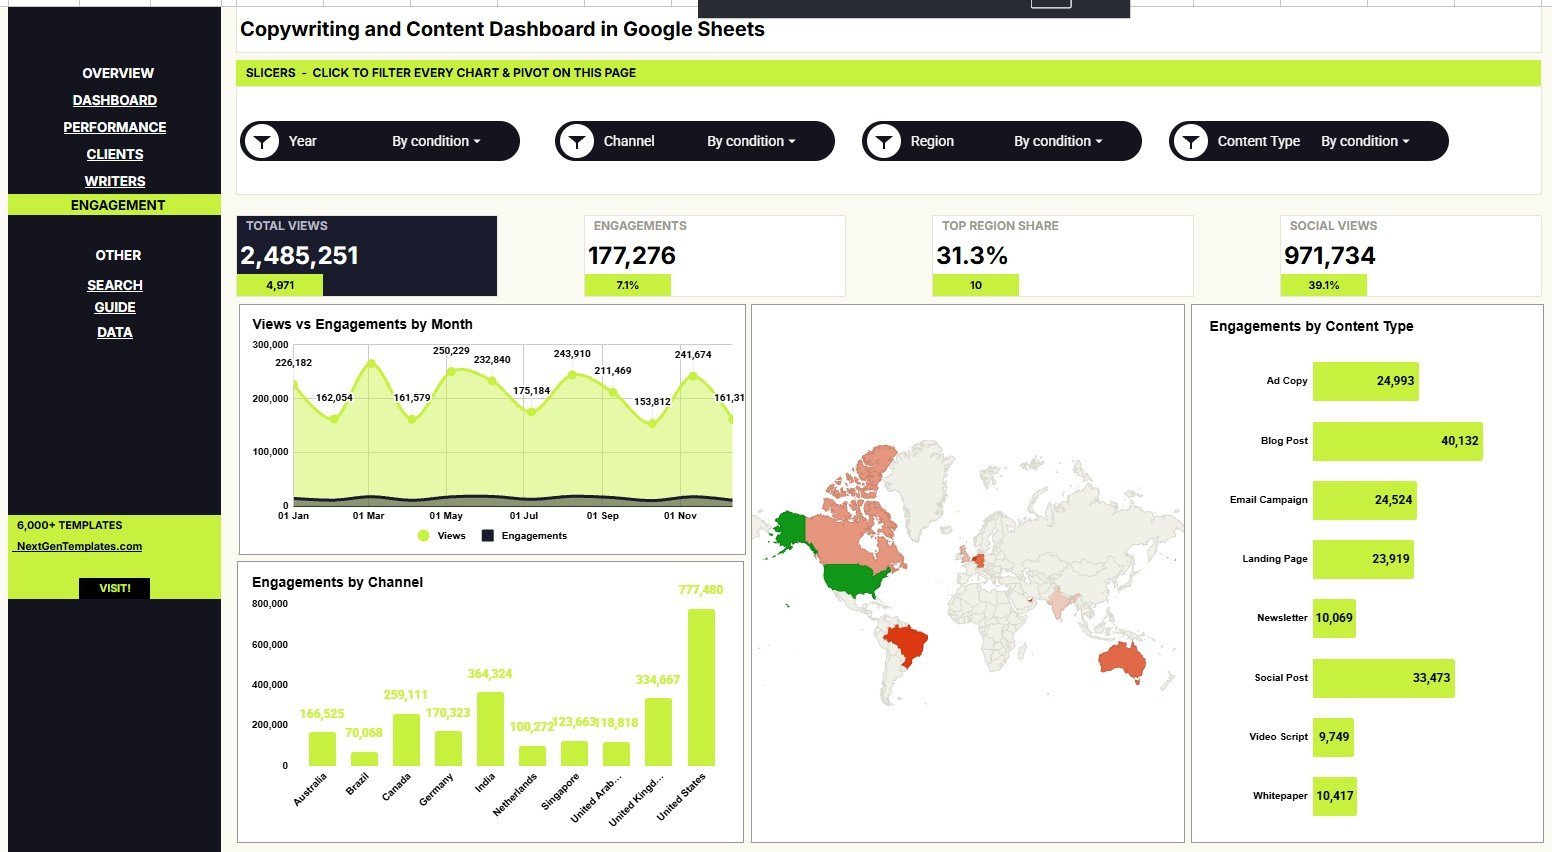
The Engagement Analysis tab focuses on views, engagements, reach, regions, channels, and content type. It helps connect content production with audience response.
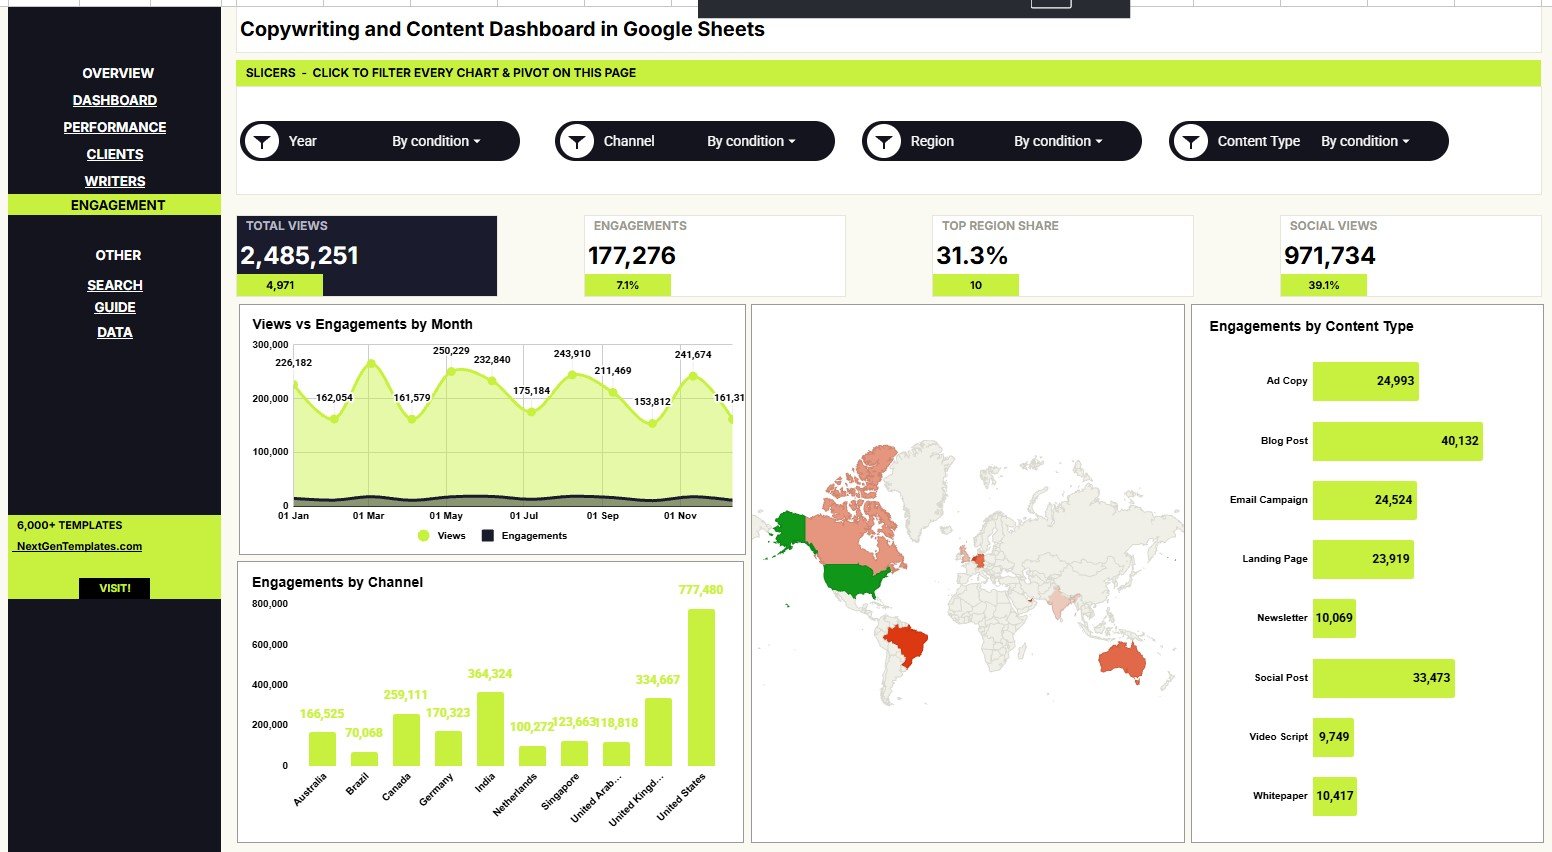
- Views and Engagements by Month: This chart compares attention and interaction over time. It helps users see whether views are turning into meaningful engagement.
- Engagements by Channel: This chart breaks engagement by distribution channel. It helps decide where content should be promoted more often.
- Reach by Region: This chart compares regional reach. It helps teams understand which territories are responding to the content plan.
- Engagements by Content Type: This chart compares interaction across content formats. It helps identify formats that spark stronger audience action.
6. Search Sheet
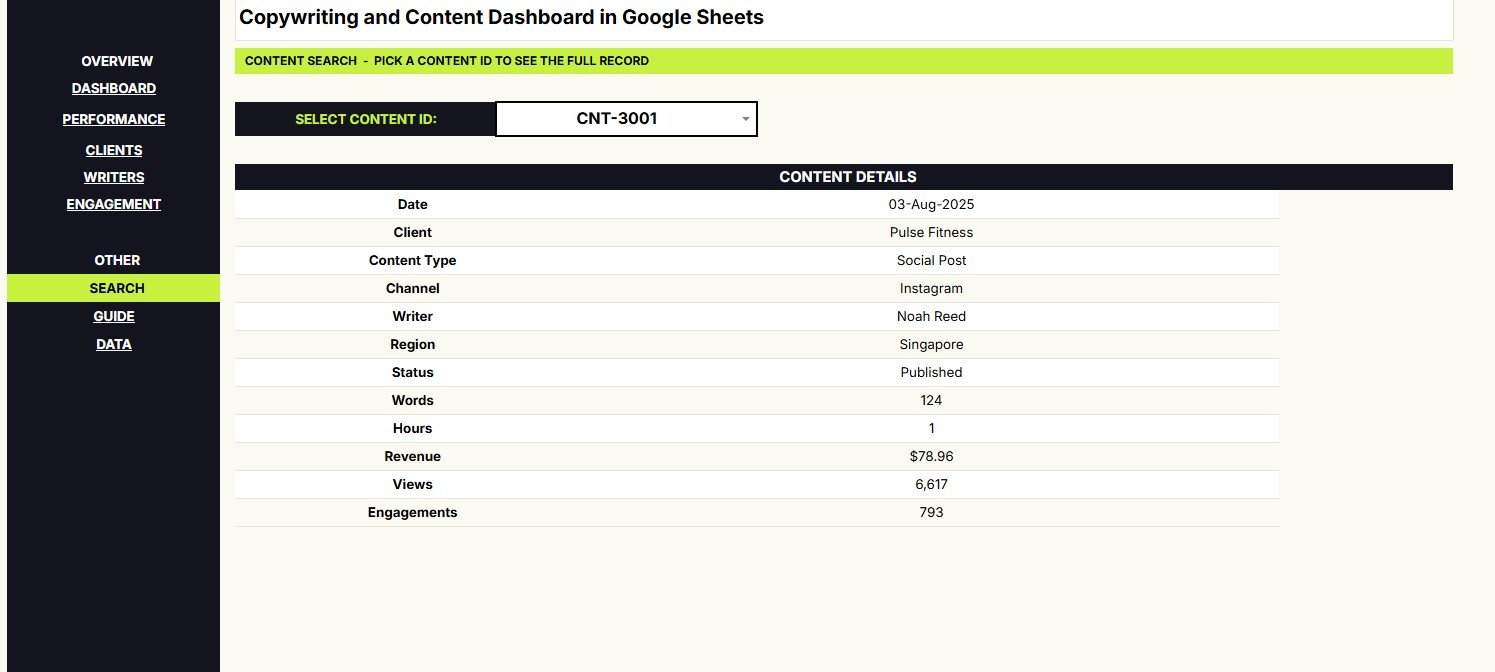
The Search Sheet lets users select a Content ID and instantly view the full record for that item. Visible fields include Date, Client, Content Type, Channel, Writer, Region, Status, Words, Hours, Revenue, Views, and Engagements.
7. Data Sheet Tab
The Data Sheet is where you add content records in the same format used by the dashboard. Keeping client names, channels, regions, writers, statuses, and content types consistent will keep charts and slicers clean.
Copywriting and Content Dashboard in Google Sheets vs. Microsoft Excel Dashboard vs. Paid Marketing SaaS – Where This Fits
| Feature | This Google Sheets template | Microsoft Excel dashboard | Paid marketing SaaS |
|---|---|---|---|
| Cost | $9.99 sale price | Template cost plus Excel access | Monthly or annual subscription |
| Platform | Browser-based Google Sheets | Desktop or web Excel | Vendor-hosted app |
| Setup time | Copy the file and replace sample rows | Download workbook and adapt data | Account setup, roles, imports, and onboarding |
| Real-time team collaboration | Native Google Sheets sharing | Available with cloud storage | Usually included by seat |
| Mobile access | Google Sheets app or browser | Excel app or browser | Usually available |
| Customizable fields | Editable rows, labels, formulas, and charts | Editable workbook | Limited by plan settings |
| Share with link | Yes, through Google Drive permissions | Yes, with OneDrive or SharePoint | Often invite-based |
| Year-1 cost at 5 users | $9.99 template price, excluding Google account costs | Depends on Microsoft licensing | Often hundreds or thousands per year |
| Content ID lookup | Included Search Sheet | Possible with formulas | Usually tied to platform records |
Who This Template Is For – and Who It’s Not For
Best for: content agencies, freelance copywriters, editorial teams, SEO teams, social media managers, marketing consultants, and small businesses that track content manually or from exports.
Not the right fit for: teams needing automatic API imports, built-in approval workflows, task dependencies, invoicing, AI writing tools, or enterprise access controls. This template analyzes the data you enter; it is not a full content management platform.
How to Use the Copywriting and Content Dashboard in Google Sheets
- Open the PDF guide from your download and use the Google Sheets copy link.
- Create your own editable copy in Google Drive.
- Go to the Data Sheet and replace the sample records while preserving the column structure.
- Use consistent values for client, writer, channel, region, country, status, and content type.
- Review the Overview page first, then use the analysis tabs for deeper review.
- Select a Content ID on the Search Sheet when you need one complete record.
Real-World Use Cases
Maya, agency account manager: Maya filters by client before a monthly reporting call and uses Revenue by Content Type to explain which deliverables generated the most value.
Arjun, content operations lead: Arjun reviews Hours and Words by Month, then balances assignments after seeing one writer carrying too many pieces in the Writers Analysis tab.
Priya, freelance copywriter: Priya uses the Search Sheet to retrieve one Content ID during client conversations and checks Average Revenue per Piece by Month before quoting retainers.
Frequently Asked Questions
What does the Copywriting and Content Dashboard in Google Sheets track?
It tracks revenue, content pieces, words, views, engagements, clients, writers, channels, regions, countries, statuses, hours, dates, and content types.
Does the dashboard include a search feature?
Yes. The Search Sheet lets you choose a Content ID and see the matching record without scrolling through the raw data.
Can I use this with a team?
Yes. Because it runs in Google Sheets, you can share the copied workbook with viewers or editors through Google Drive permissions.
Does it import data automatically?
No. You enter or paste data into the Data Sheet. Teams with exports from other tools can prepare the export and paste it into the same structure.
Can I customize the template?
Yes. The workbook is editable, but keep formulas, slicer ranges, chart ranges, and column headers aligned when making structural changes.
Is this a one-time purchase?
Yes. The template is sold as a one-time purchase on NextGenTemplates, with no monthly dashboard subscription required.
About the Author
Built by PK – Microsoft Certified Professional with 15+ years of Excel, Google Sheets, and Power BI experience. Founder of NextGenTemplates, reaching 300K+ subscribers across YouTube channels. Every template is hand-built and tested before release.
Explore Related Templates
- Content Marketing KPI Dashboard in Google Sheets
- Content Creator Revenue Dashboard in Google Sheets
- YouTube Channel Analytics Dashboard in Google Sheets
- Social Media Performance Dashboard in Google Sheets
- Browse more Google Sheets dashboard templates and Sales and Marketing Google Sheets templates.
Click here to read the detailed blog post<
Watch the step-by-step video Demo:
Ready to replace scattered content reports? Add the Copywriting and Content Dashboard in Google Sheets to your toolkit and turn content records into repeatable reporting.
Last updated: July 30, 2026.