

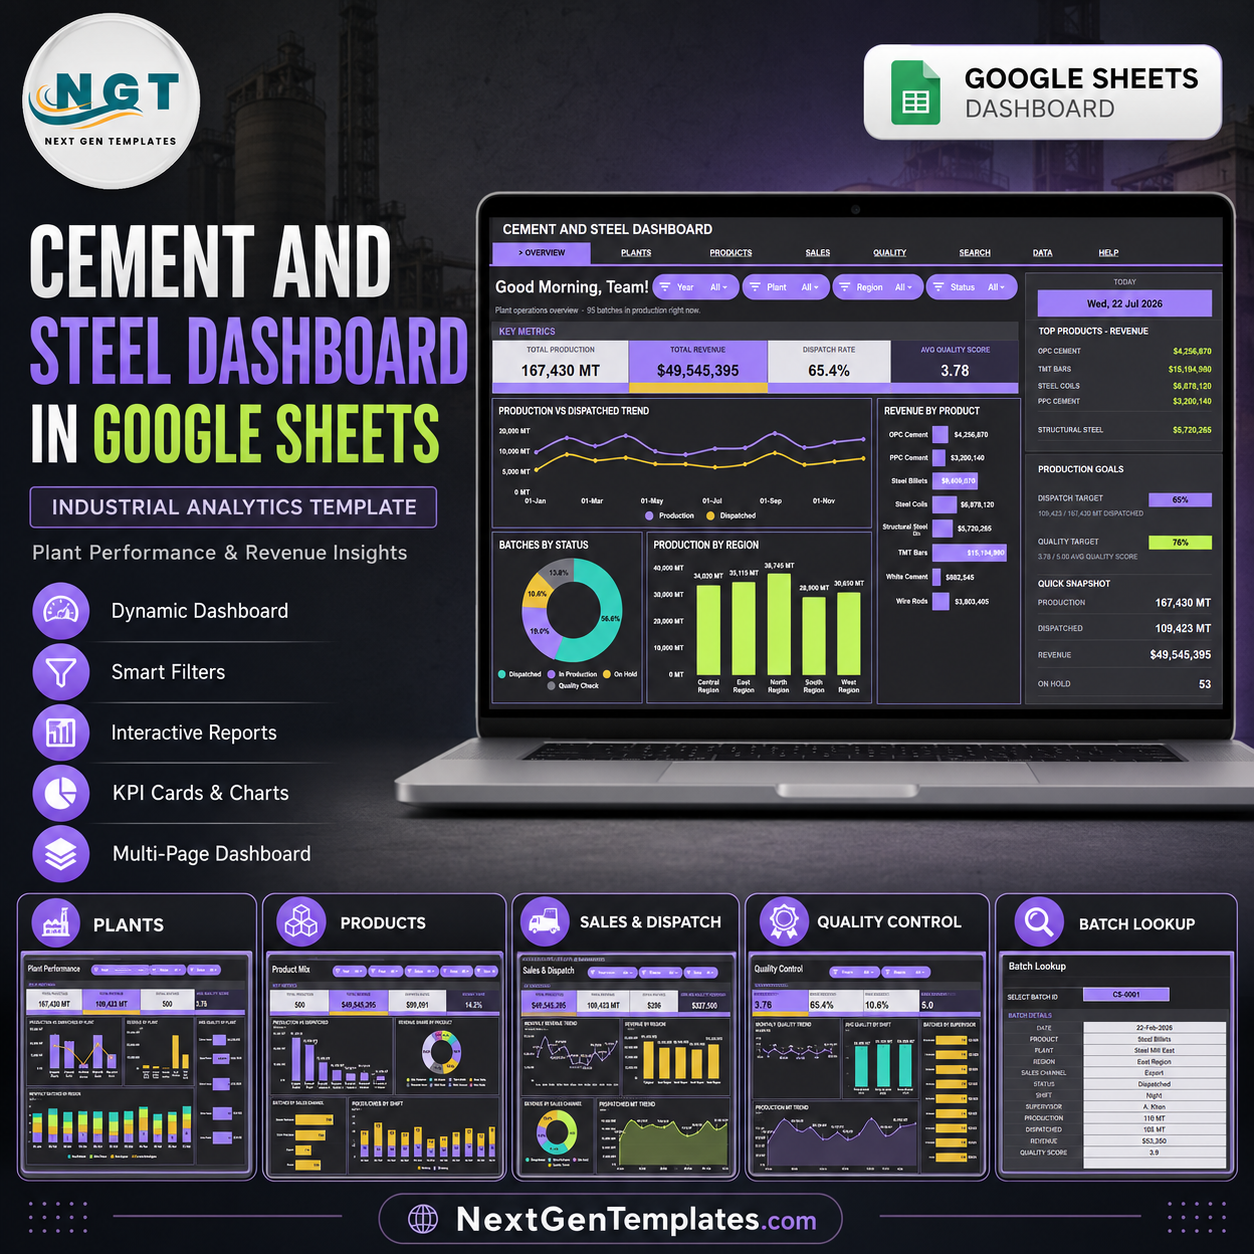

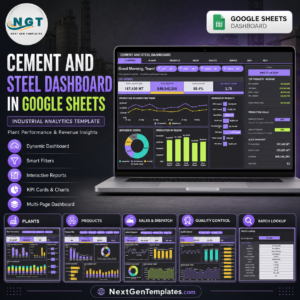
The Cement and Steel Dashboard in Google Sheets gives cement plants, steel distributors, construction-material suppliers, and production analysts a 7-tab reporting system with 4 headline KPI cards, 20 chart views, slicers, a Search sheet, and an editable Data sheet. Replace the sample rows in the same format and review Total Production, Total Revenue, Dispatch Rate, and Avg Quality Score in minutes instead of building a dashboard from zero. Built by PK, a Microsoft Certified Professional with 15+ years of Excel, Google Sheets, and Power BI experience and 300K+ YouTube subscribers. One-time payment, no subscription, no per-user fees, and lifetime access.
Key Features of Cement and Steel Dashboard in Google Sheets
- 4 executive KPI cards show Total Production, Total Revenue, Dispatch Rate, and Avg Quality Score for fast plant and sales review.
- 20 pre-built chart views cover production, dispatch, revenue, batch status, plant performance, product mix, sales channel, shift, supervisor, and quality performance.
- Multiple slicers let users filter the dashboard quickly without editing formulas or rebuilding charts.
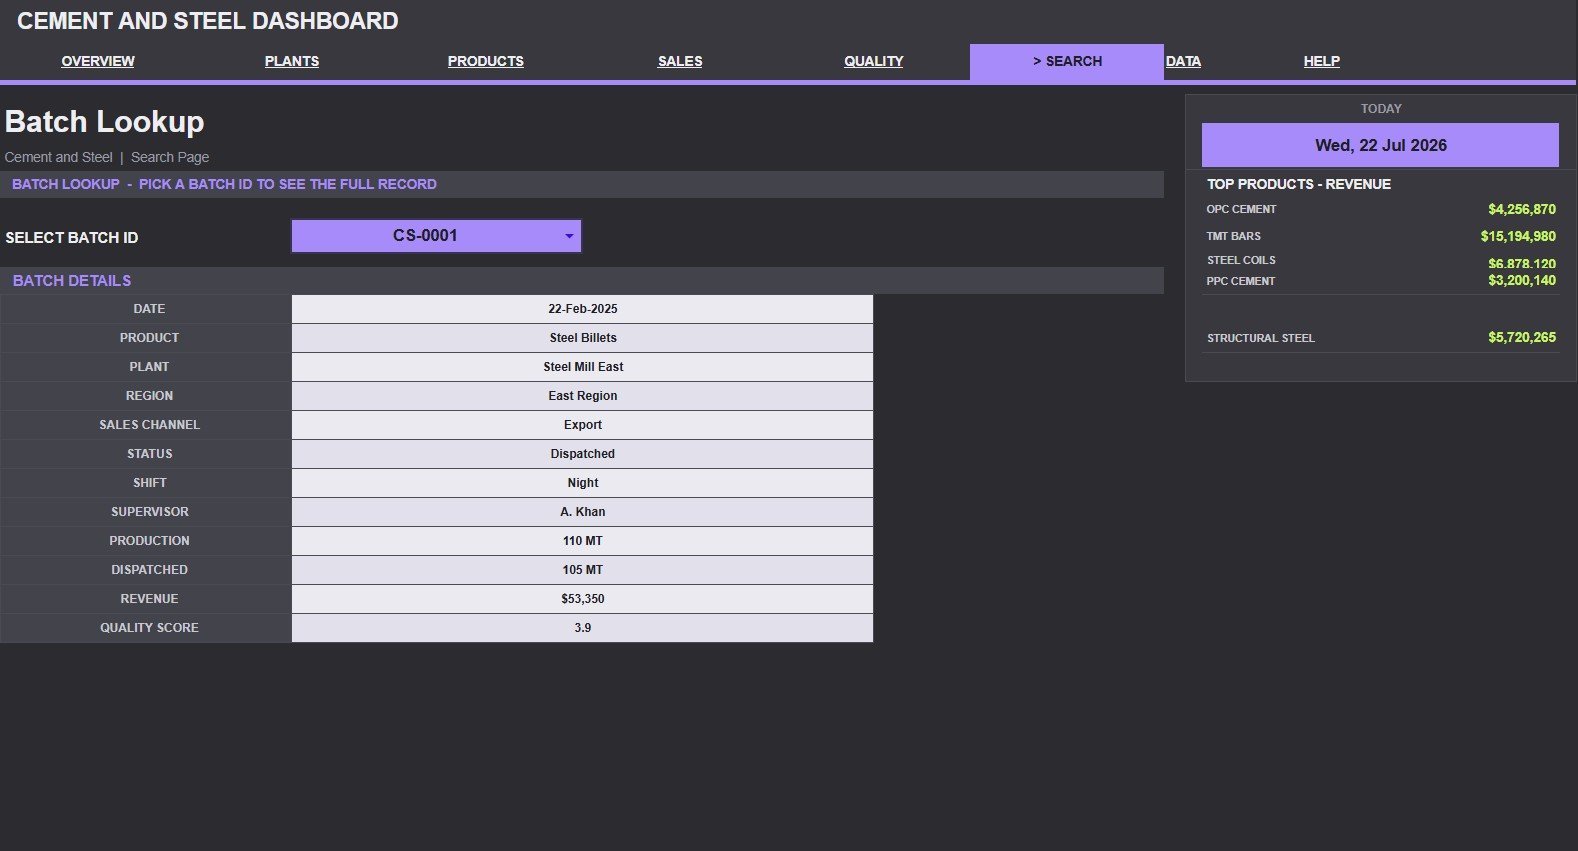
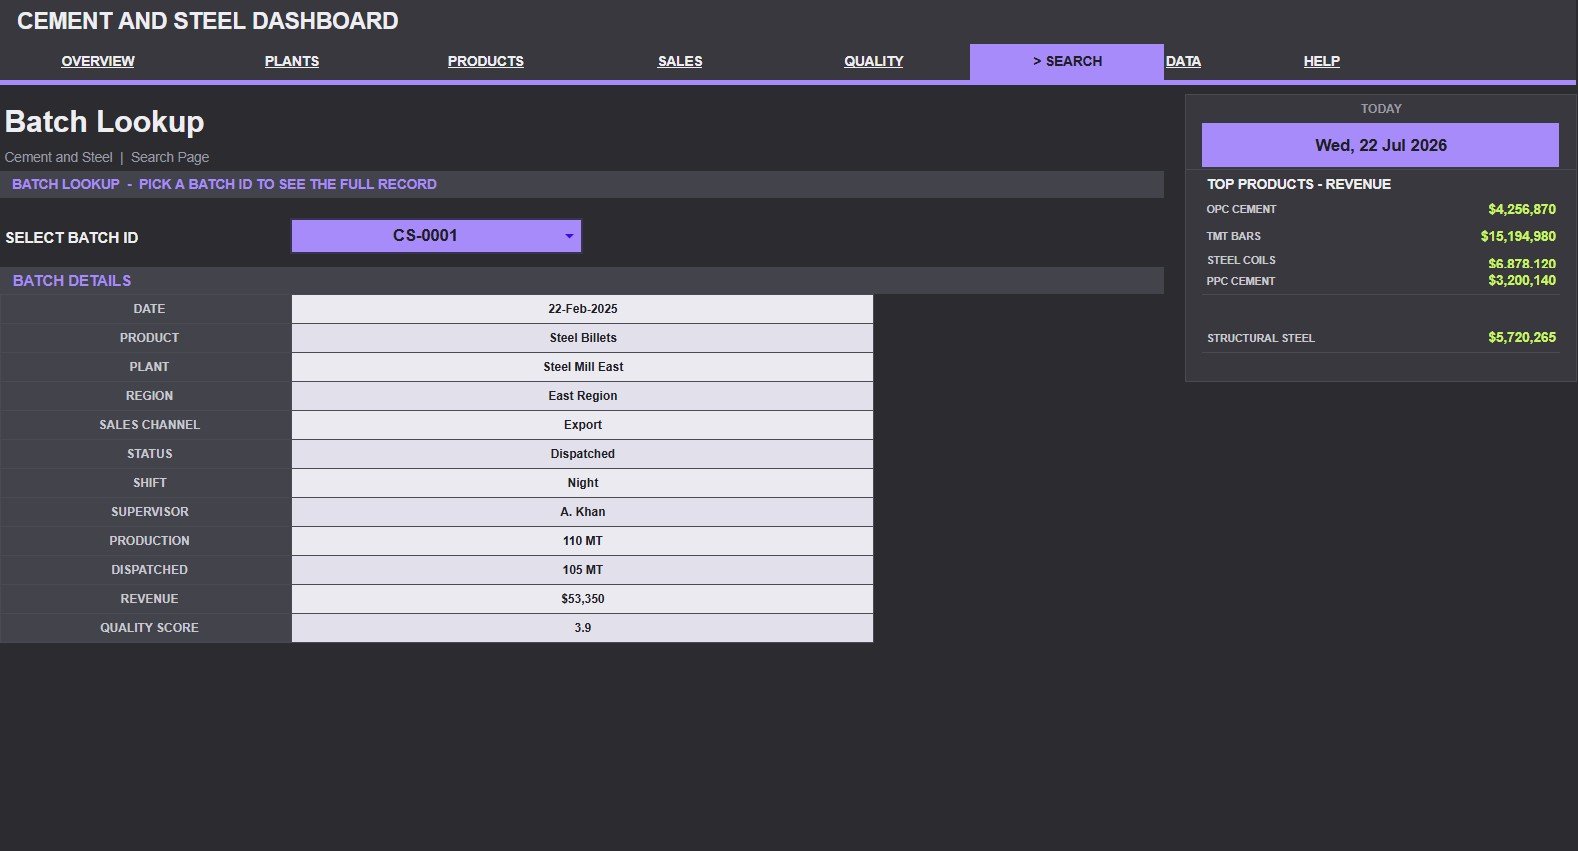
- Search Sheet lookup lets users select a Batch ID and view the complete record in one place.
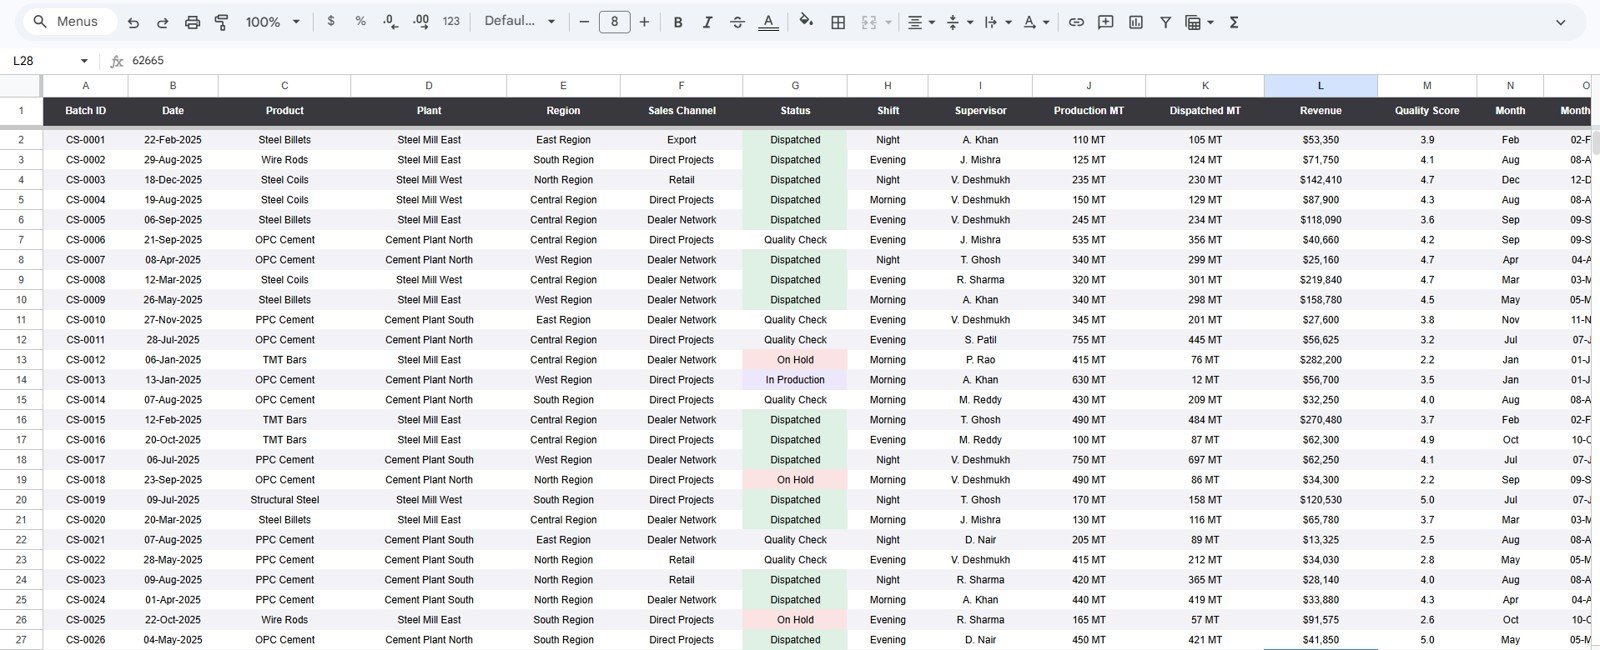
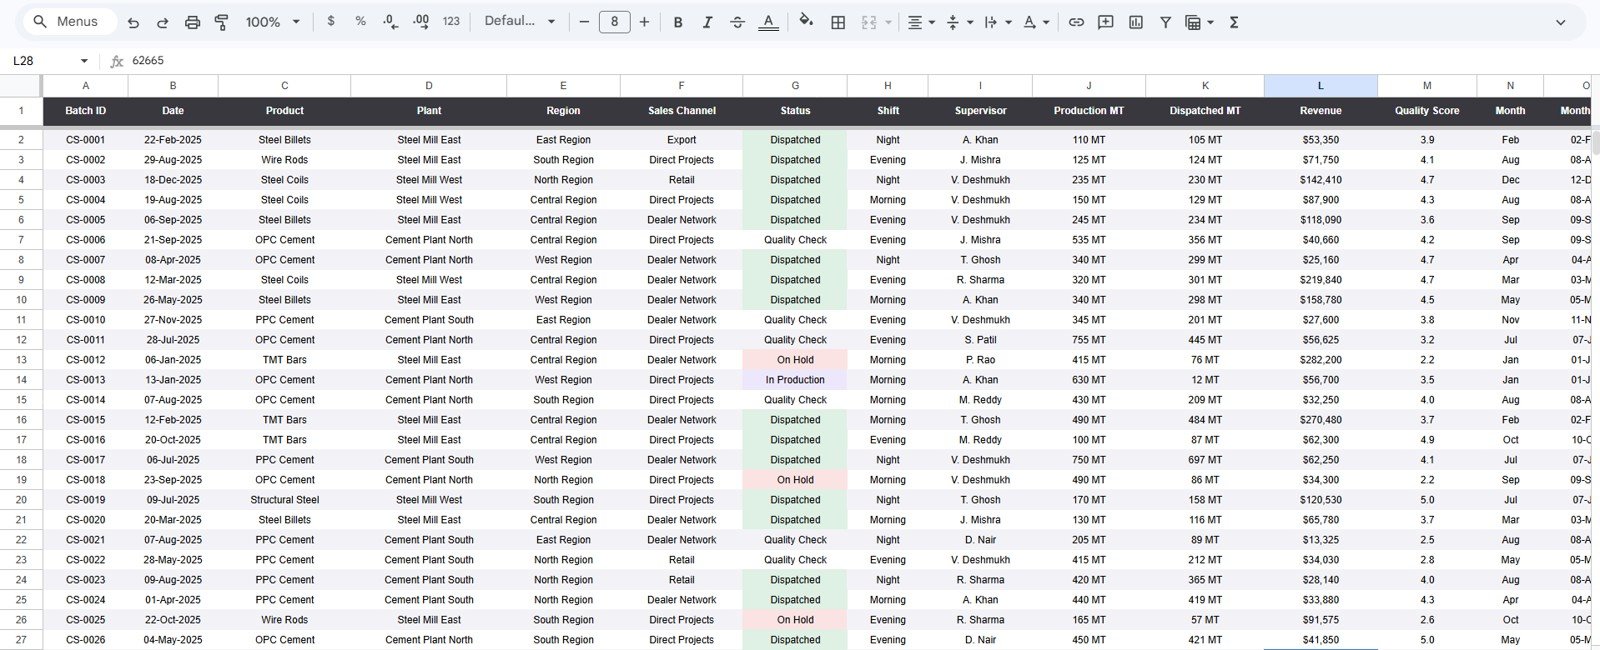
- Structured Data Sheet keeps the input process simple. Add rows in the same format and keep the dashboard current.
- Google Sheets format supports browser access, team sharing, and live collaboration inside Google Drive.
What’s Inside the Cement and Steel Dashboard in Google Sheets
Overview Page
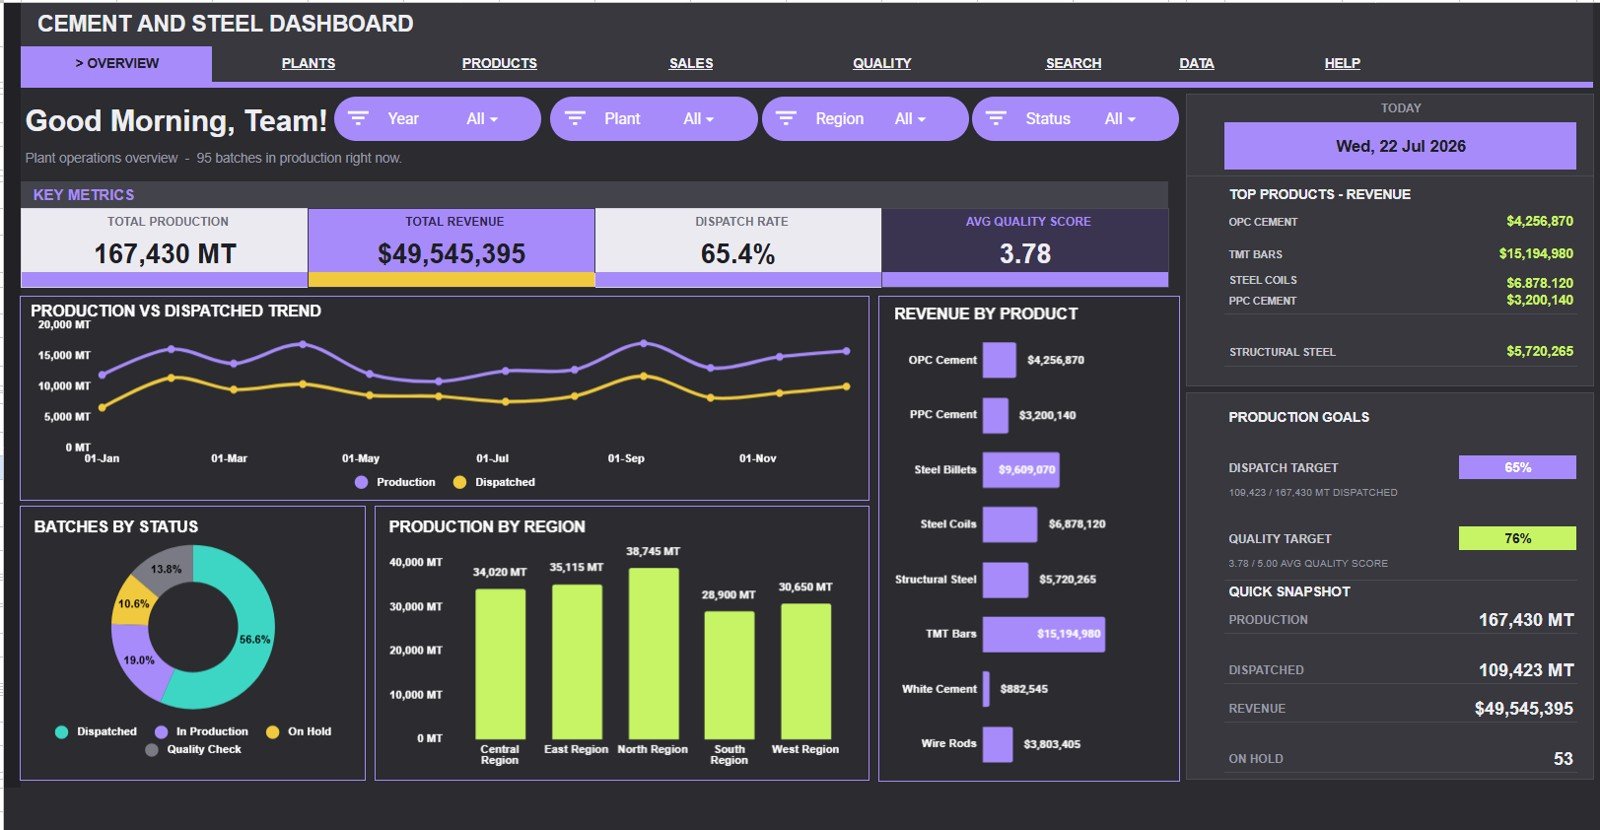
The Overview Page starts with Total Production, Total Revenue, Dispatch Rate, and Avg Quality Score cards. Charts for Production and Dispatched by Month, Revenue by Product, Batches by Status, and Production by Region help management compare monthly output, product revenue, batch flow, and regional contribution.
Plant Performance
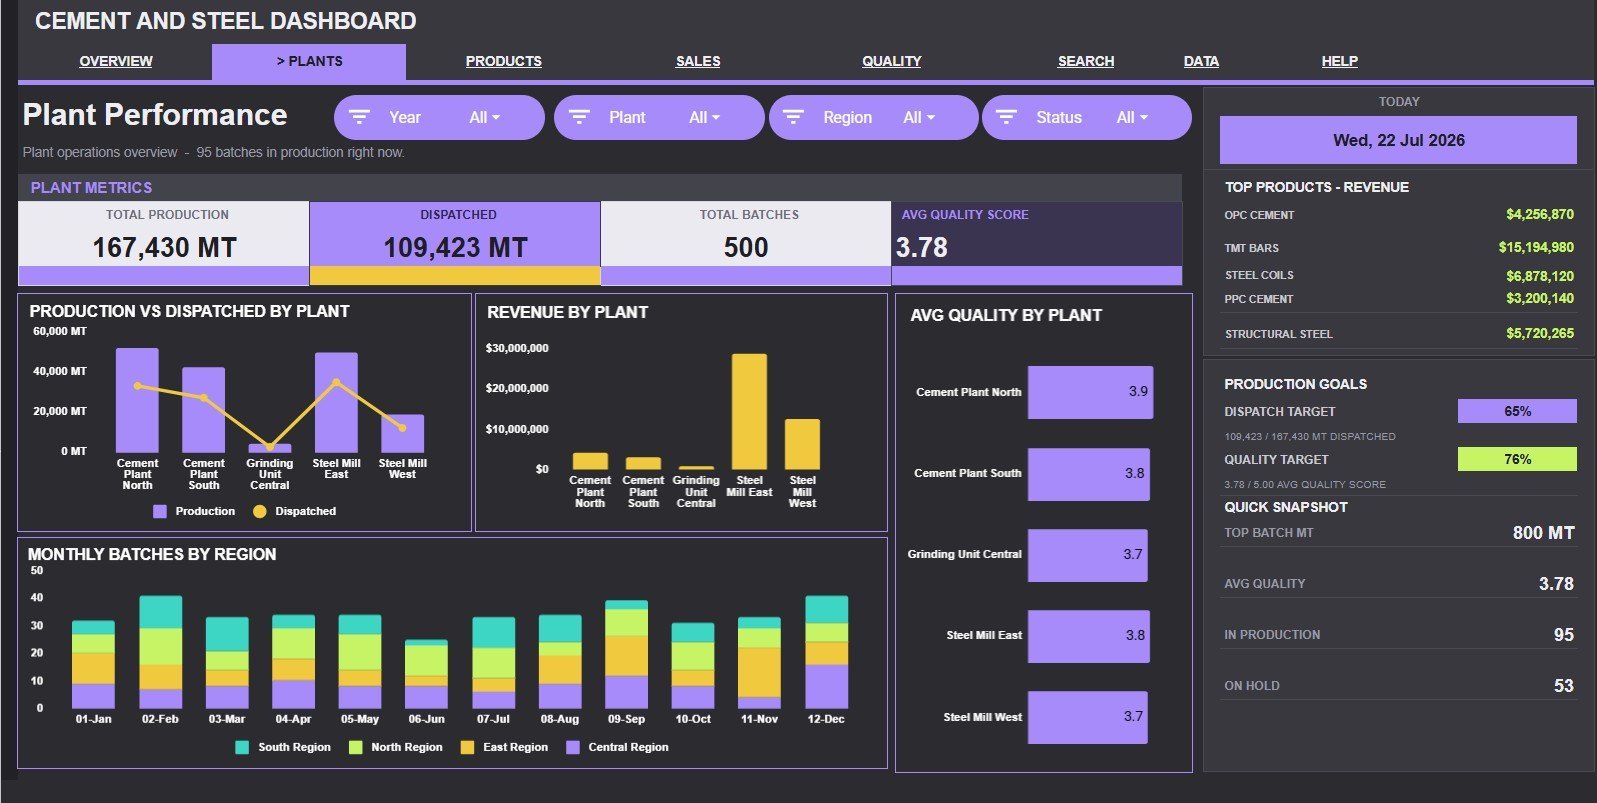
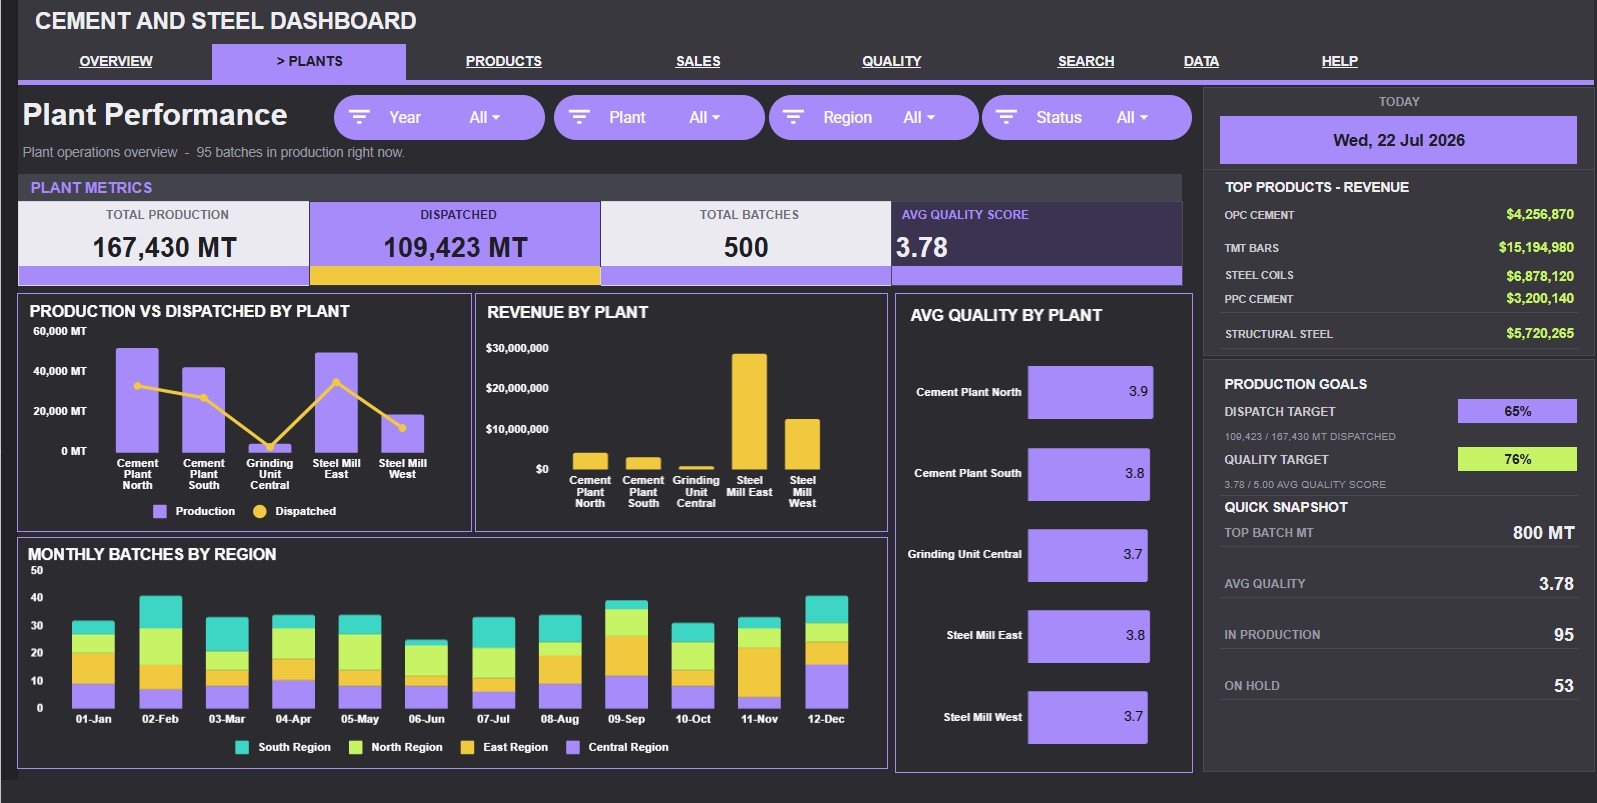
The Plant Performance tab compares Production and Dispatched by Plant, Revenue by Plant, Avg Quality by Plant, and Monthly Batches by Region. This helps plant heads identify which locations are producing, dispatching, and maintaining quality most consistently.
Product Mix
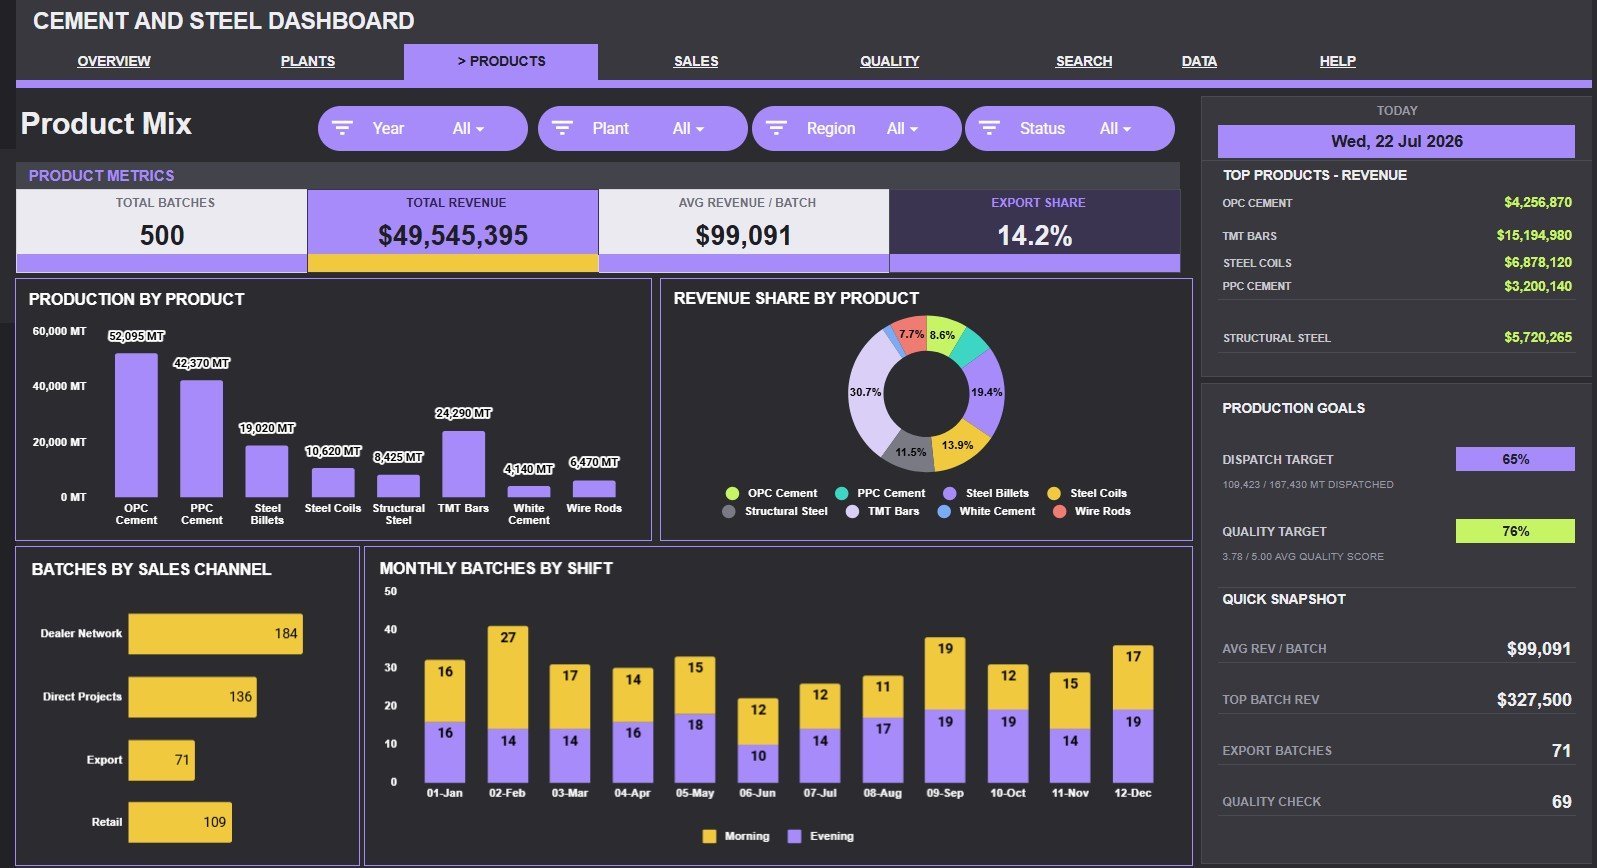
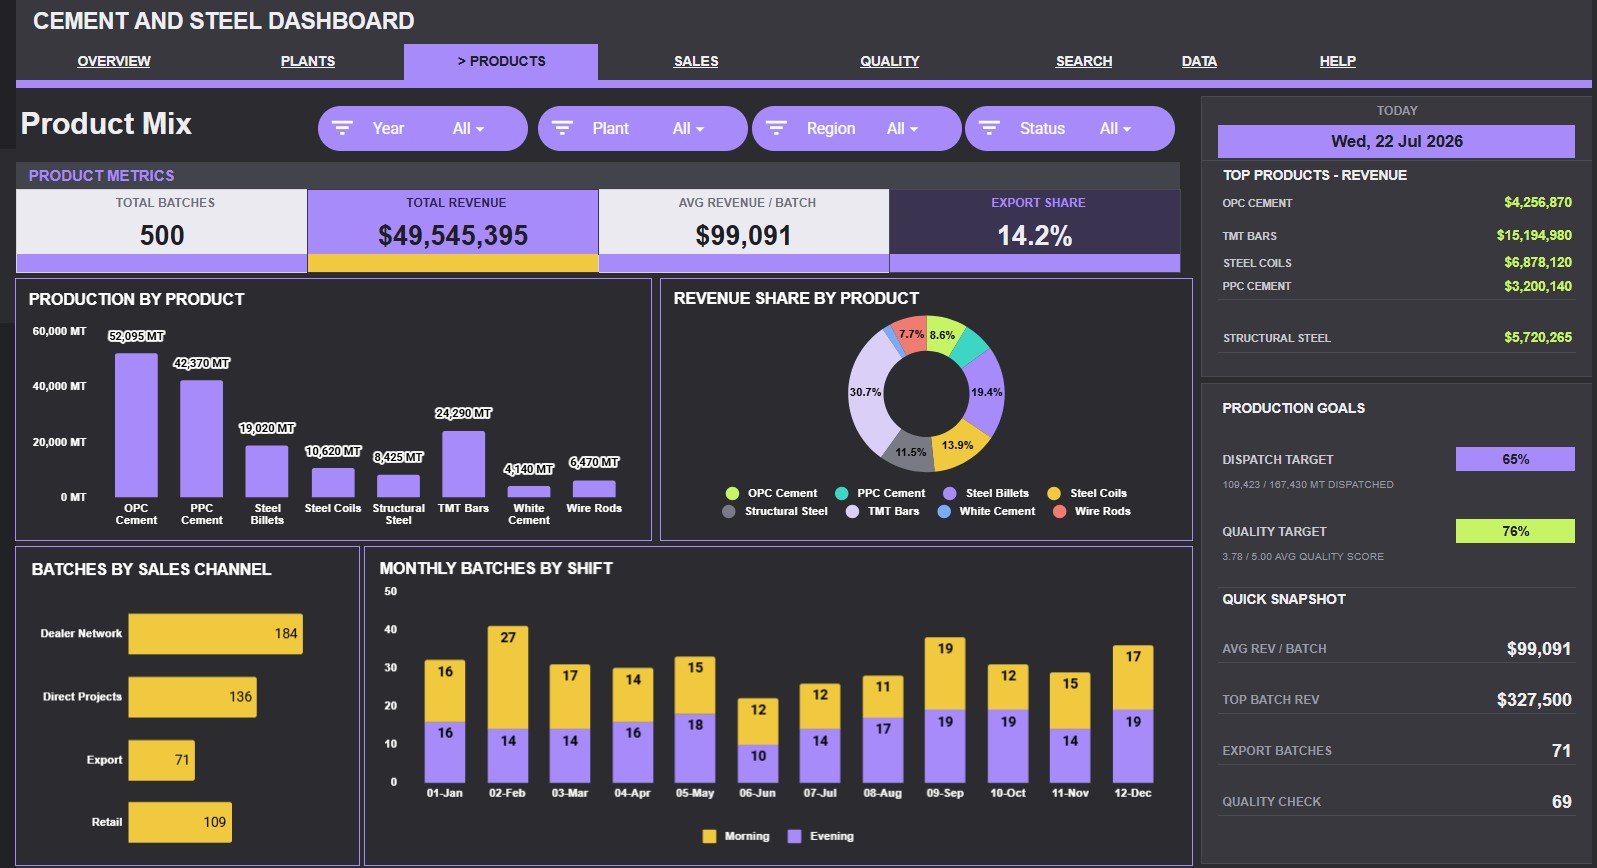
The Product Mix tab tracks Production by Product, Revenue Share by Product, Batches by Sales Channel, and Monthly Batches by Shift. It is useful when teams need to understand product demand, channel contribution, and shift-level workload.
Sales and Dispatch
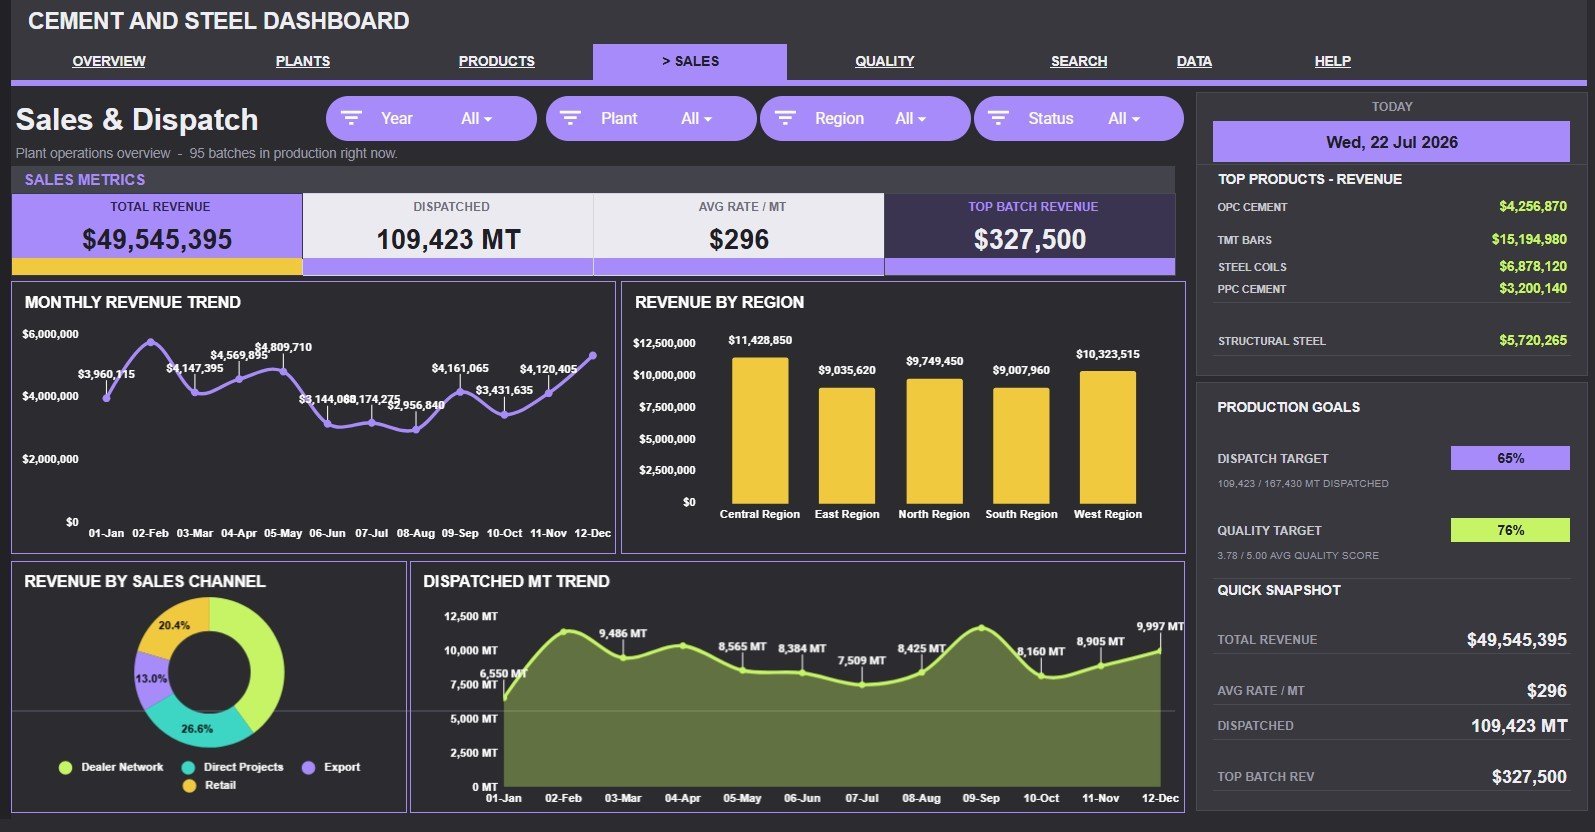
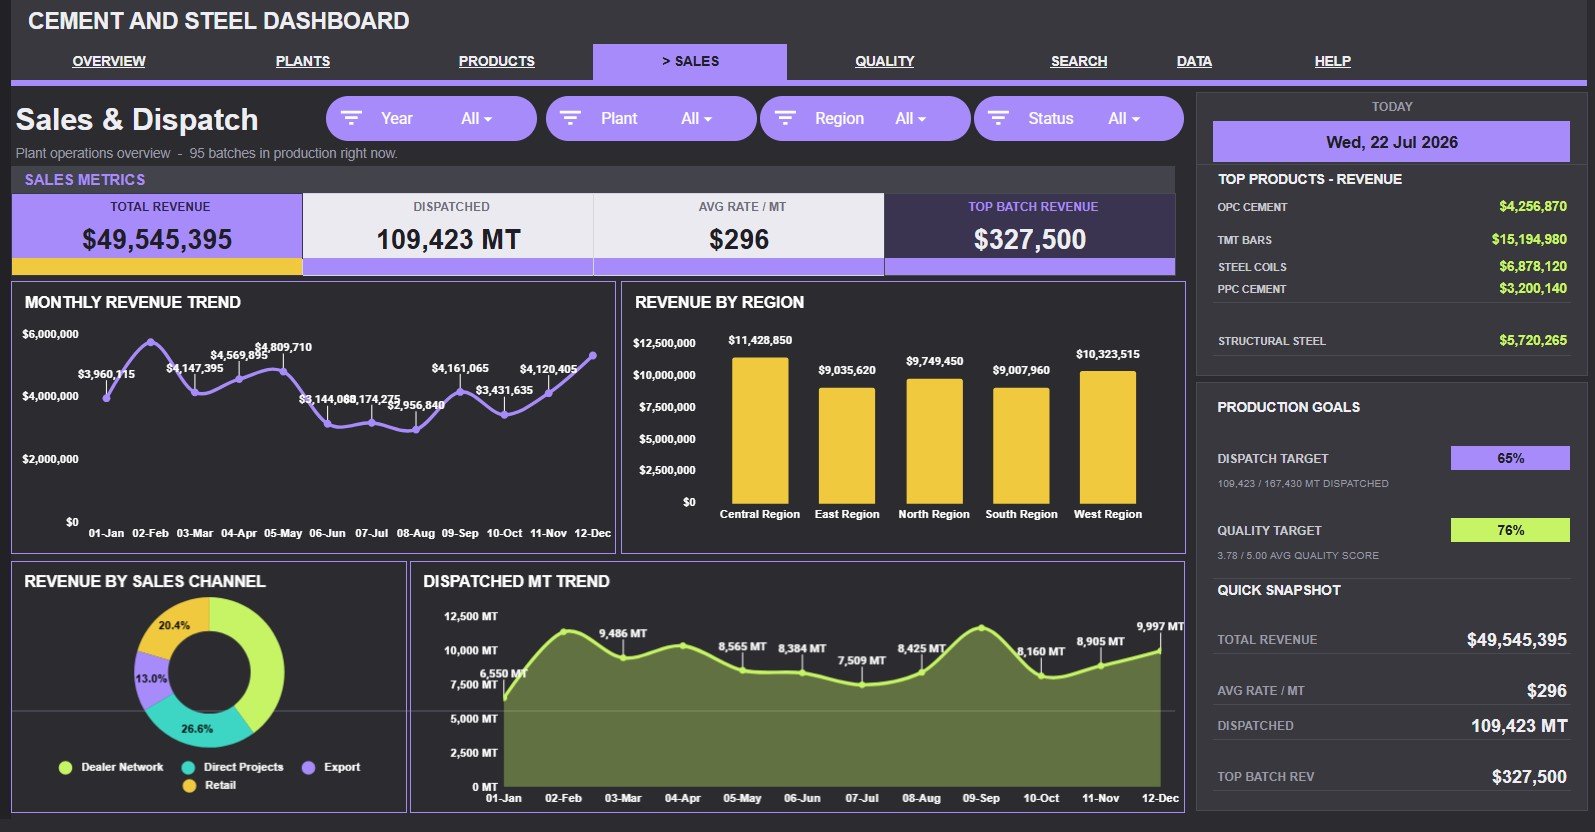
The Sales and Dispatch tab focuses on Monthly Revenue by Month, Revenue by Region, Revenue by Sales Channel, and Dispatched MT by Month. Sales managers can use it to compare demand, dispatch movement, and channel performance in one view.
Quality Control
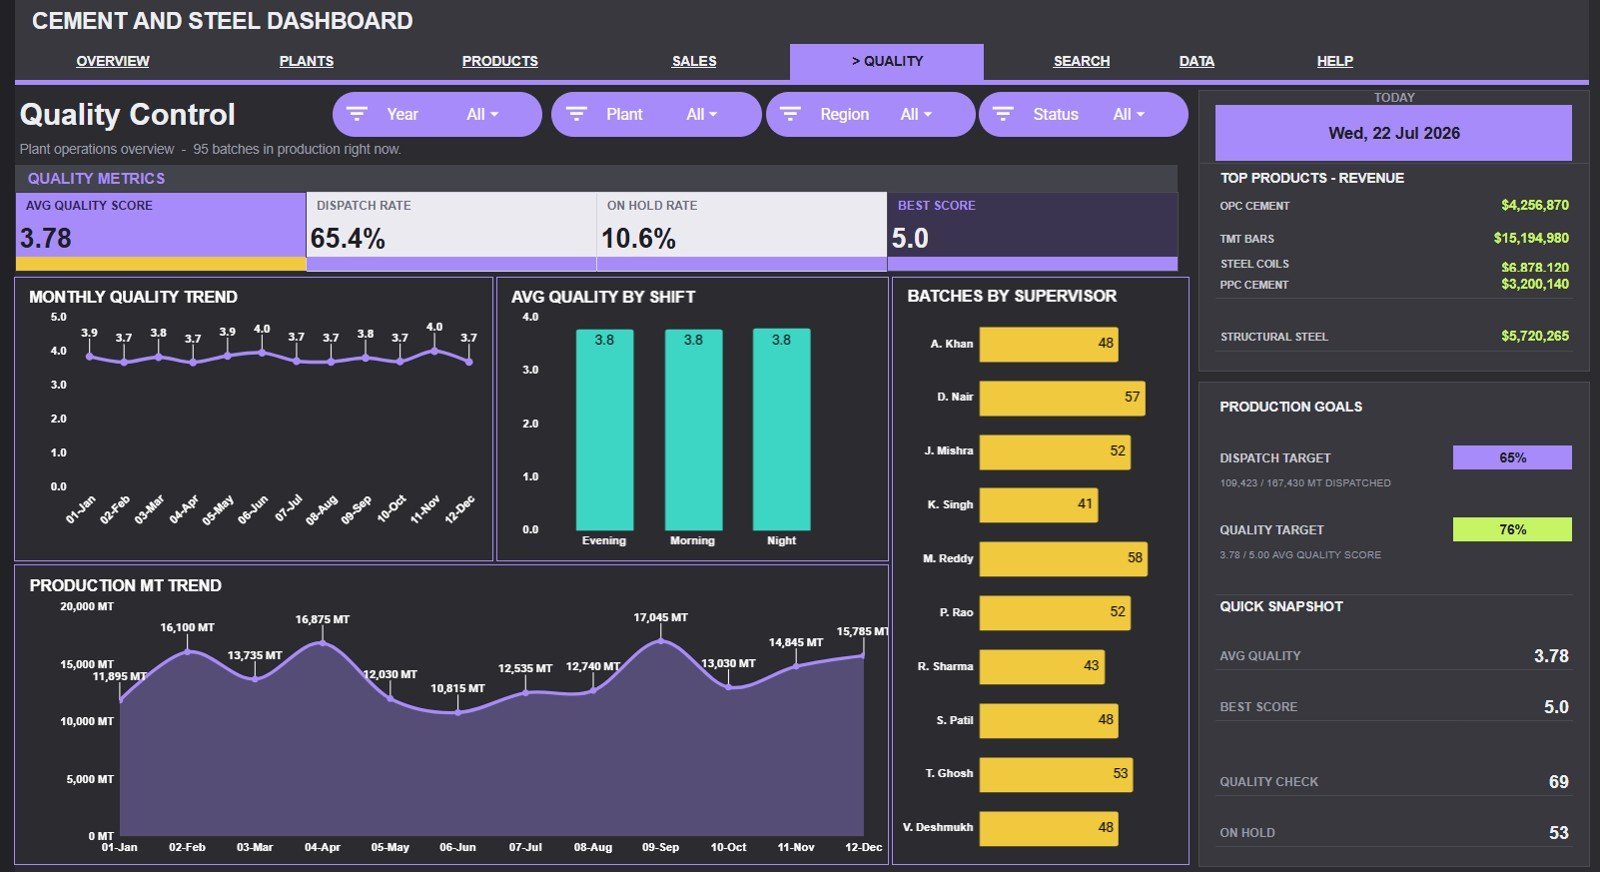
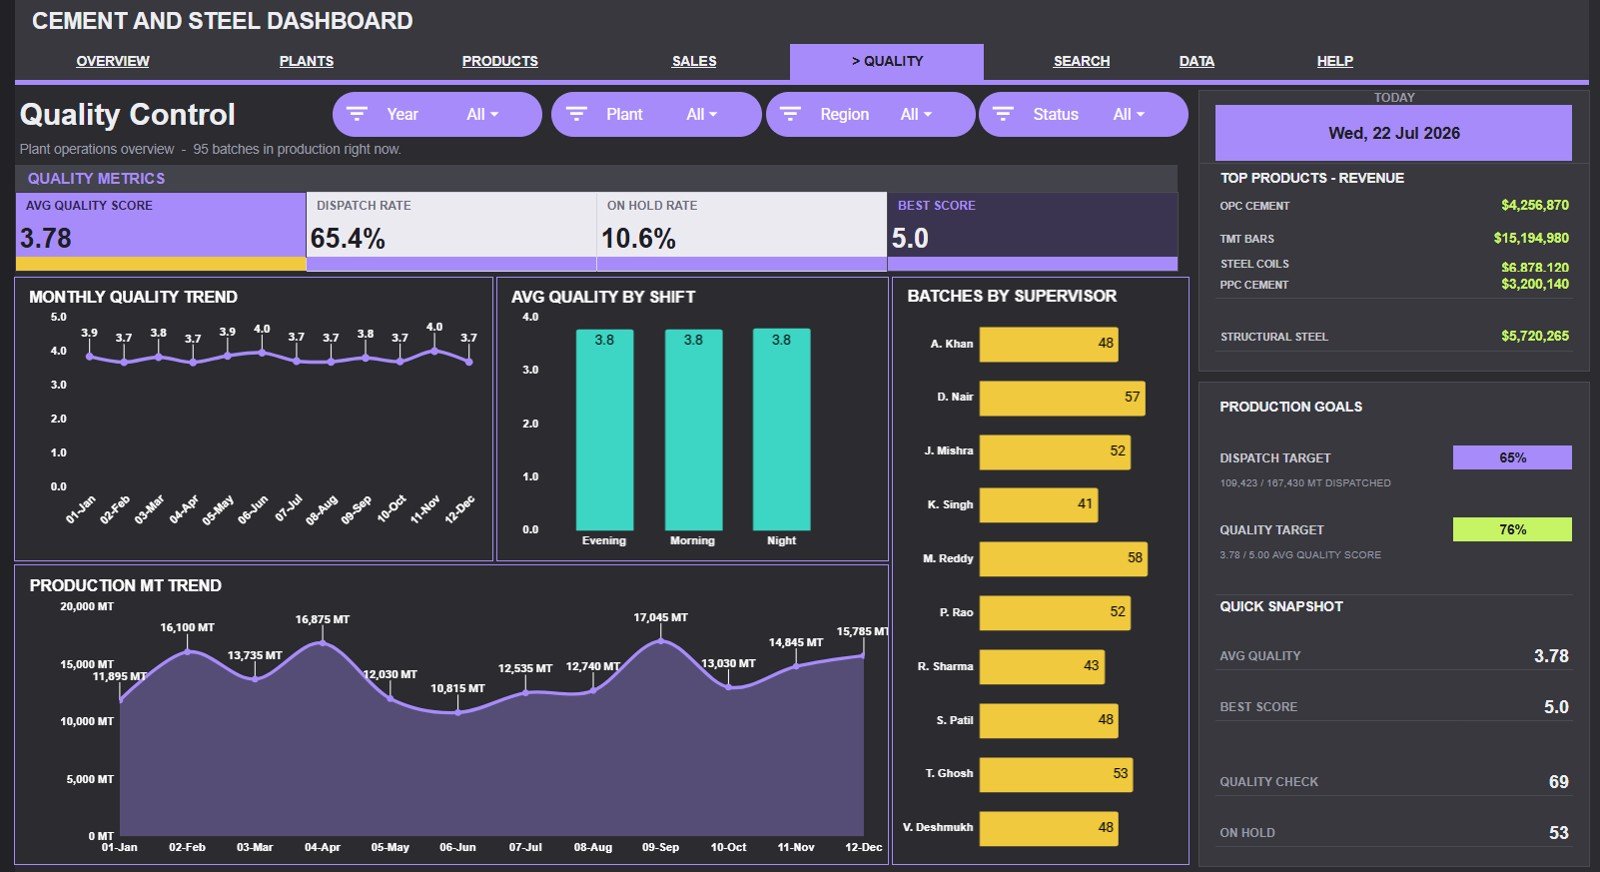
The Quality Control tab reviews Monthly Quality Score by Month, Avg Quality by Shift, Batches by Supervisor, and Production MT by Month. Quality teams can compare scores, supervisor activity, and production trends before review meetings.
Search Sheet Tab
The Search Sheet lets users select a Batch ID and see the full record details in one place, including date, product, plant, region, sales channel, status, shift, supervisor, production, dispatched quantity, revenue, and quality score.
Data Sheet Tab
The Data Sheet is where users add or update production, dispatch, revenue, status, shift, supervisor, and quality records in the same structure used by the dashboard. Keeping this sheet clean keeps every chart, slicer, card, and lookup working correctly.
Cement and Steel Dashboard in Google Sheets vs. Microsoft Excel Dashboard vs. Paid ERP/SaaS – Where This Fits
| Feature | This Google Sheets dashboard | Microsoft Excel dashboard | Paid ERP or manufacturing SaaS |
|---|---|---|---|
| Cost | $9.99 one-time | One-time template or Excel license | Usually monthly or annual subscription |
| Platform | Google Sheets in browser | Desktop or Microsoft 365 Excel | Vendor cloud platform |
| Setup time | Copy the file and replace sample data | Open workbook and replace sample data | Often requires onboarding |
| Collaboration | Share with link and co-edit live | Depends on file sharing setup | Usually role based |
| Batch ID lookup | Included Search Sheet | Possible with formulas | Usually record view |
| Year-1 cost at 5 users | $9.99 total | Template plus license cost if needed | Often hundreds or thousands per year |
Who This Template Is For – and Who It’s Not For
Best fit for: cement plants, steel distributors, construction-material suppliers, production supervisors, sales operations teams, quality managers, and analysts who maintain batch-level data in spreadsheets.
Not a fit for: teams needing live machine integration, automated weighbridge feeds, full ERP inventory control, accounting sync, or complex approval workflows. This is a reporting dashboard, not a full manufacturing execution system.
How to Use the Cement and Steel Dashboard in Google Sheets
- Open the included Google Sheets copy link from the PDF guide.
- Go to the Data Sheet and replace the sample records with your cement and steel batch data.
- Keep the same column structure for date, product, plant, region, channel, status, shift, supervisor, production, dispatch, revenue, and quality score.
- Use the Overview, Plant Performance, Product Mix, Sales and Dispatch, and Quality Control tabs to review performance.
- Use the Search Sheet tab to pull one Batch ID record during reviews or follow-up discussions.
Real-World Use Cases
Ravi, a cement plant manager, opens the Overview page every morning to compare Total Production with dispatched quantity and quickly spot backlog before dispatch meetings.
Meera, a steel sales operations lead, uses Revenue by Region and Revenue by Sales Channel to see where demand is rising and which channels need attention.
Arun, a quality supervisor, checks Avg Quality by Shift and Batches by Supervisor before weekly production reviews so the team can discuss quality issues with data.
Frequently Asked Questions
Is this Cement and Steel Dashboard built in Google Sheets?
Yes. The template is built for Google Sheets, so users can copy it to Google Drive, work in a browser, and share it with team members.
What KPI cards are included?
The Overview page includes Total Production, Total Revenue, Dispatch Rate, and Avg Quality Score cards.
How many analysis tabs are included?
The file includes Overview, Plant Performance, Product Mix, Sales and Dispatch, Quality Control, Search Sheet, and Data Sheet tabs.
Can I look up one batch record?
Yes. The Search Sheet lets users select a Batch ID and view full details such as date, product, plant, region, status, shift, supervisor, production, dispatch, revenue, and quality score.
Can I customize the dashboard?
Yes. Since it is a Google Sheets template, users can adjust labels, formulas, charts, fields, and layout after making their own copy.
Does it replace ERP software?
No. It is designed for spreadsheet-based reporting and analysis. Teams needing automated ERP workflows, inventory modules, or machine data integrations may need a separate system.
About the Author
Built by PK – Microsoft Certified Professional with 15+ years of Excel, Google Sheets, and Power BI experience. Founder of NextGenTemplates, reaching 300K+ subscribers across YouTube channels. Every template is hand-built and tested before release.
Explore Related Templates
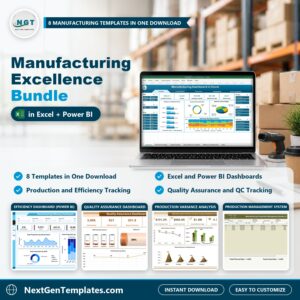
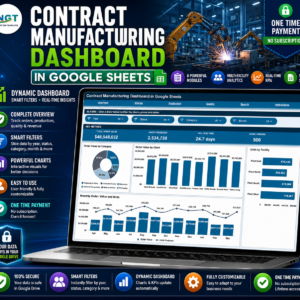
For related manufacturing dashboards, see the Cement Products Dashboard in Power BI, Steel and Metals Dashboard in Power BI, Cement Industry KPI Dashboard in Excel, Contract Manufacturing Dashboard in Google Sheets, and the Manufacturing Excellence Bundle. Browse more Google Sheets Dashboard templates and Manufacturing templates.
Watch the step-by-step video Demo:
Click here to read the detailed blog post
Instant access. One-time payment. No subscription.
Last updated: July 22, 2026.
Compatibility and Requirements
- Works in Google Sheets. You need a free Google account and a web browser.
- The dashboard uses charts and slicers to filter the views. Google explains charts in Add and edit a chart or graph.












Reviews
There are no reviews yet.