

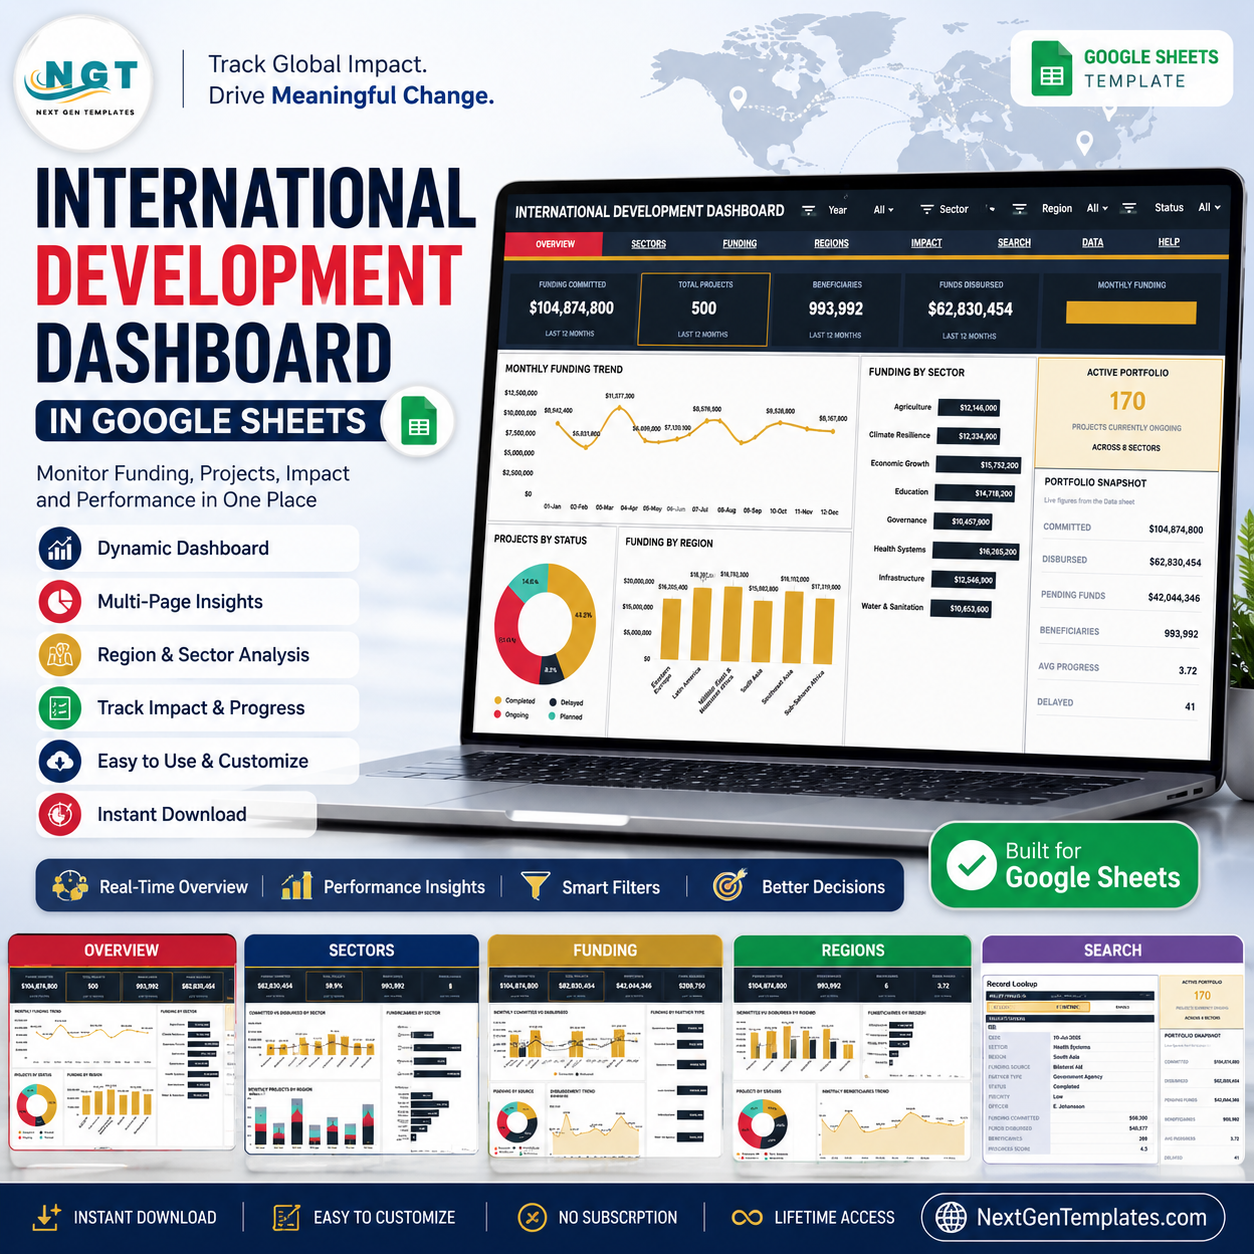

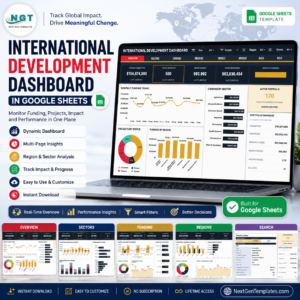
The International Development Dashboard in Google Sheets helps NGOs, donor agencies, program teams, and government partners monitor funding, disbursement, beneficiaries, sectors, regions, project status, and progress in one shared file. OECD preliminary 2025 data reported USD 174.3 billion in official development assistance, down 23.1% from 2024, so clear tracking matters. Built by PK for a 300K+ subscriber learning audience, this template gives you a one-time purchase, editable structure, and a practical risk-reduction step before investing in a custom M&E system.
Key Features of International Development Dashboard in Google Sheets
- Seven Google Sheets tabs: Overview, Sectors, Funding, Regions, Impact, Search Sheet, and Data Sheet.
- High-level KPI cards: Funding Committed, Total Projects, Beneficiaries, Funds Disbursed, Monthly Funding, Active Portfolio, Committed, Disbursed, Pending Funds, Avg Progress, and Delayed.
- Interactive slicers: Filter the dashboard quickly by project, sector, region, status, priority, officer, funding source, or partner type.
- Funding analysis: Compare committed and disbursed funding by month, sector, region, source, and partner type.
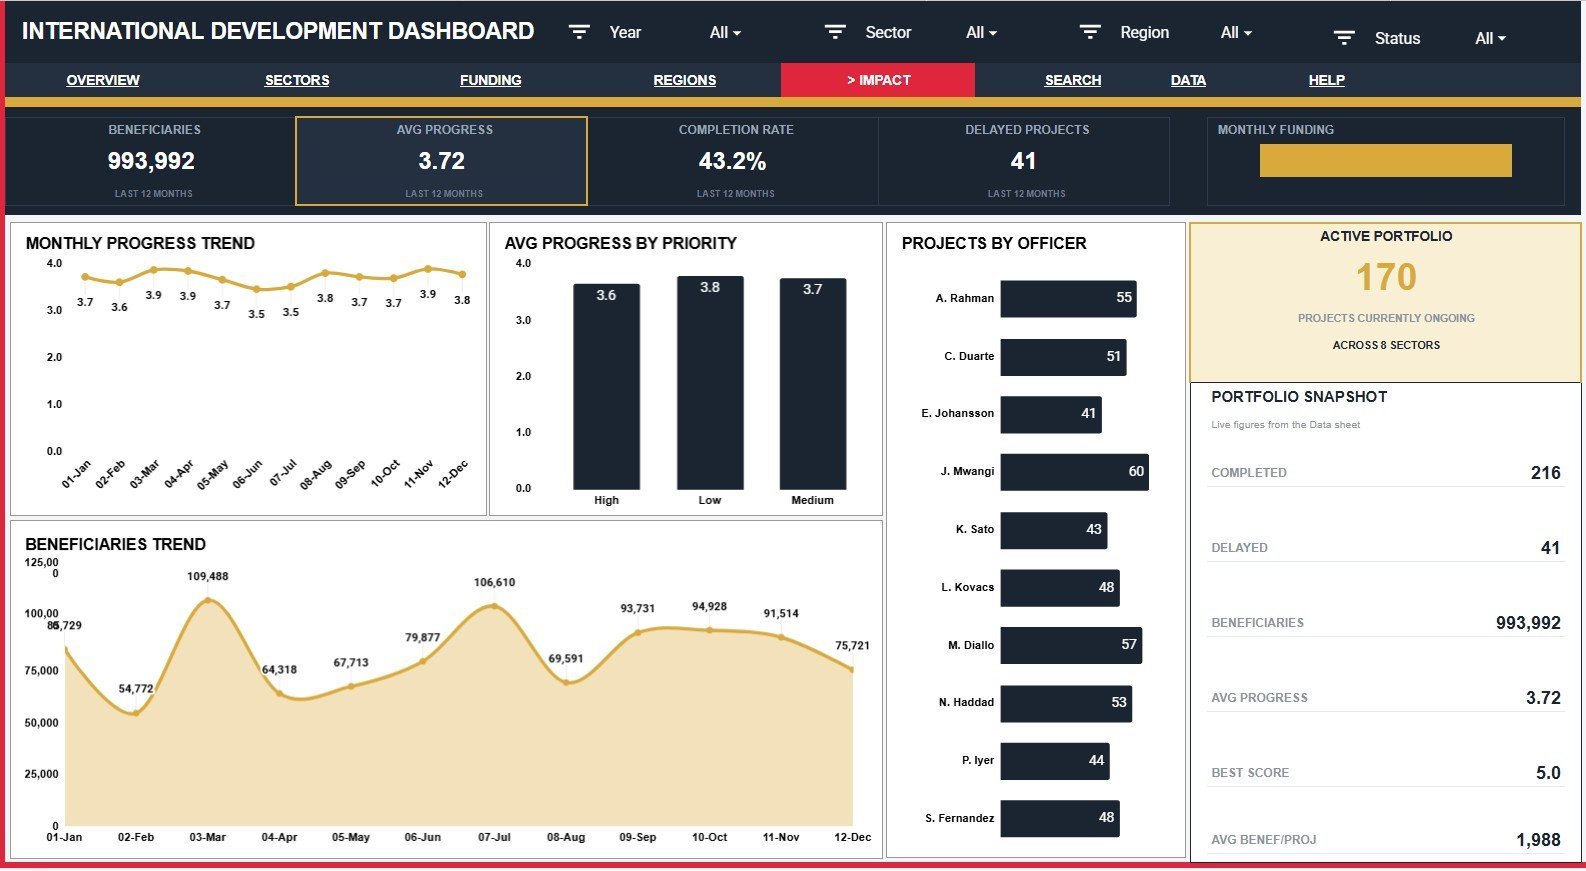
- Impact analysis: Review beneficiaries, average progress, delayed projects, officer workload, and priority-level performance.
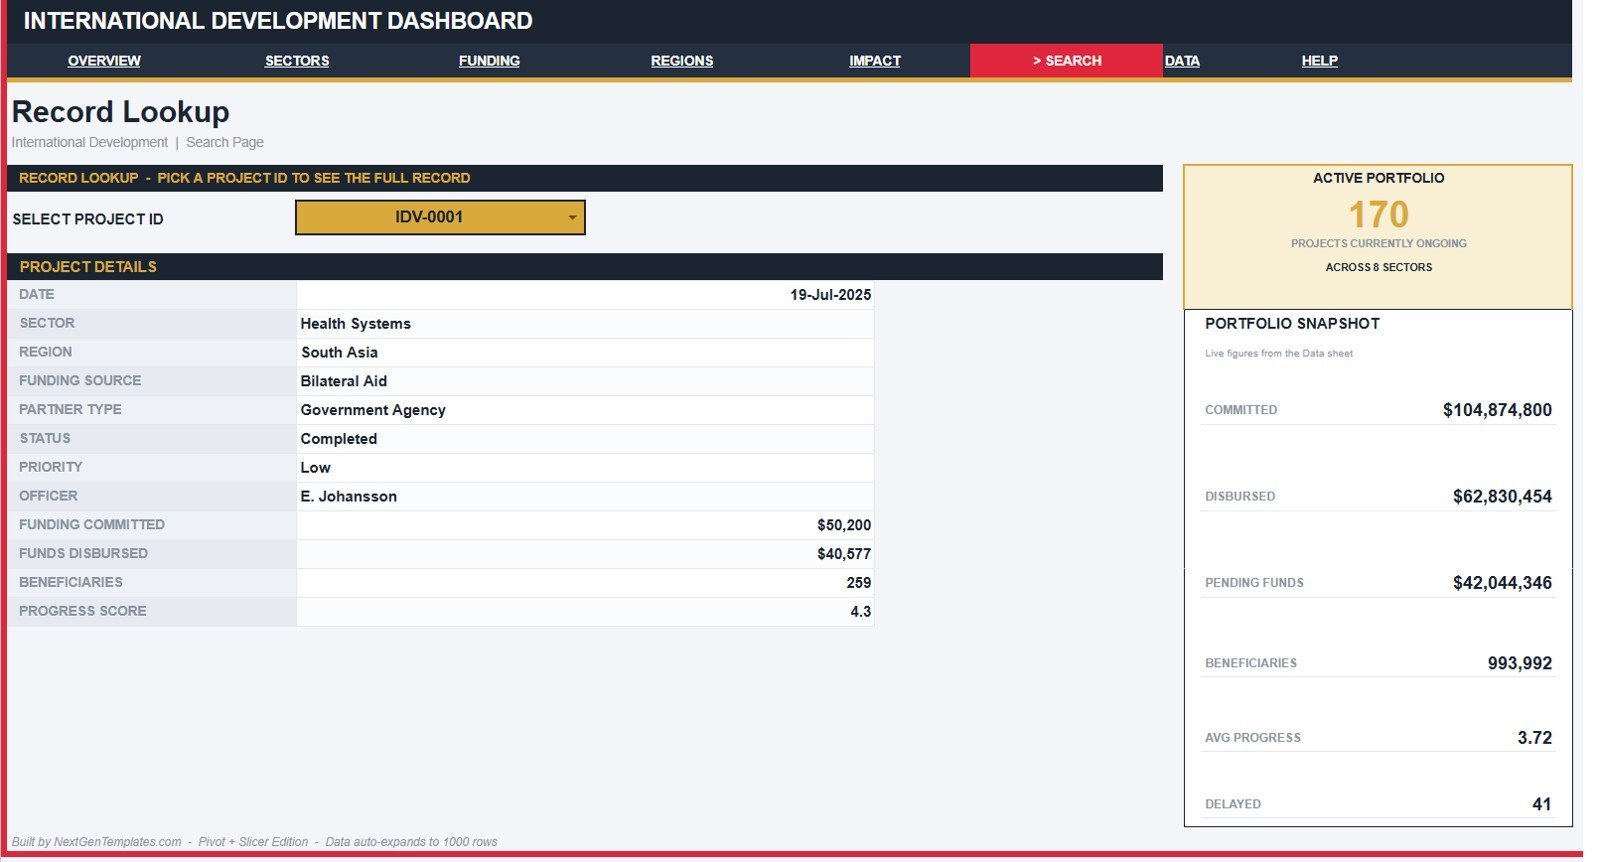
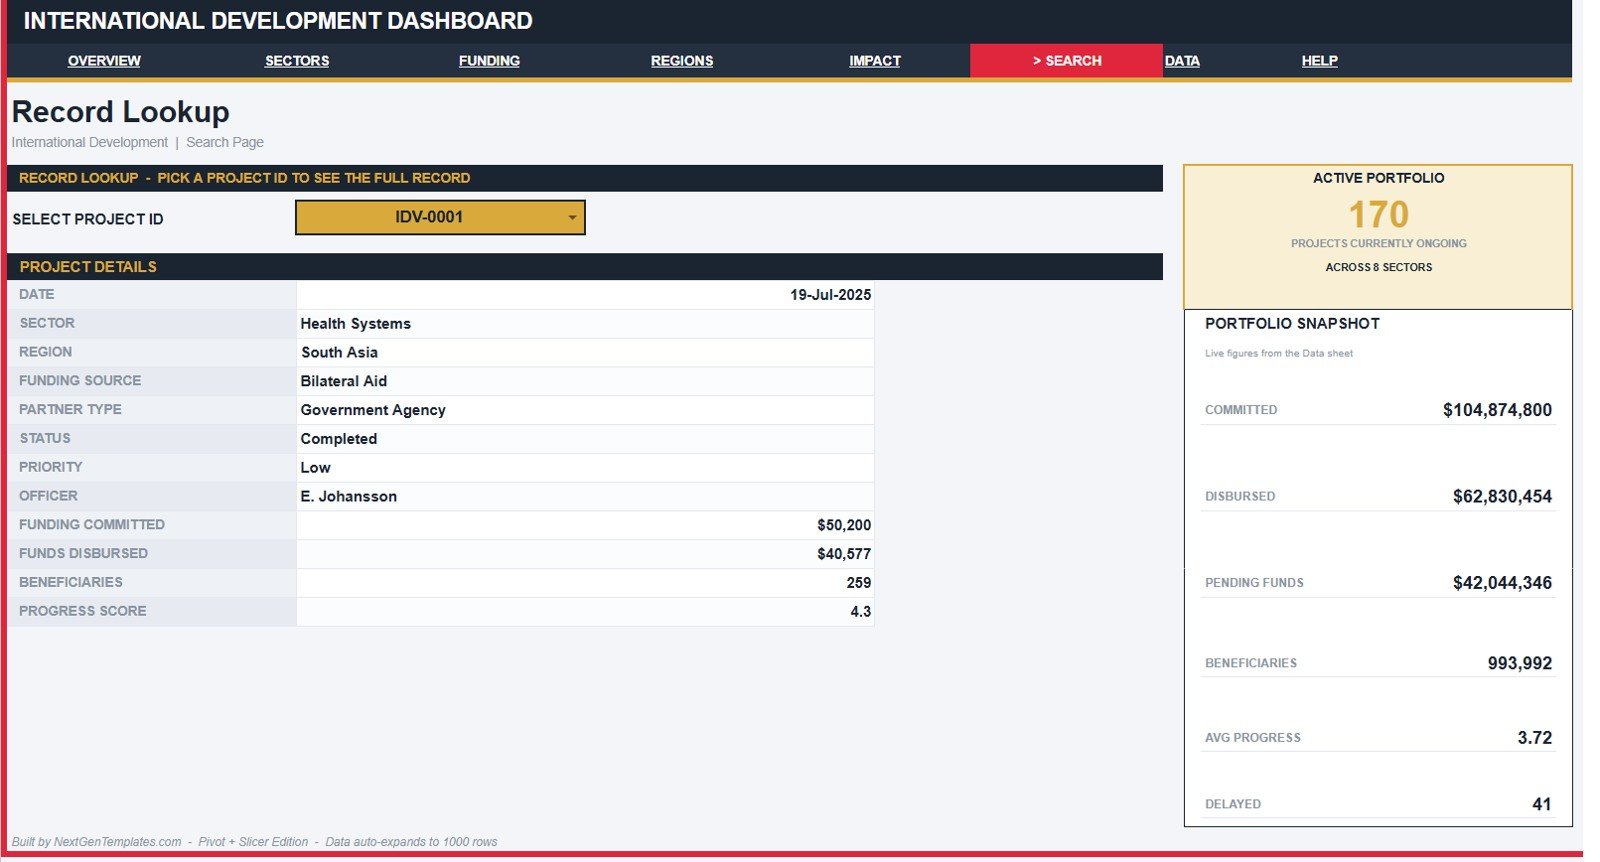
- Project lookup: Select a Project ID and display the full record in the Search Sheet.
- Editable source data: Replace sample rows in the Data Sheet while keeping the same column layout.
What’s Inside the International Development Dashboard in Google Sheets
Overview Page
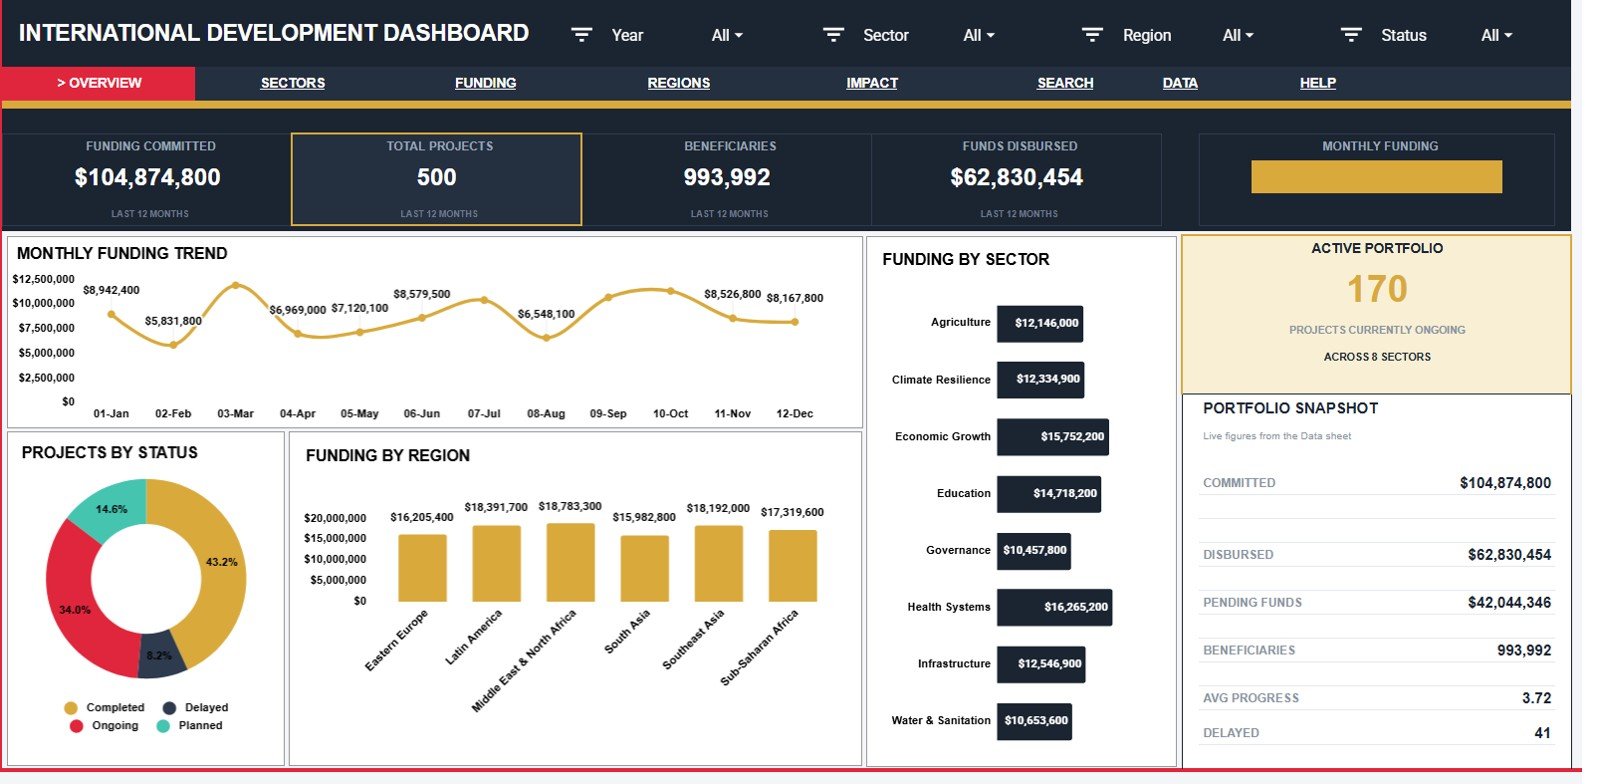
The Overview page gives leadership a quick read on committed funding, projects, beneficiaries, disbursement, pending funds, average progress, active portfolio, and delayed work. Monthly Funding by Month shows funding movement over time. Projects by Status shows whether work is active, delayed, completed, or pending. Funding by Region highlights geographic allocation, while Funding by Sector shows where donor money is concentrated.
Sectors Page
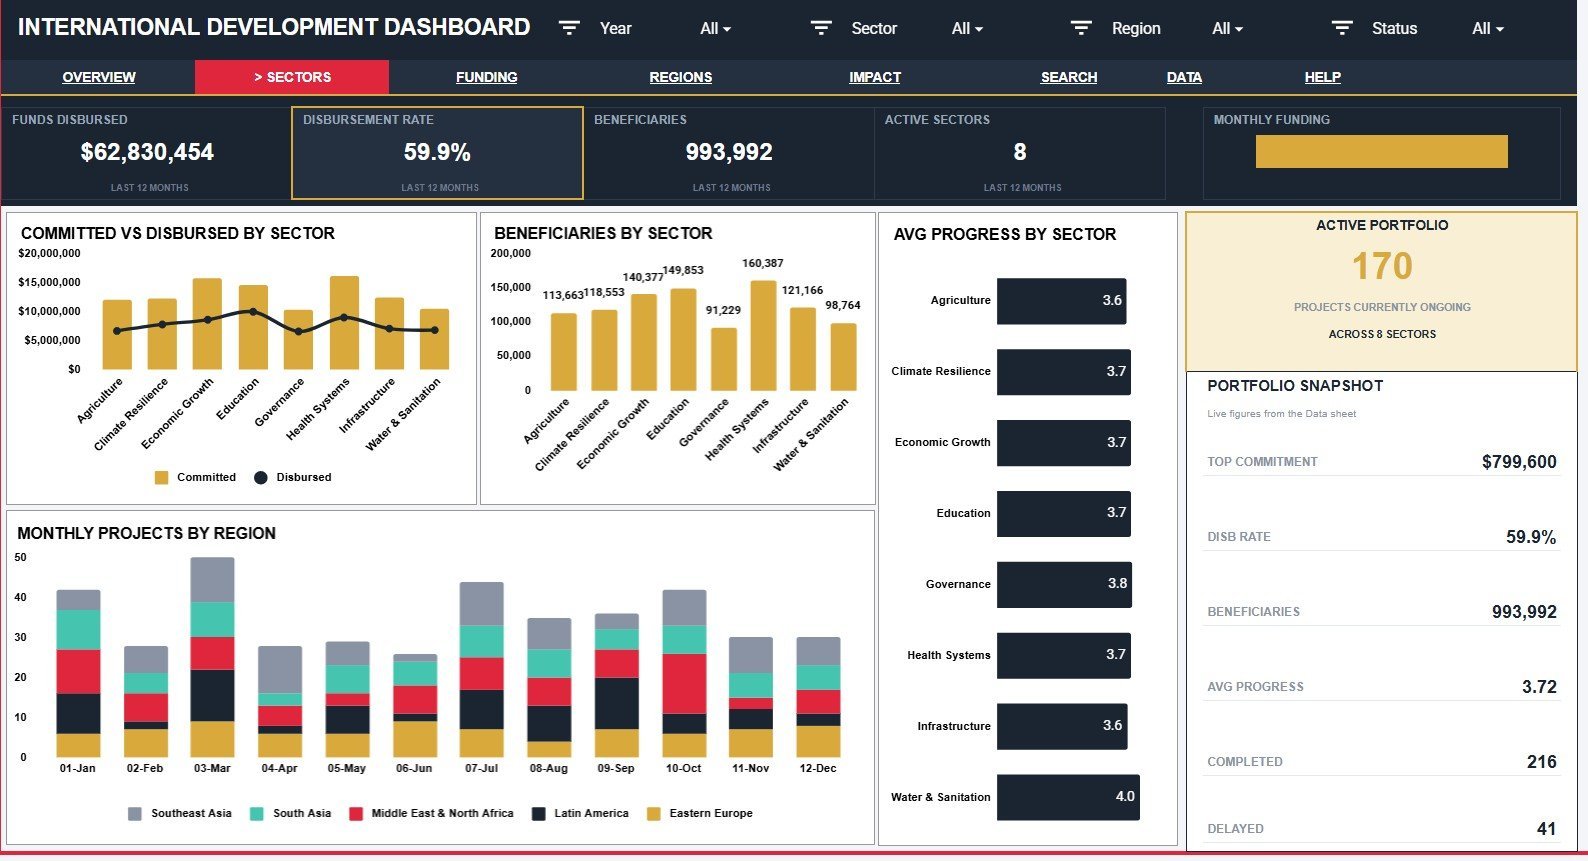
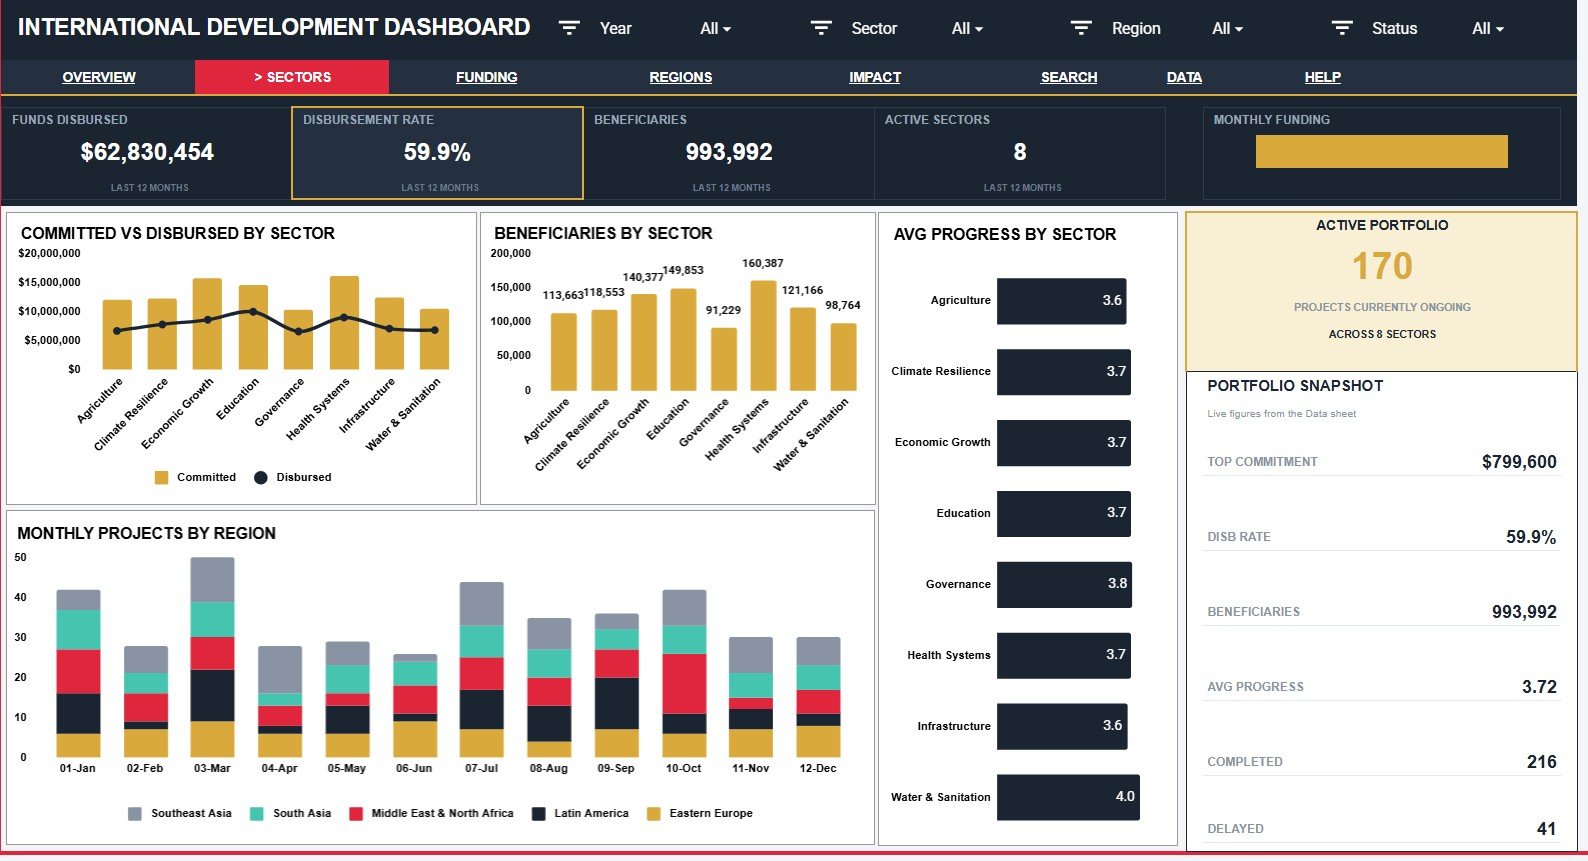
The Sectors tab explains how funding and outcomes differ across program areas. Committed and Disbursed Funding by Sector compares promised money with actual release. Beneficiaries by Sector shows reach, Average Progress by Sector indicates delivery health, and Monthly Projects by Region shows how project volume changes geographically.
Funding Page
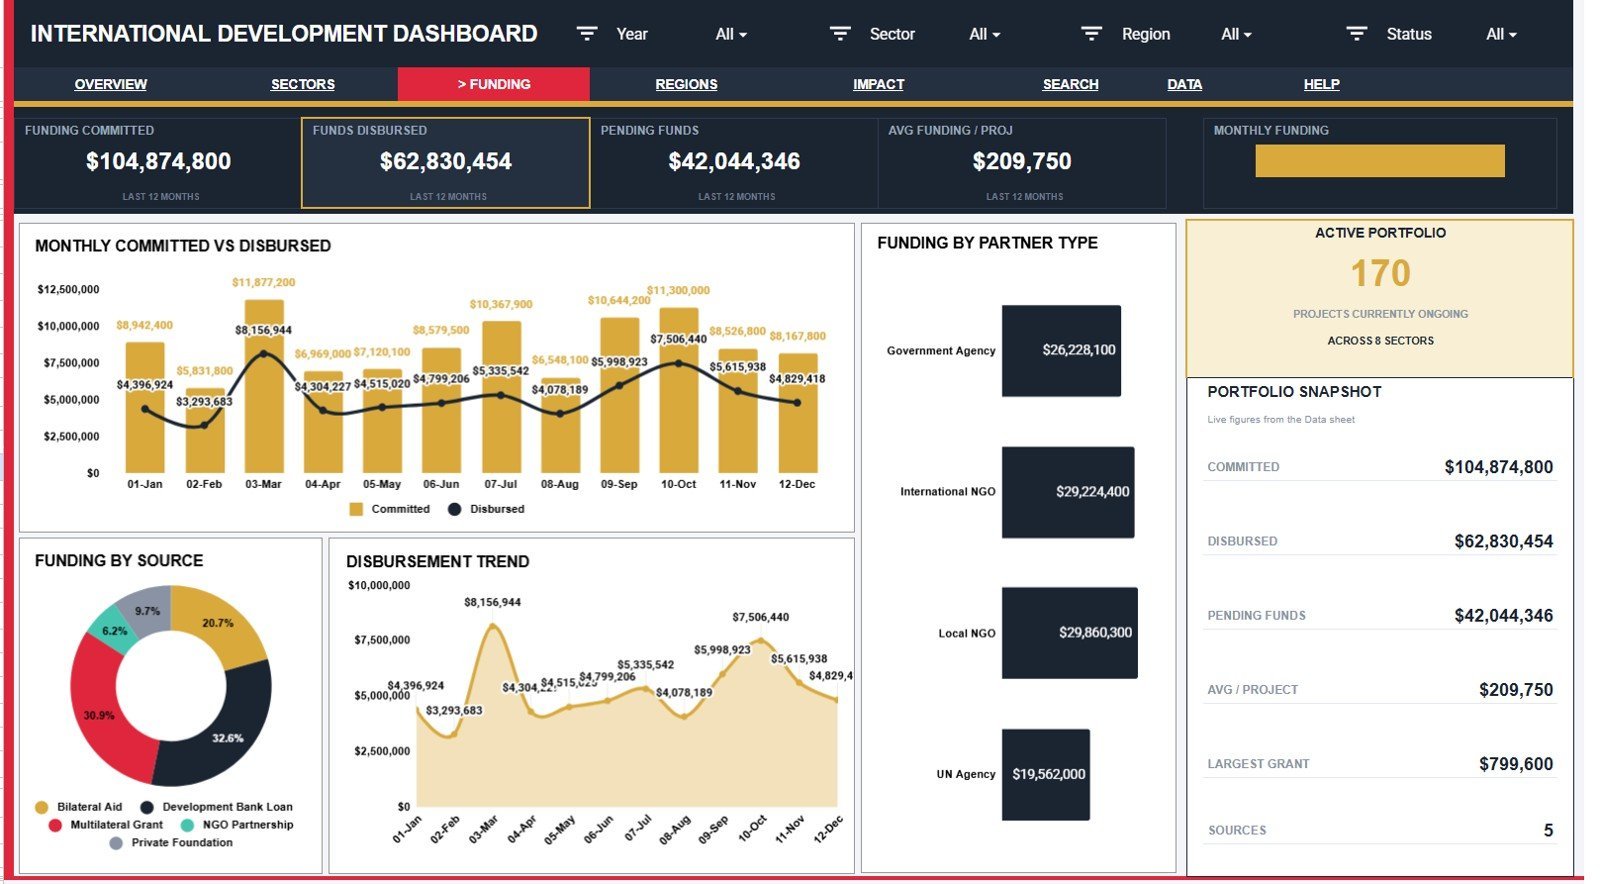
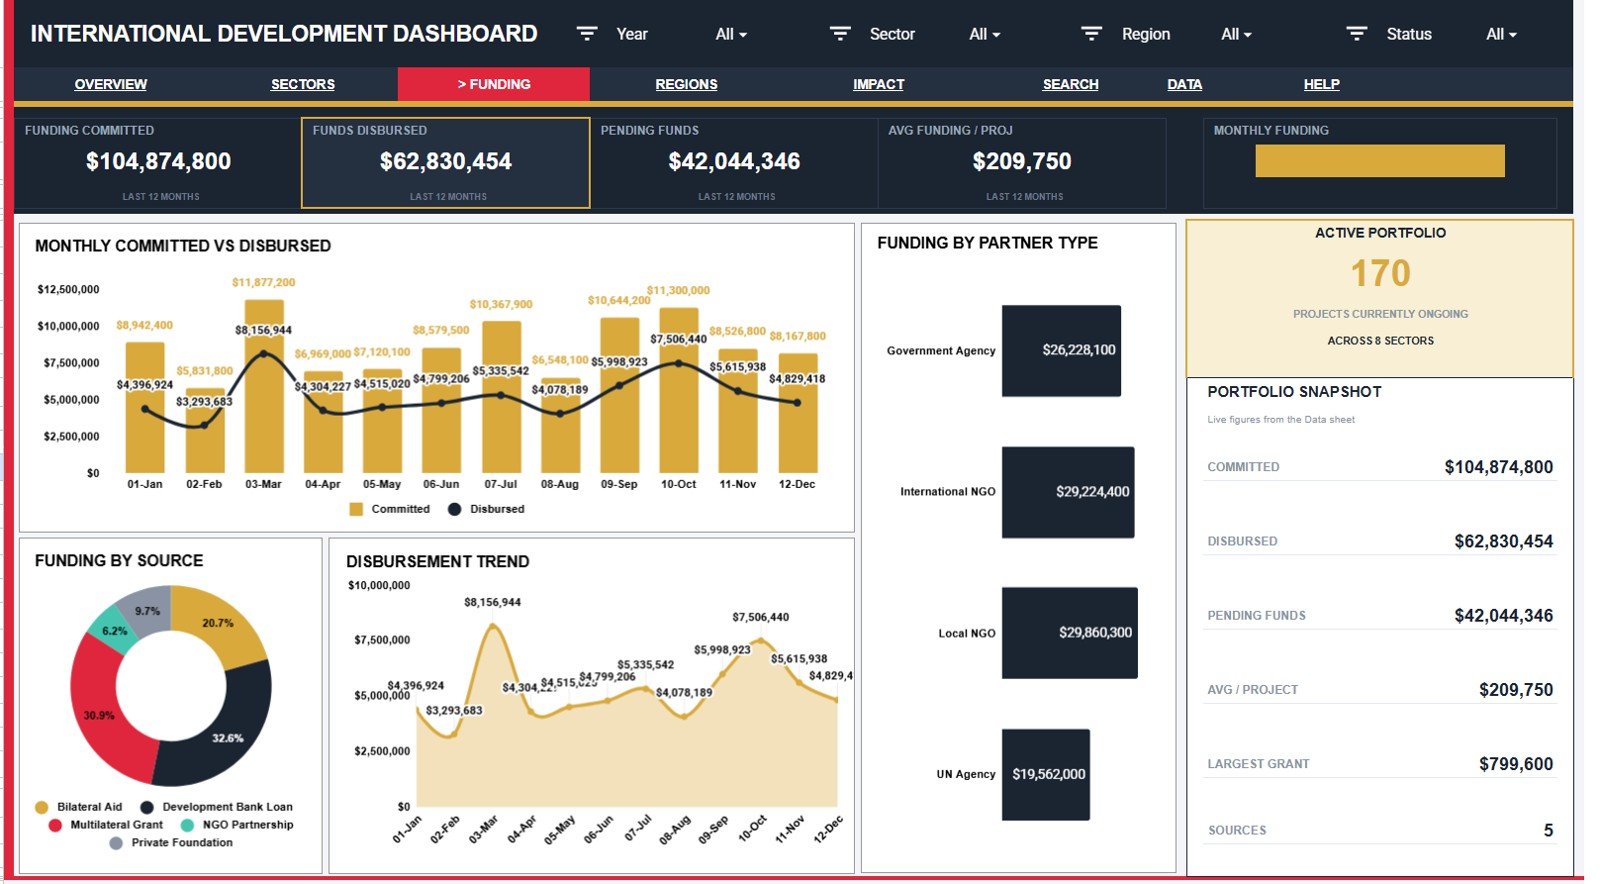
The Funding tab is built for donor reporting and finance review. Committed and Disbursed Funding by Month shows timing gaps. Funding by Source identifies major funding streams. Disbursement by Month shows release pace, and Funding by Partner Type compares implementation channels.
Regions Page
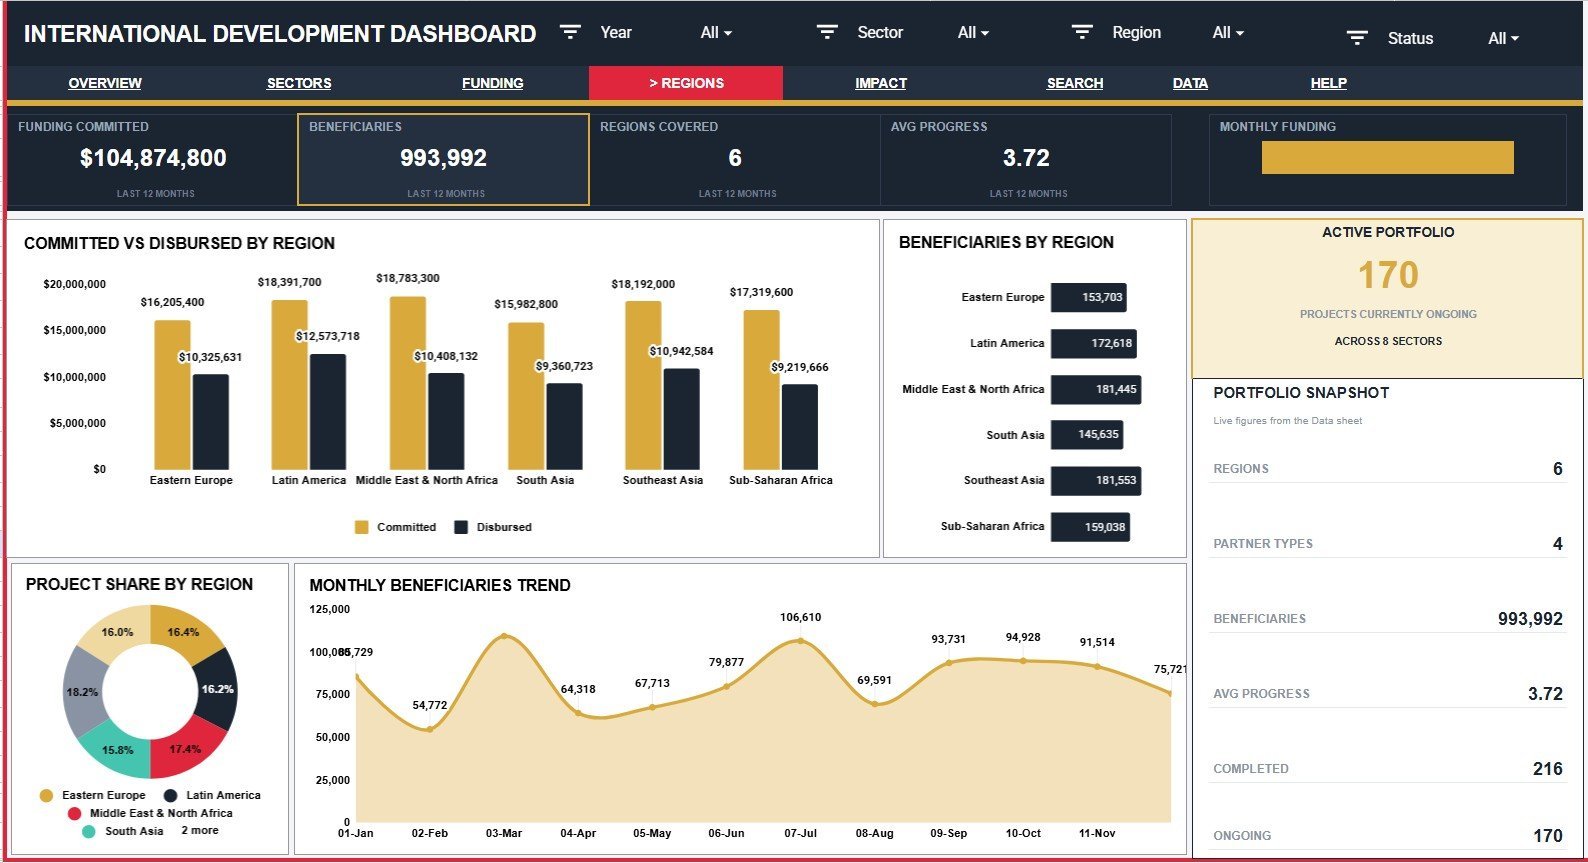
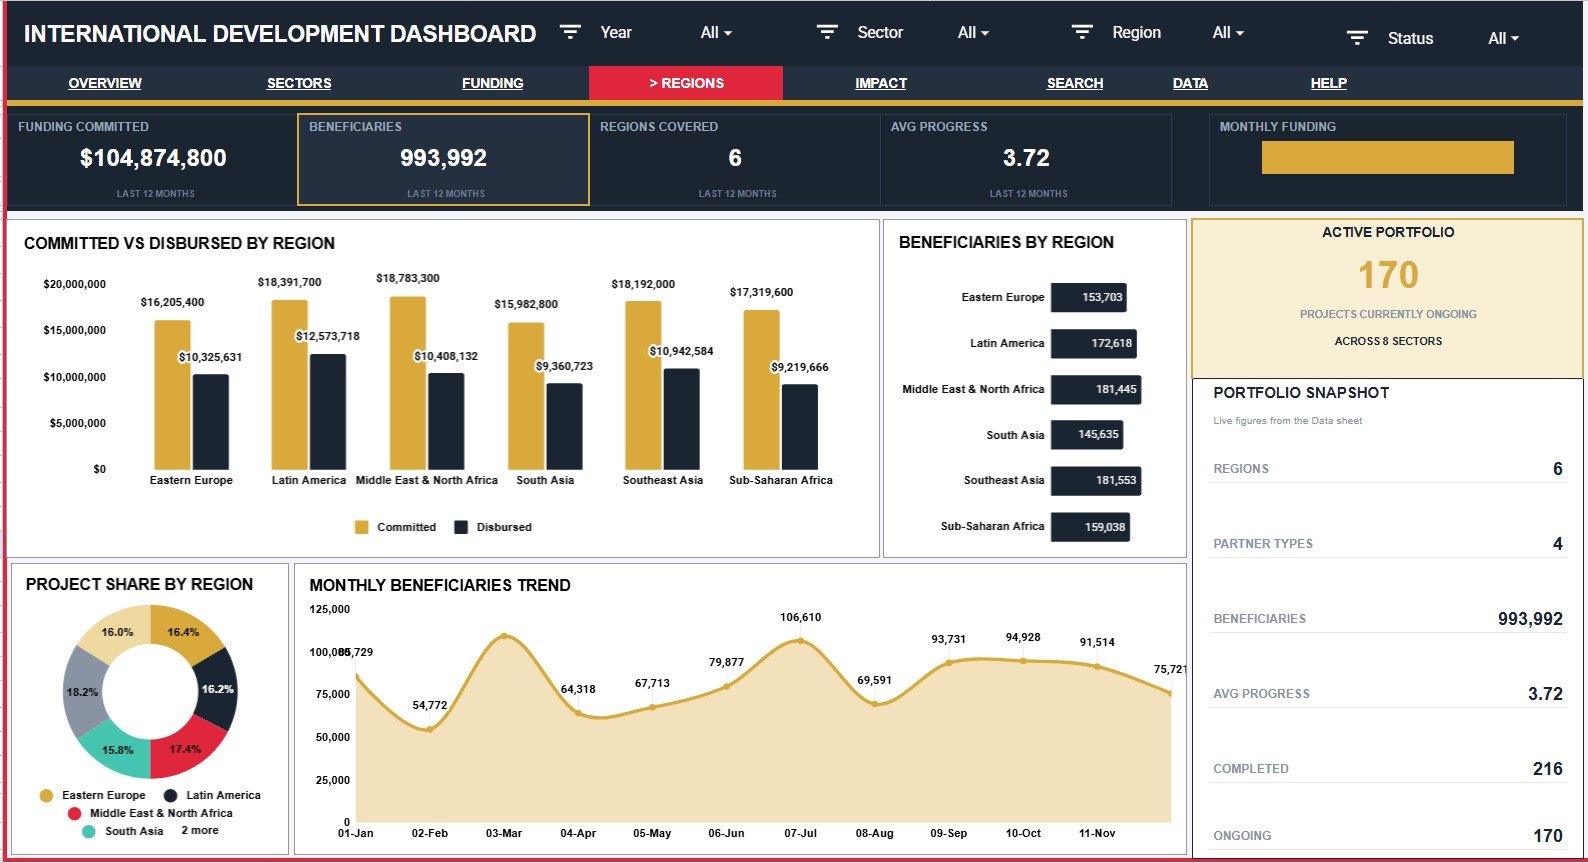
The Regions tab helps managers compare project funding and reach across geographies. Committed and Disbursed Funding by Region reveals funding balance by area. Beneficiaries by Region shows where support is reaching people, Project Share by Region shows distribution, and Monthly Beneficiaries by Month shows reach over time.
Impact Page
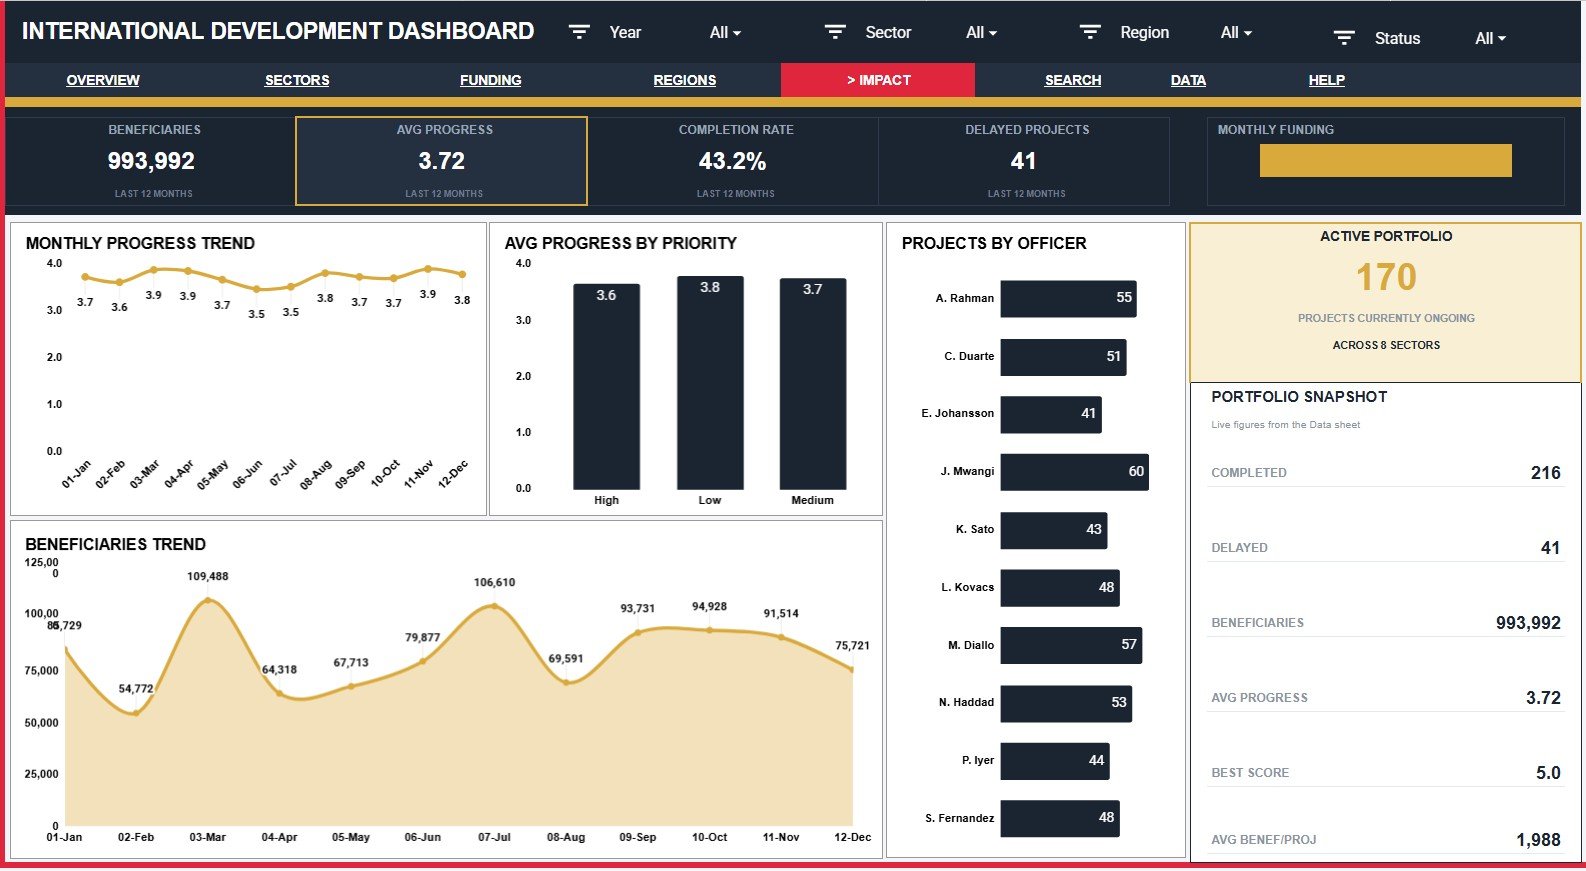
The Impact tab focuses on progress and accountability. Average Progress by Month shows delivery movement. Average Progress by Priority compares urgent and routine work. Projects by Officer shows ownership, while Beneficiaries by Month tracks program reach.
Search Sheet Tab
The Search Sheet lets you select a Project ID and view the full project record, including date, sector, region, funding source, partner type, status, priority, officer, funding committed, funds disbursed, beneficiaries, and progress score.
Data Sheet Tab
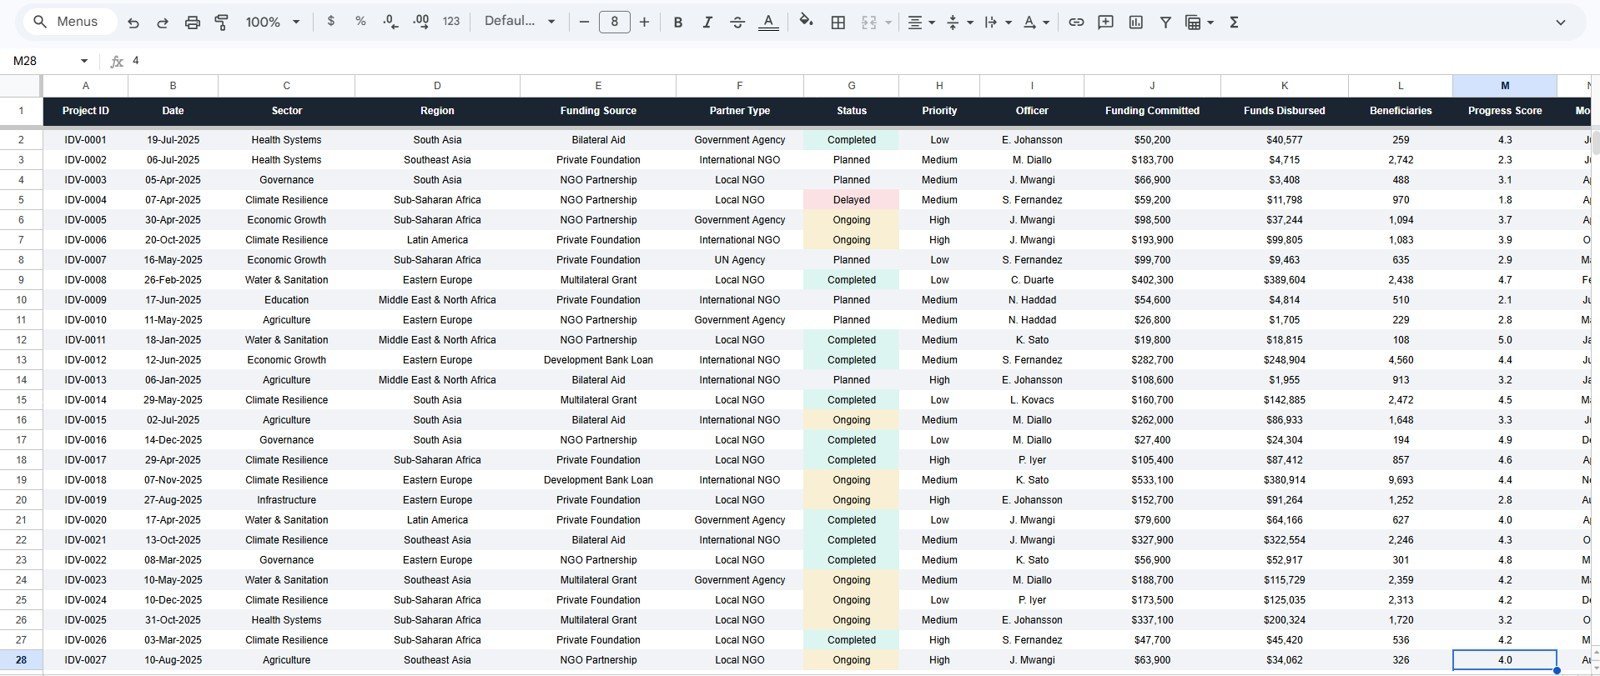
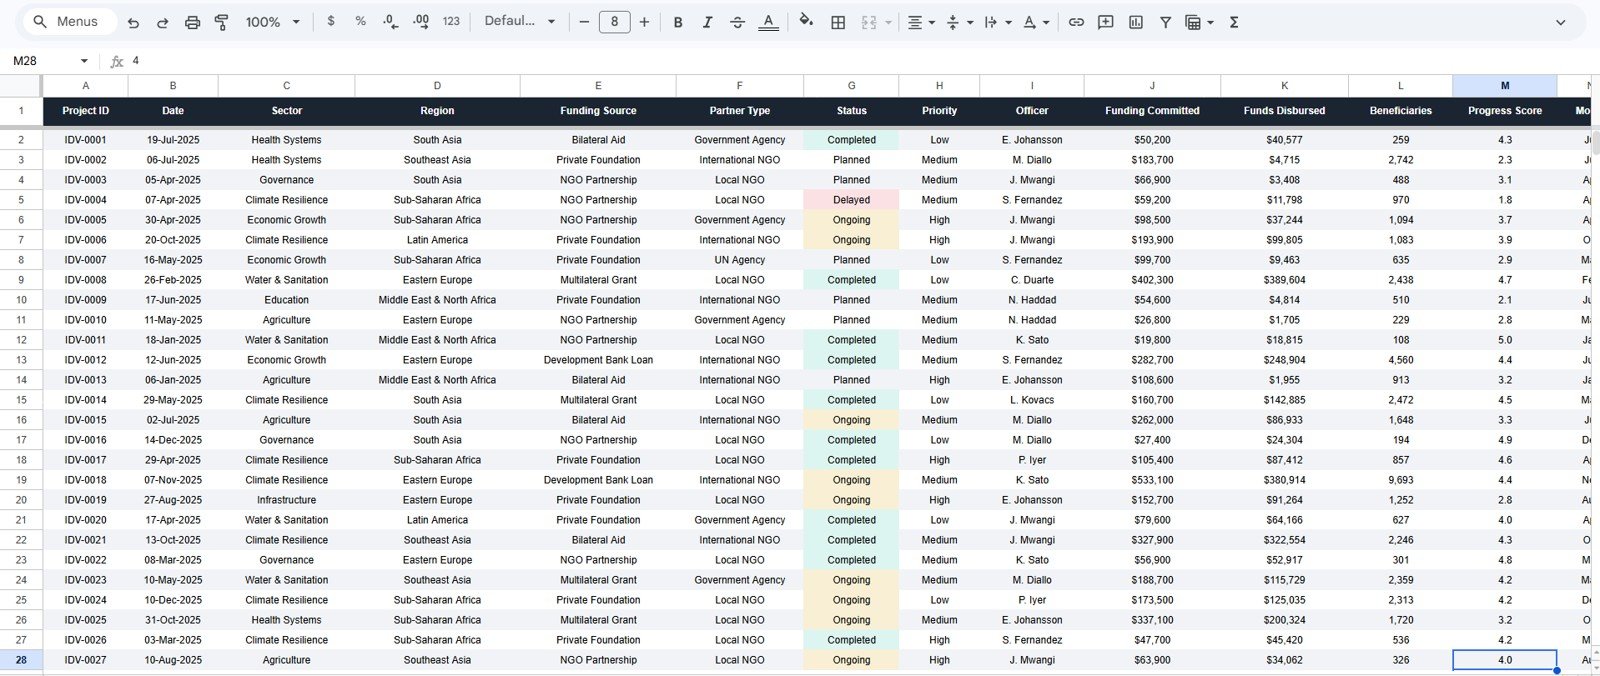
The Data Sheet stores the source records that power the dashboard. Add new data in the same format so cards, slicers, charts, and the Project ID lookup continue to update correctly.
International Development Dashboard in Google Sheets vs. Microsoft Excel Dashboard vs. Paid M&E SaaS – Where This Fits
| Feature | This Google Sheets dashboard | Microsoft Excel dashboard | Paid M&E or grant SaaS |
|---|---|---|---|
| Cost | $9.99 sale price, one-time | Template cost plus Excel licensing | Usually monthly or annual subscription |
| Platform | Google Sheets in Drive | Excel desktop or web | Vendor-hosted application |
| Setup time | Copy the file and replace sample data | Open workbook and customize | Often requires onboarding and configuration |
| Real-time team collaboration | Native Google Sheets sharing | Depends on Microsoft 365 setup | Usually seat-based |
| Mobile access | Google Sheets app or browser | Excel mobile app | Usually included |
| Customizable fields | Editable sheet labels and records | Editable workbook structure | Depends on vendor permissions |
| Share with link | Yes, through Drive permissions | Yes, through OneDrive or SharePoint | Usually invite-based |
| Year-1 cost at 5 users | $9.99 before any Google Workspace cost | Template plus license costs | Can rise quickly with users and modules |
| Project ID lookup | Included Search Sheet | Must be built or customized | Usually included |
| Best fit | Fast reporting and donor review | Teams standardized on Excel | Complex programs needing workflows and integrations |
Who This Template Is For – and Who It’s Not For
This template is for NGOs, international development teams, donor-funded programs, government project units, grant managers, monitoring and evaluation officers, regional coordinators, and consultants who already collect project records and need a clearer reporting layer.
It is not a replacement for a regulated grant management system, secure case management platform, accounting ledger, beneficiary identity system, or field-data collection app. If your organization needs role-based approvals, audit trails, offline survey collection, or automated finance integrations, treat this dashboard as a reporting companion.
How to Use the International Development Dashboard in Google Sheets
- Open the PDF guide from your download and copy the Google Sheets template to your Drive.
- Go to the Data Sheet and replace the sample rows with your own project records.
- Keep Project ID, date, sector, region, funding source, partner type, status, priority, officer, funding committed, funds disbursed, beneficiaries, and progress score in the same structure.
- Use slicers on the analysis tabs to filter by region, sector, source, partner type, status, priority, or officer.
- Use the Search Sheet when you need to inspect one project record quickly.
Real-World Use Cases
Amina, an M&E manager: uses the Overview and Impact tabs before monthly donor reviews to explain funding movement, beneficiary reach, progress, and delayed projects.
Jonas, a regional program lead: uses the Regions tab to compare committed and disbursed funding across field offices and spot areas where progress is lagging.
Leah, a grant consultant: uses the Funding and Sectors tabs to prepare a clean client report without rebuilding charts manually each month.
Frequently Asked Questions
What data can I track in this dashboard?
You can track Project ID, date, sector, region, funding source, partner type, status, priority, officer, funding committed, funds disbursed, beneficiaries, and progress score.
Does this template require scripts or add-ons?
No. It is designed for normal Google Sheets use with prepared dashboard pages, charts, slicers, and lookup formulas.
Can my team collaborate on it?
Yes. After copying it to Google Drive, you can share the file using Google Sheets permissions.
Can I customize sectors and regions?
Yes. You can edit labels and source records to match your program structure as long as the dashboard ranges and formulas stay aligned.
Is it suitable for donor reporting?
It is suitable as a reporting and analysis template. Always confirm your donor’s official reporting format before submitting final figures.
Does it replace grant management software?
No. It helps with visual reporting, but it does not replace approvals, procurement controls, accounting, field-data systems, or audit workflows.
About the Author
Built by PK – Microsoft Certified Professional with 15+ years of Excel, Google Sheets, and Power BI experience. Founder of NextGenTemplates, reaching 300K+ subscribers across YouTube channels. Every template is hand-built and tested before release.
Explore Related Templates
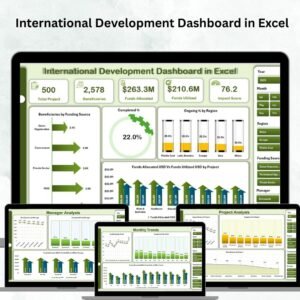
- International Development Dashboard in Excel for teams that prefer Microsoft Excel.
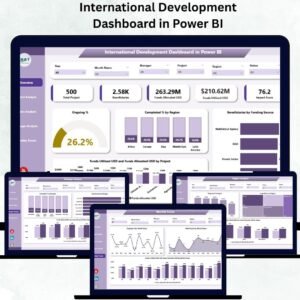
- International Development Dashboard in Power BI for BI-style development reporting.
- Nonprofit Organizations Dashboard in Google Sheets for broader nonprofit operations.
- Government Administration Dashboard in Google Sheets for public-sector reporting.
- Browse more Google Sheets templates and Google Sheets dashboard templates.
Get the International Development Dashboard in Google Sheets to turn scattered project records into a clear, filterable reporting system.
Watch the step-by-step video Demo:
Last updated: July 19, 2026.
Compatibility and Requirements
- Works in Google Sheets. You need a free Google account and a web browser.
- The analysis tabs use slicers and the Search Sheet uses a Project ID selection. Google explains charts in Add and edit a chart or graph.





























Reviews
There are no reviews yet.