

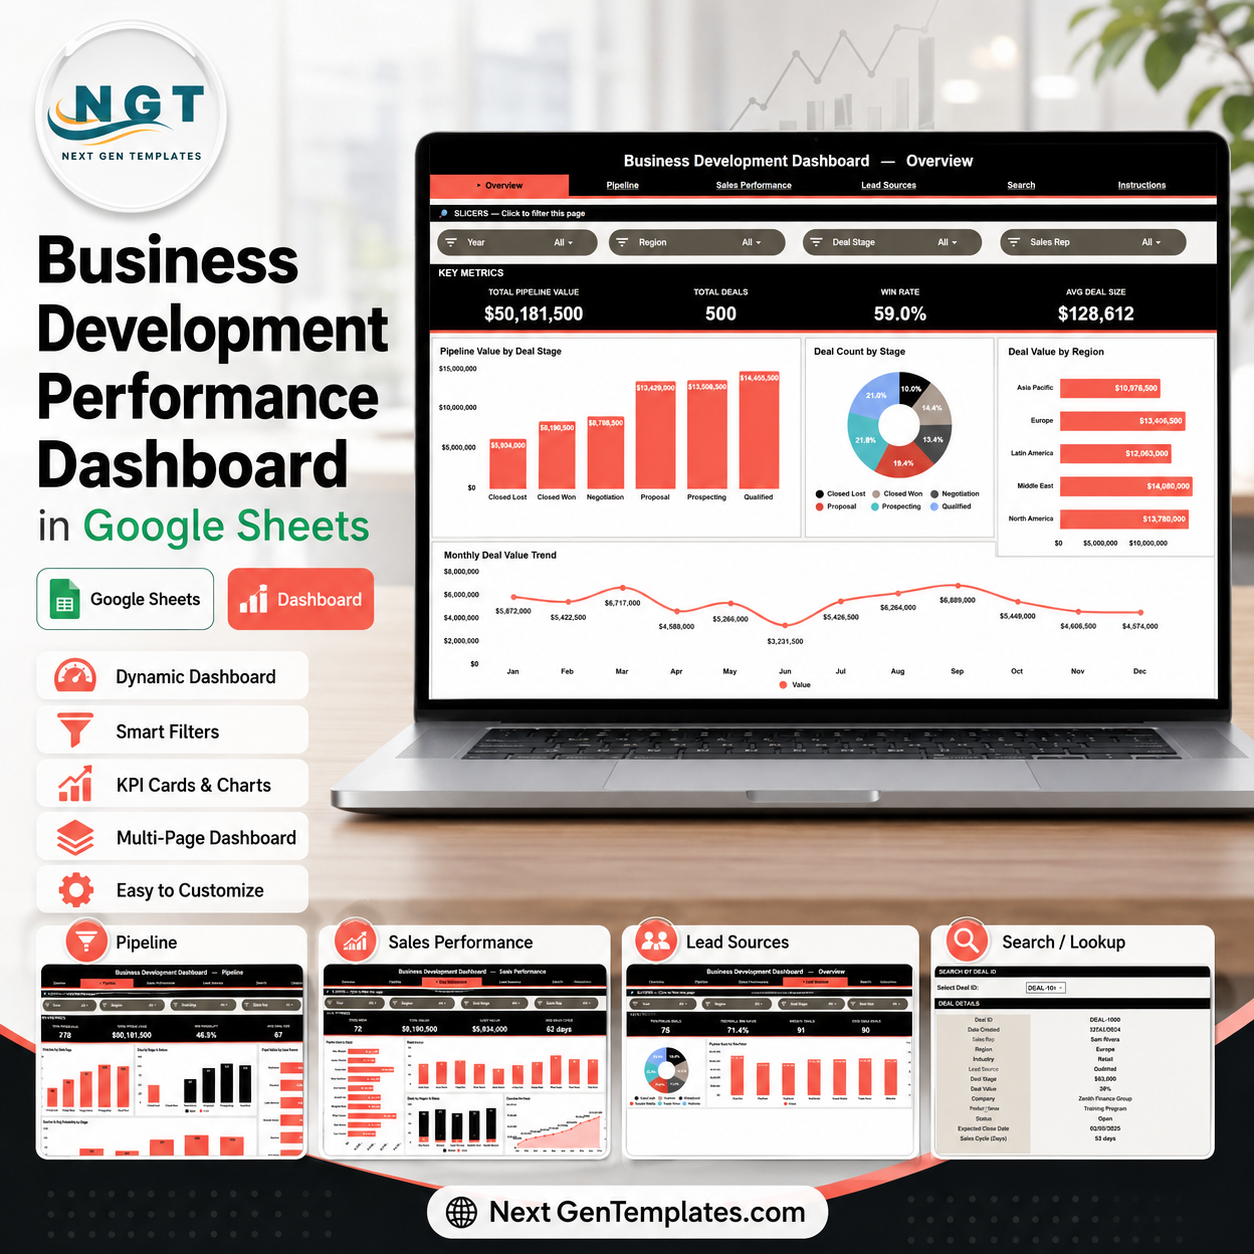
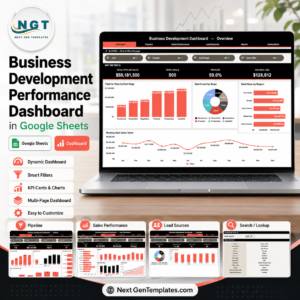
Business Development Performance Dashboard in Google Sheets gives sales and business development teams 6 working sheet tabs, 4 executive KPI cards, 16 chart views, slicer-based filtering, a Deal ID search sheet, and one editable data sheet for a one-time price. Built by PK, a Microsoft Certified Professional with 15+ years of Excel, Google Sheets, and Power BI experience and 300K+ subscribers across YouTube channels, this template helps you review pipeline health without building a dashboard from scratch. Your purchase is backed by a practical file-match review if the delivered template does not match this page.
Key Features of Business Development Performance Dashboard in Google Sheets
- 6 Google Sheets tabs: Overview, Pipeline, Sales Performance, Lead Sources, Search Sheet, and Data Sheet.
- 4 high-level KPI cards: Total Pipeline Value, Total Deals, Win Rate, and Avg Deal Size.
- 16 analysis charts: Review deal stage, status, industry, region, month, sales rep, lead source, probability, and cumulative won value.
- Interactive slicers: Filter the dashboard quickly and review different regions, reps, stages, industries, lead sources, and periods.
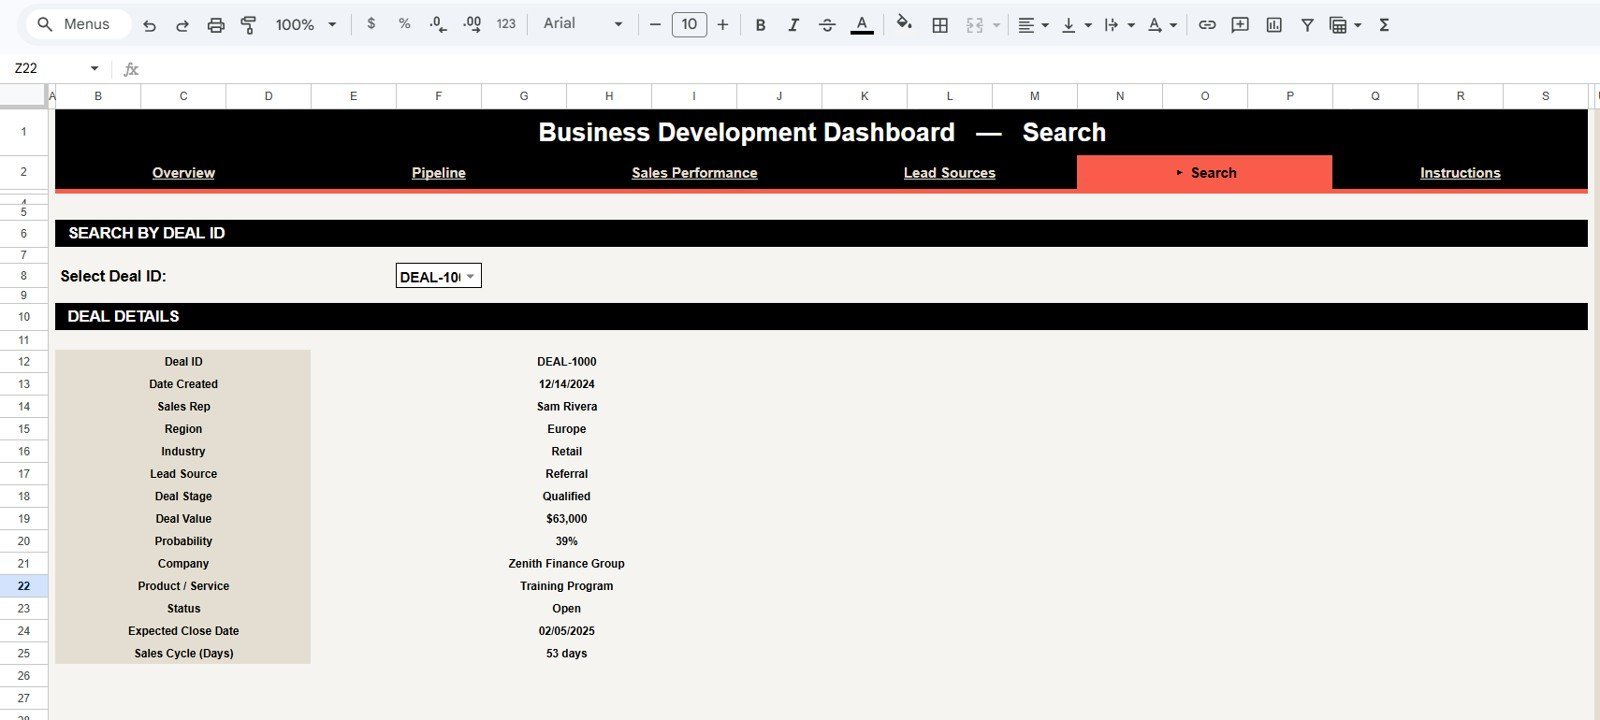
- Deal ID lookup: Use the Search Sheet to select a Deal ID and instantly view the full record details.
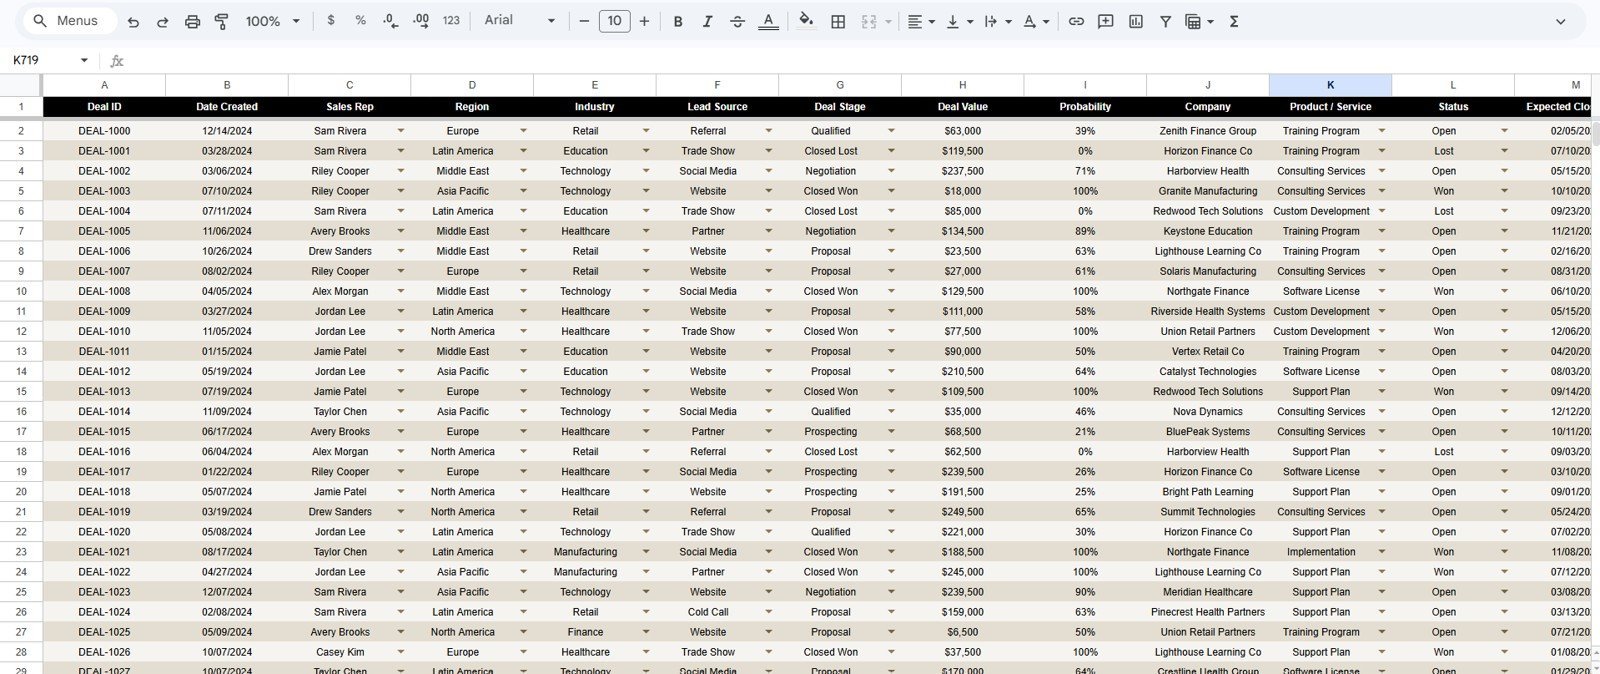
- Editable data sheet: Replace the sample rows with your own pipeline data in the same column format.
What’s Inside the Business Development Performance Dashboard in Google Sheets
1 – Overview Page
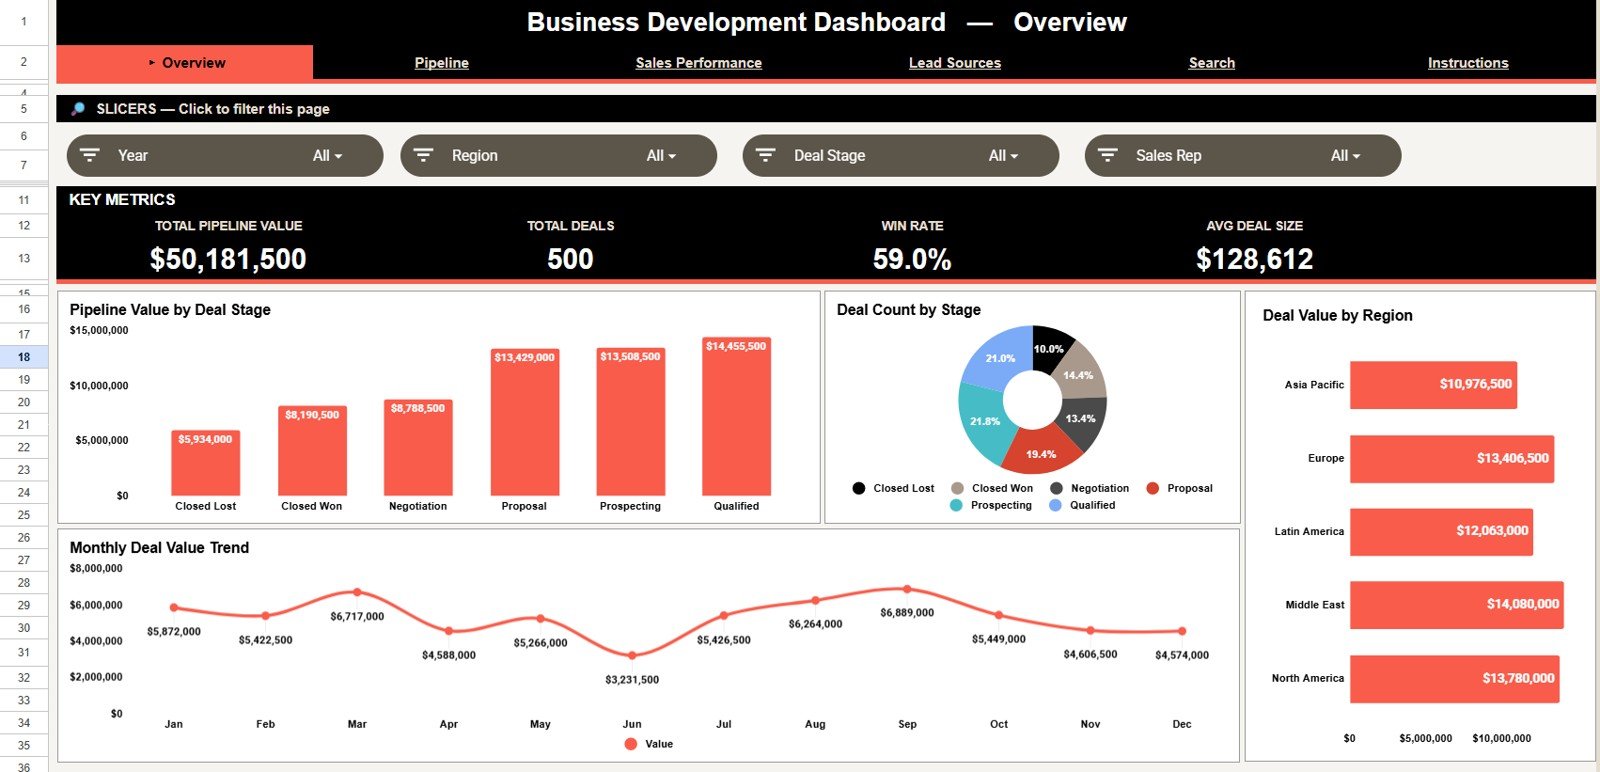
The Overview page gives leadership a quick read on pipeline value, deal volume, win rate, and average deal size. It is designed for weekly sales meetings, business development reviews, and quick executive check-ins.
Pipeline Value by Deal Stage: This chart shows how total open or historical deal value is distributed across each pipeline stage.
It helps managers identify whether value is stuck in early discovery, proposal, negotiation, or closing stages.
Deal Count by Stage: This chart compares the number of deals sitting in each stage.
It helps teams spot bottlenecks when deal count is high but value movement is slow.
Deal Value by Region: This chart compares pipeline value across regions or territories.
It supports regional planning, target review, and territory-level business development decisions.
Deal Value by Month: This trend chart shows how deal value changes month by month.
It helps teams understand seasonality, campaign impact, and pipeline growth over time.
2 – Pipeline
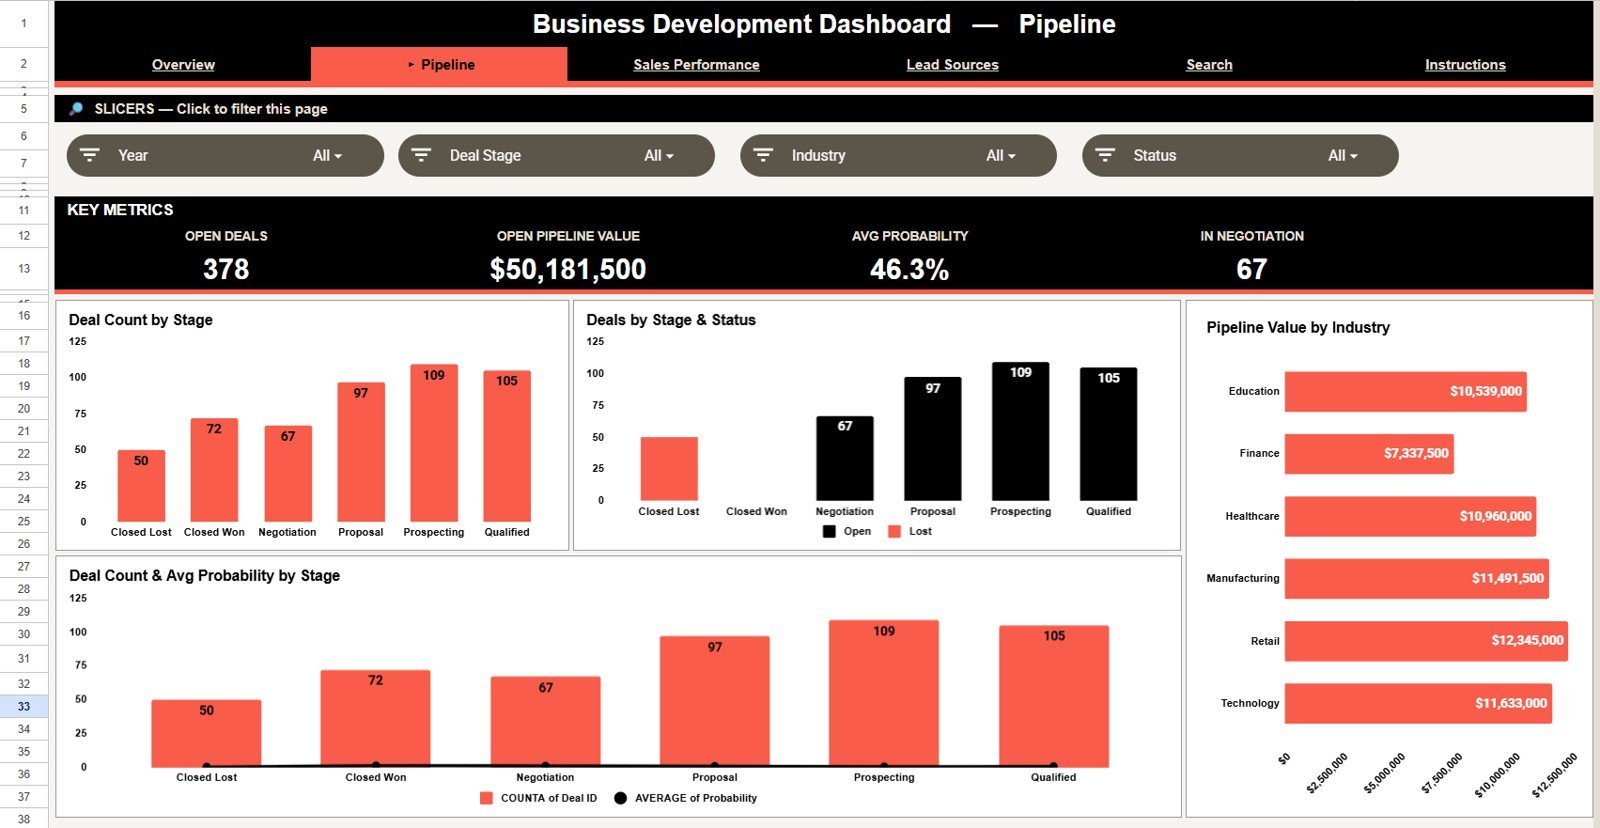
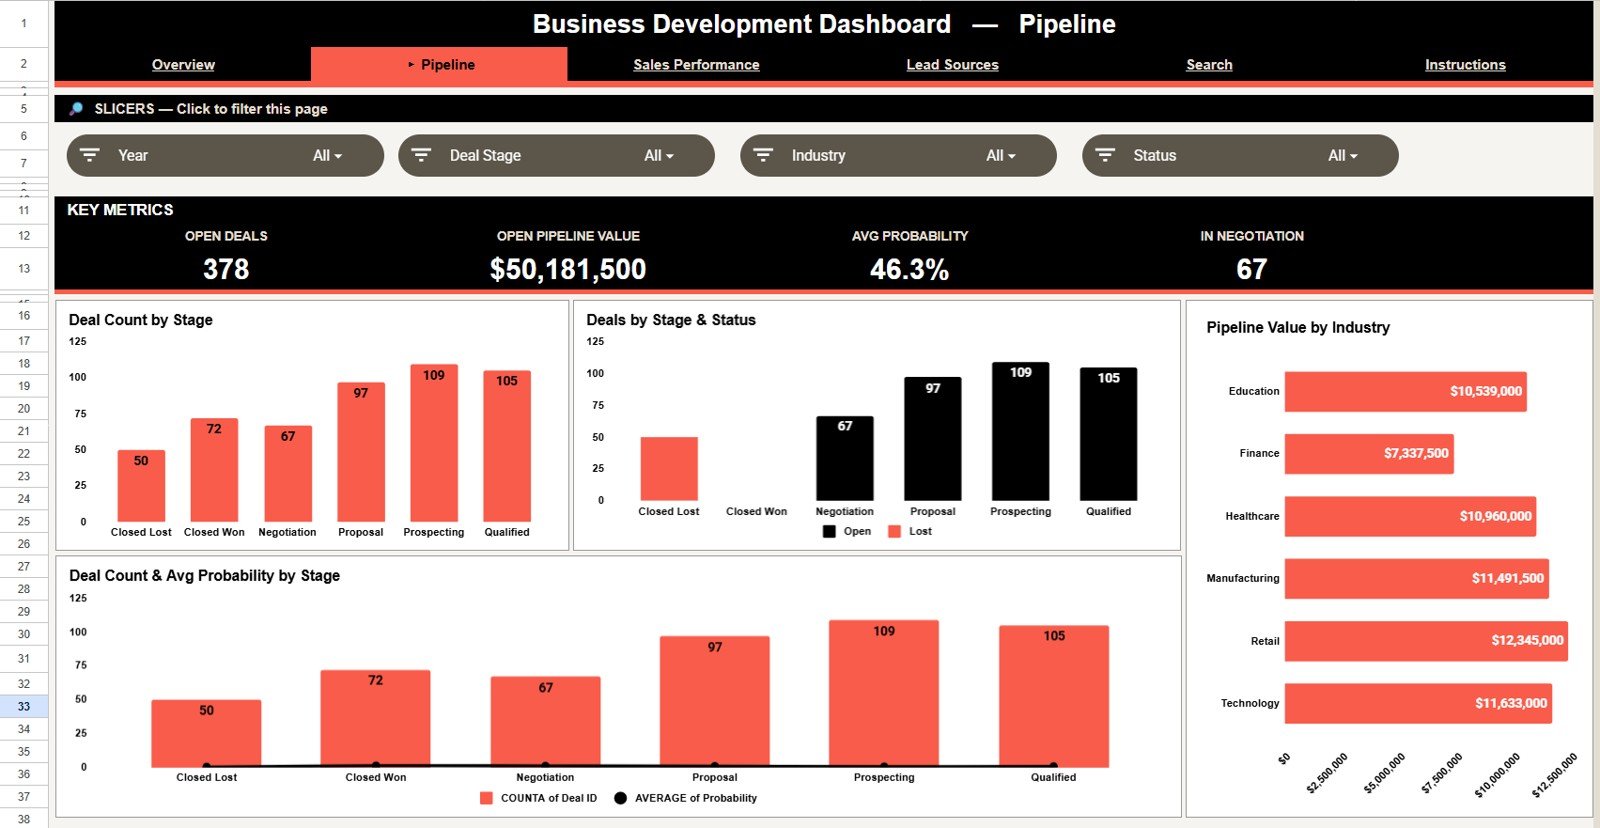
The Pipeline tab focuses on deal movement, current status, industry concentration, and probability by stage. It is useful for managers who want to understand where the pipeline is healthy and where follow-up is needed.
Deal Count by Stage: This chart shows how many opportunities are sitting in each sales stage.
It helps business development teams understand whether the pipeline is balanced or overloaded in one area.
Deal Count by Stage and Status: This chart breaks deal count by both stage and current status.
It helps distinguish active opportunities from won, lost, delayed, or pending deals.
Pipeline Value by Industry: This chart compares total deal value across industries.
It helps teams identify which industries are creating the largest pipeline opportunities.
Deal Count and Avg Probability by Stage: This chart compares stage volume with average probability.
It helps managers see whether high-volume stages also carry enough close probability to justify the forecast.
3 – Sales Performance
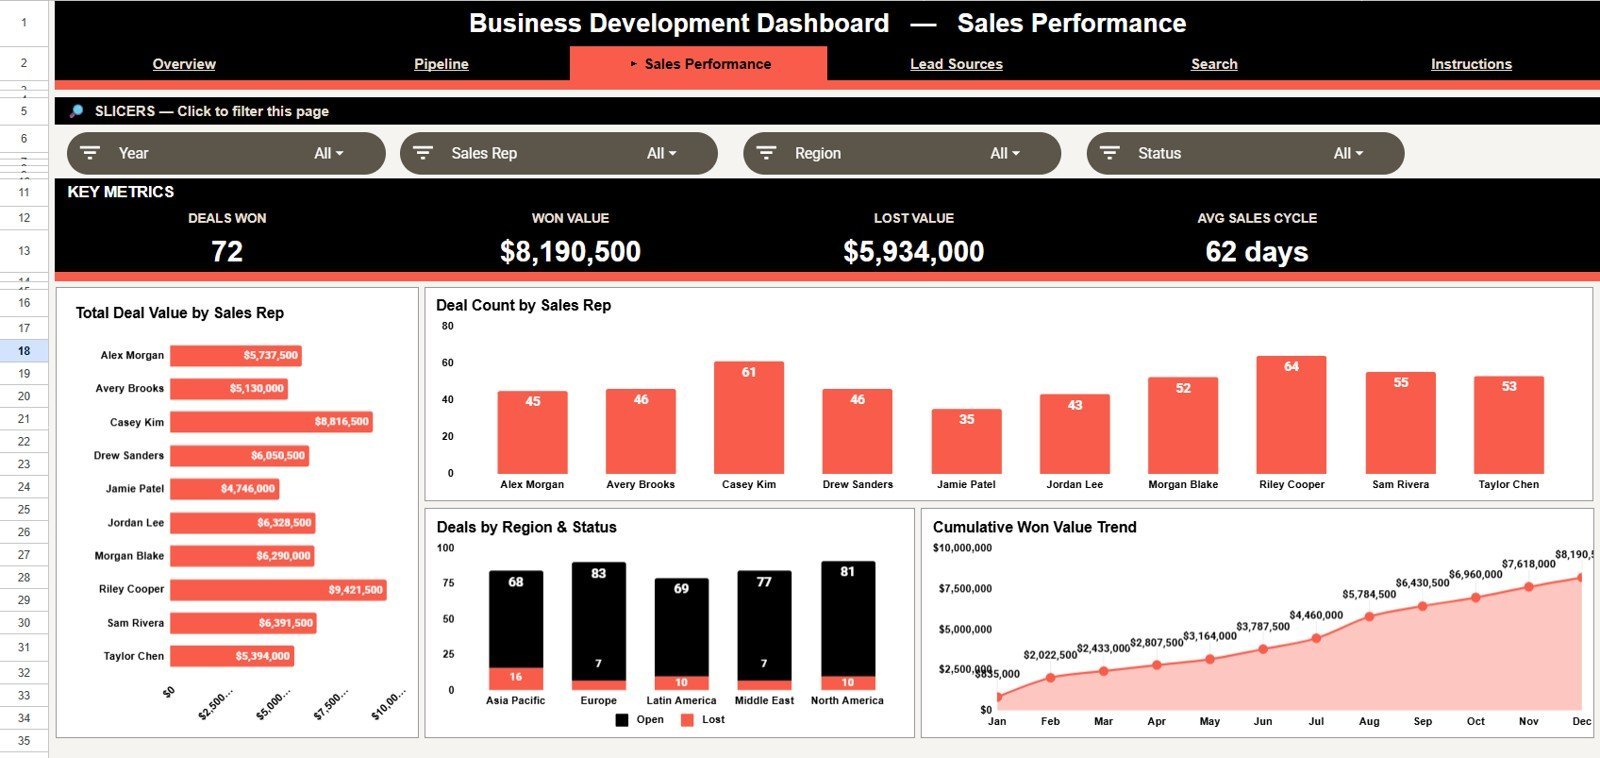
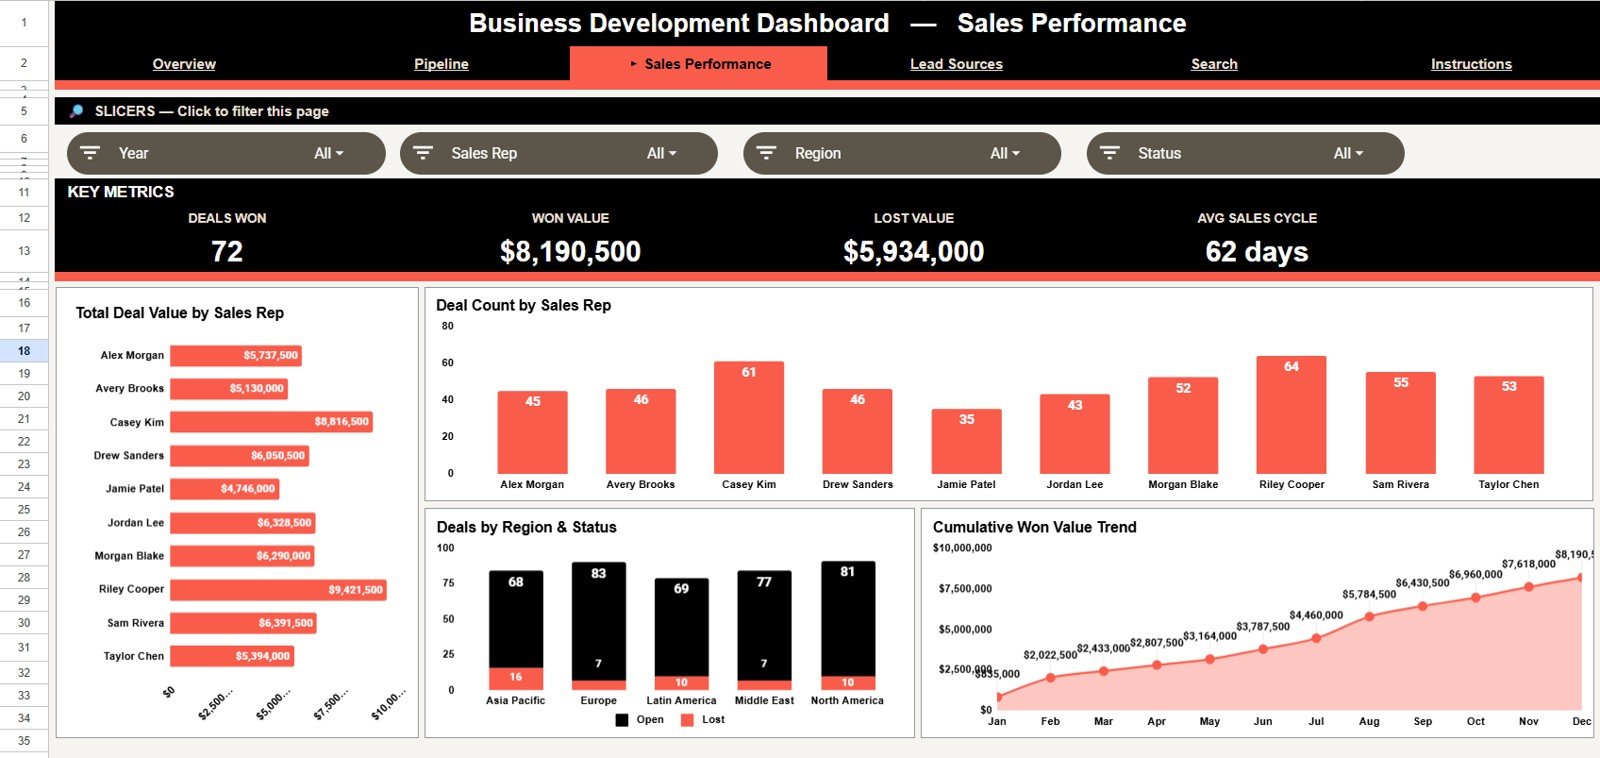
The Sales Performance tab compares reps, regions, statuses, and won value over time. It gives sales leaders a clear view of who is carrying pipeline value and where wins are building.
Total Deal Value by Sales Rep: This chart compares the total value owned by each sales representative.
It helps managers understand rep-level pipeline contribution and workload distribution.
Deal Count by Sales Rep: This chart shows the number of deals assigned to each rep.
It helps review activity volume and compare it with deal value for a balanced performance view.
Deal Count by Region and Status: This chart breaks regional deals into status groups.
It helps leaders see where regions are converting, stalling, or losing opportunities.
Cumulative Won Value by Month: This trend shows won value accumulating across months.
It helps measure progress toward revenue goals and shows when closed-won momentum improves or slows.
4 – Lead Sources
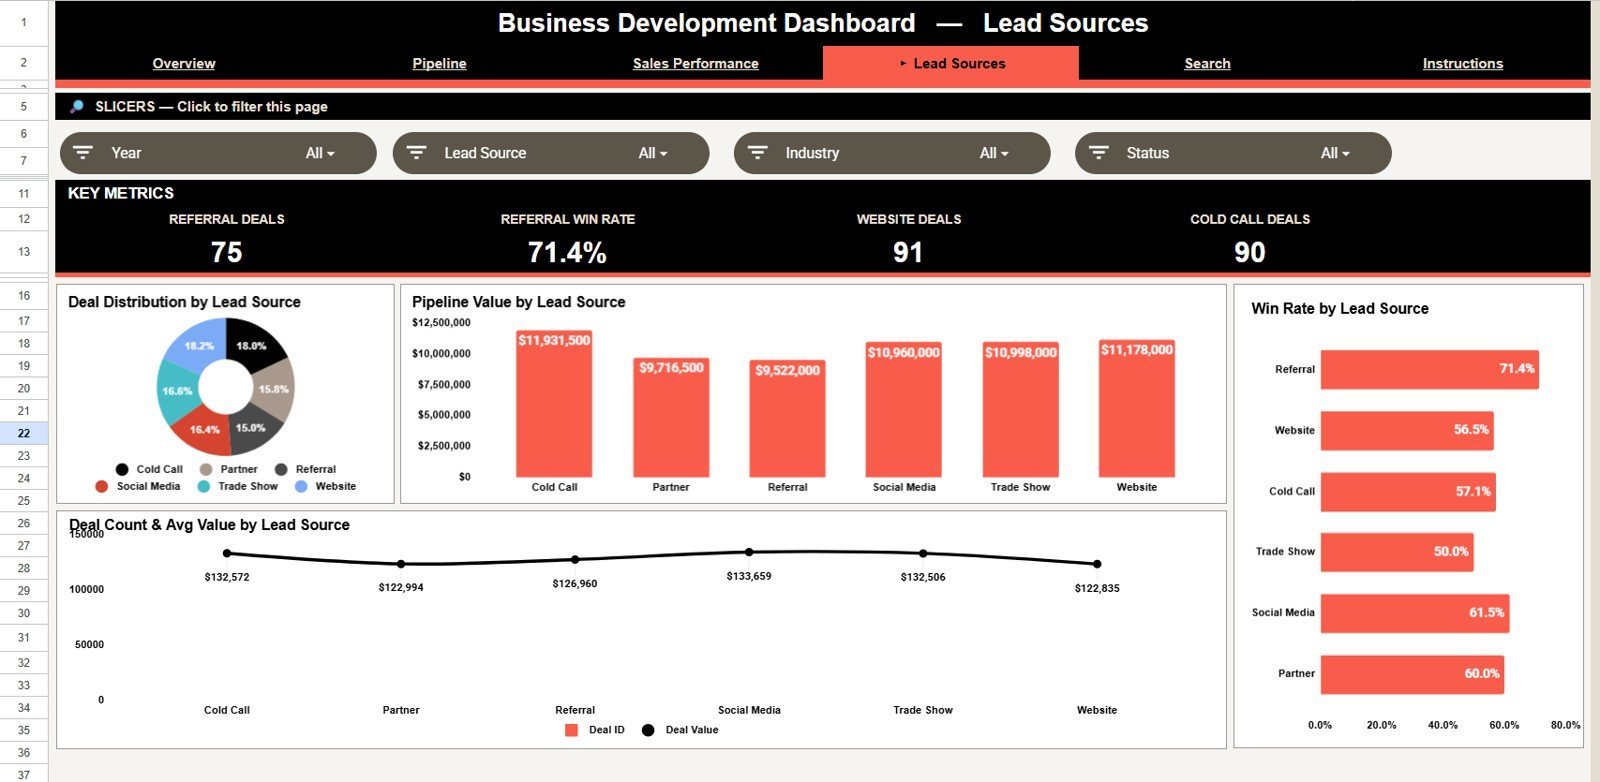
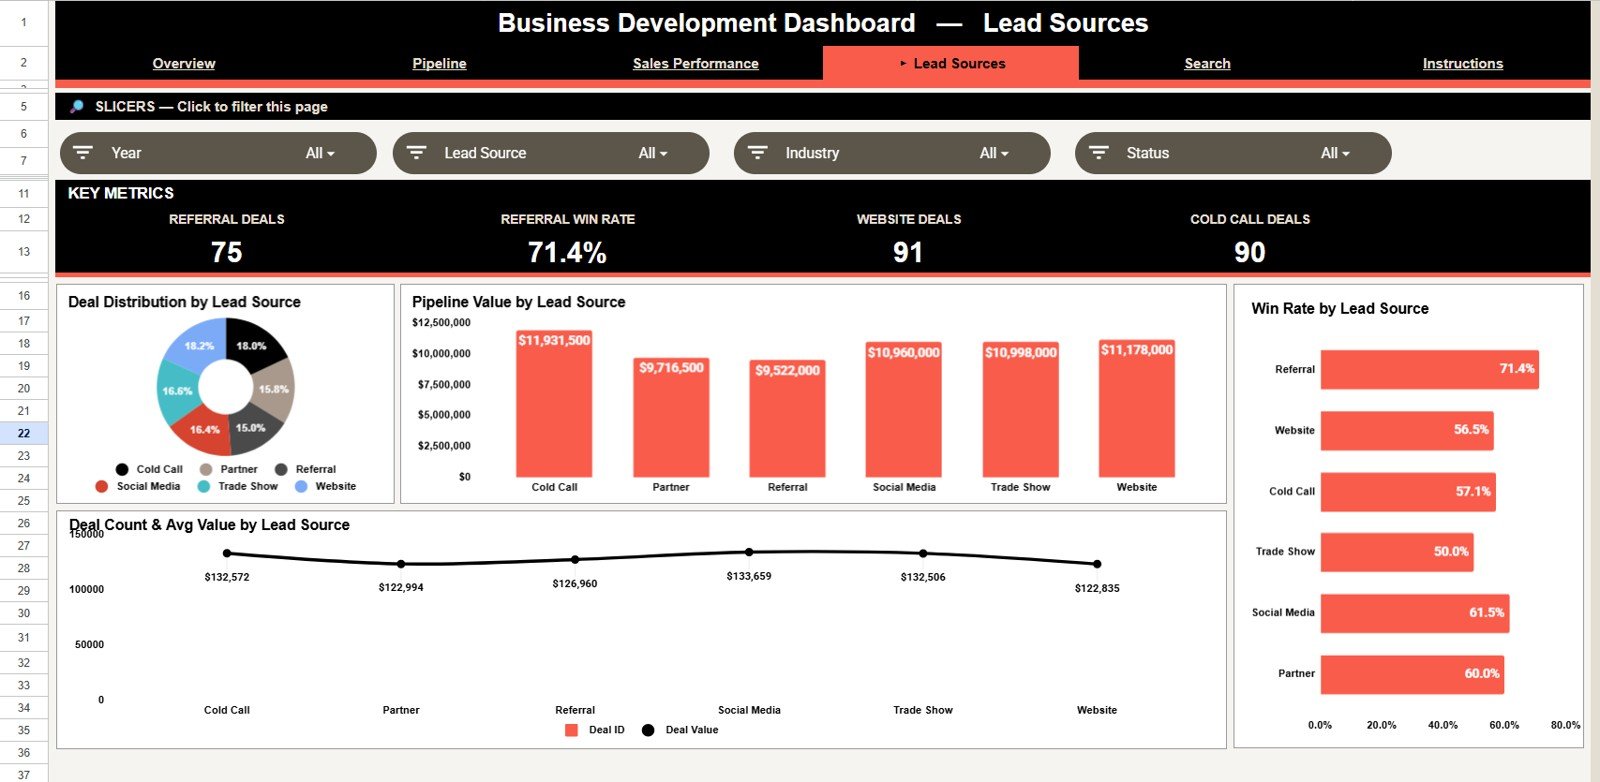
The Lead Sources tab shows which channels are creating deals, value, and wins. It helps marketing and sales teams connect lead generation activity with pipeline quality.
Deal Distribution by Lead Source: This chart shows the share of deals coming from each lead source.
It helps teams see whether opportunities are mostly coming from referrals, campaigns, inbound, outbound, events, or partner activity.
Pipeline Value by Lead Source: This chart compares total deal value by lead source.
It helps identify channels that may produce fewer deals but larger potential revenue.
Win Rate by Lead Source: This chart compares conversion performance across lead sources.
It helps teams invest more attention in channels that generate better-quality opportunities.
Deal Count and Avg Deal Value by Lead Source: This chart combines volume and average deal size by source.
It helps separate high-volume low-value sources from smaller channels that produce larger deals.
5 – Search Sheet Tab
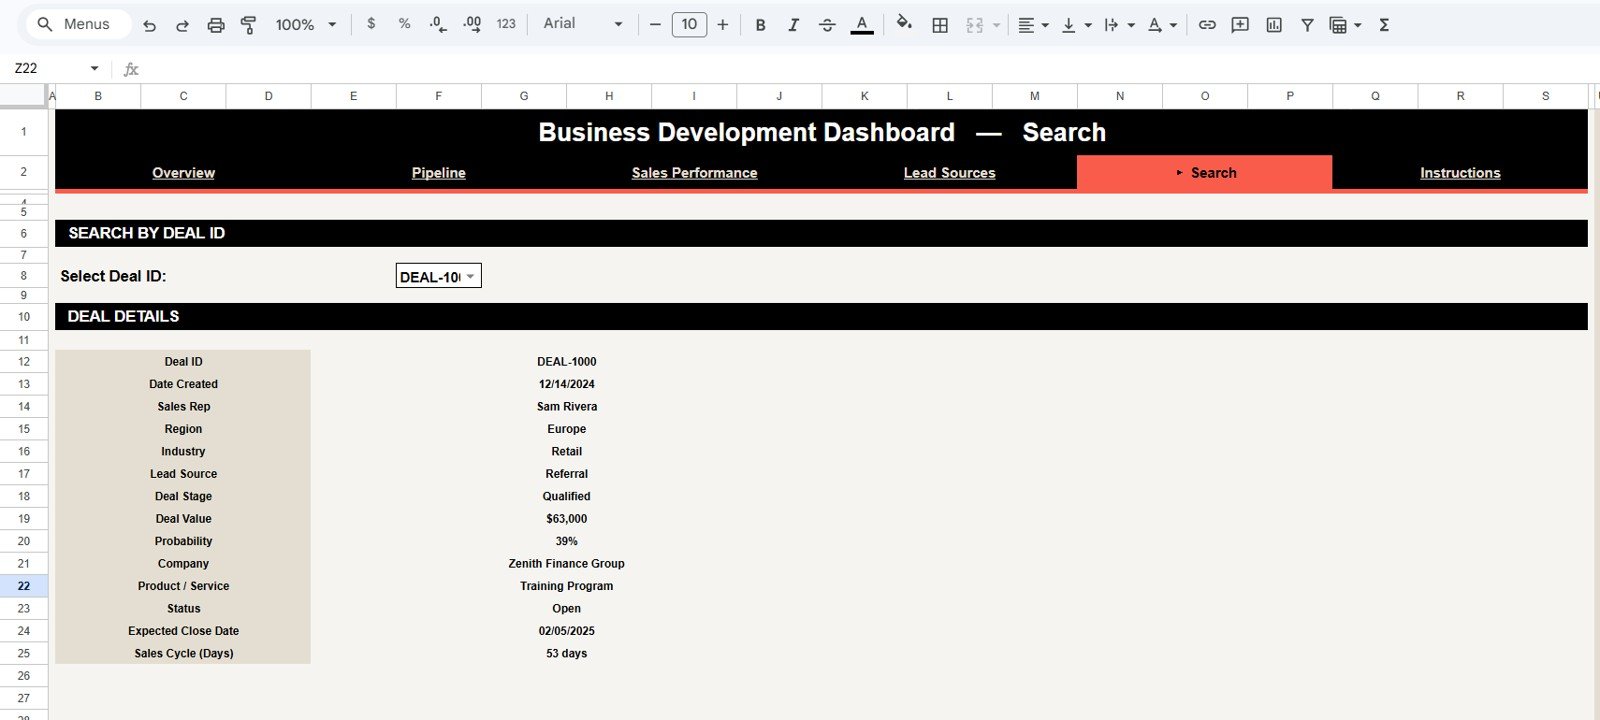
The Search Sheet helps users search by Deal ID and instantly view the selected deal details, including date created, sales rep, region, industry, lead source, deal stage, deal value, probability, company, product or service, status, expected close date, and sales cycle. This is useful during pipeline calls when one deal needs a fast record-level review.
6 – Data Sheet Tab
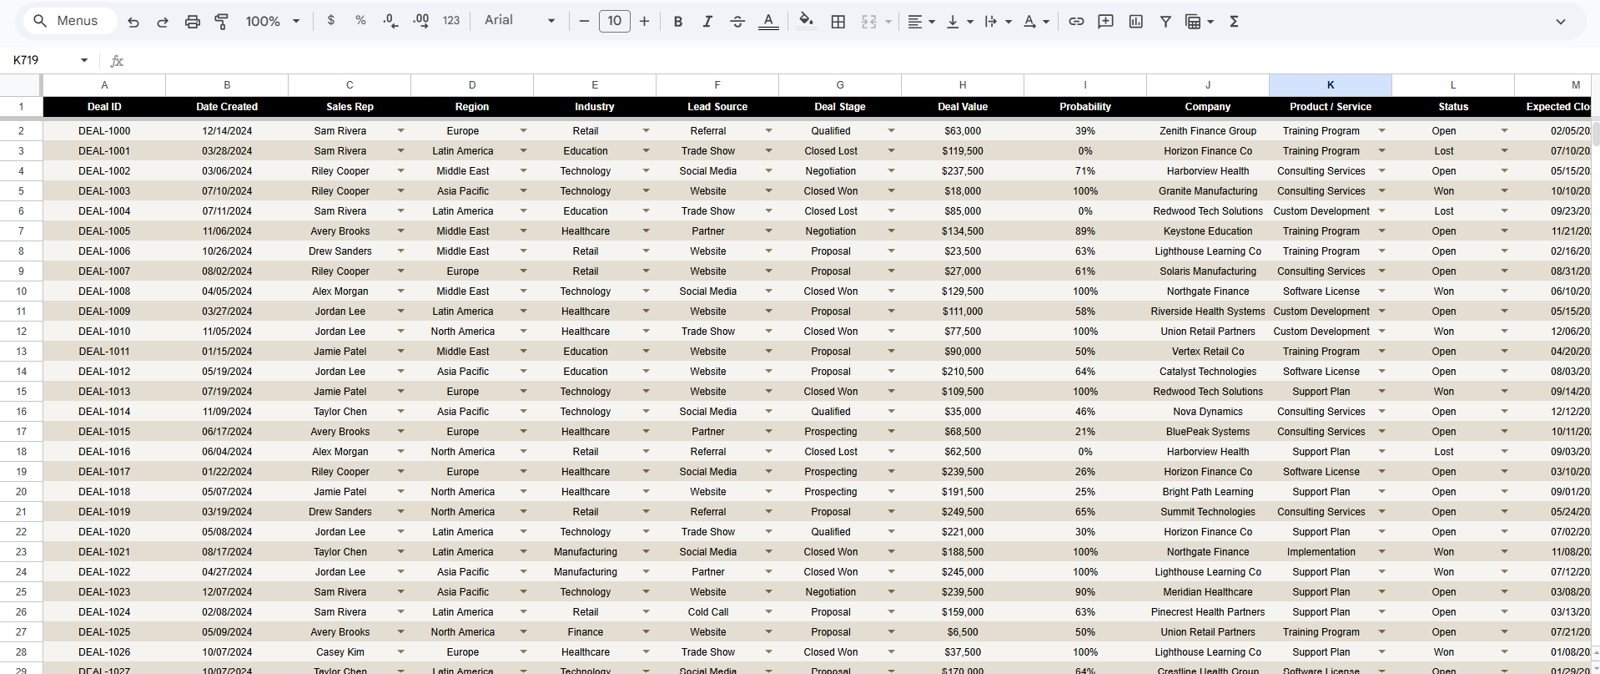
The Data Sheet is where you add and maintain your business development pipeline records. Enter new rows in the same format as the sample data, keep the columns consistent, and the dashboard pages can continue using the same structure for analysis.
Business Development Performance Dashboard in Google Sheets vs. Microsoft Excel Dashboard vs. Paid CRM/SaaS – Where This Fits
| Feature | This Google Sheets dashboard | Microsoft Excel dashboard | Paid CRM or sales SaaS |
|---|---|---|---|
| Cost | $9.99 sale price, one-time | Template cost plus Excel license if needed | Monthly or annual subscription |
| Platform | Google Sheets in browser | Excel desktop or Microsoft 365 | Vendor-hosted CRM platform |
| Setup time | Copy the sheet and replace sample data | Open workbook and refresh or rebuild | Implementation, configuration, and onboarding |
| Real-time team collaboration | Built into Google Drive sharing | Requires OneDrive or SharePoint | Usually included by plan |
| Mobile access | Available through Google Sheets app or browser | Available through Microsoft apps | Usually included |
| Customizable fields | Editable columns, formulas, labels, and charts | Editable workbook | Limited by admin permissions and plan |
| Share with link | Yes, using Google Drive permissions | Possible through Microsoft cloud | Role-based user accounts |
| Year-1 cost at 5 users | $9.99 plus Google Workspace if applicable | Template cost plus Microsoft licensing | Often hundreds or thousands |
| Pipeline dashboard fit | Best for structured spreadsheet-based pipeline reporting | Best for offline Excel workflows | Best for live CRM workflows and automation |
Who This Template Is For – and Who It’s Not For
This template is for business development managers, sales managers, founders, account executives, consultants, and marketing teams that need a clean pipeline dashboard in Google Sheets. It works well when your team tracks deals in a spreadsheet or exports pipeline records from another tool.
It is not a full CRM, email automation system, quote builder, proposal tool, or commission management platform. If you need live contact history, automated reminders, pipeline activities, and sales sequences, a CRM such as HubSpot, Salesforce, or Pipedrive may be a better primary system.
How to Use the Business Development Performance Dashboard in Google Sheets
- Open the PDF guide included with your purchase and use the Google Sheets copy link.
- Create your own editable copy in Google Drive.
- Go to the Data Sheet and replace the sample pipeline rows with your own data.
- Keep the same columns for Deal ID, date, sales rep, region, industry, lead source, deal stage, value, probability, company, product or service, status, expected close date, and sales cycle.
- Use slicers to filter the Overview, Pipeline, Sales Performance, and Lead Sources tabs.
- Use the Search Sheet to look up one deal by Deal ID during pipeline reviews.
Real-World Use Cases
Anita, business development manager: reviews Total Pipeline Value, Win Rate, and Pipeline Value by Deal Stage before her Monday sales meeting.
Rahul, founder of a B2B services firm: uses the Lead Sources tab to decide which acquisition channels deserve more budget next month.
Melissa, sales operations consultant: copies the template for clients and uses the Data Sheet structure to standardize exported pipeline records.
Frequently Asked Questions
What does this dashboard track?
It tracks pipeline value, total deals, win rate, average deal size, deal stages, status, industry, region, month, sales rep, lead source, probability, won value, and deal-level details.
Can I use this without paid software?
Yes. It is built for Google Sheets. You only need access to Google Sheets and the pipeline data you want to enter or paste into the Data Sheet.
Can I customize the fields?
Yes. You can edit labels, formulas, charts, slicers, and fields, but keep a backup copy before changing the data structure.
Does it replace a CRM?
No. It is a reporting dashboard and spreadsheet template, not a CRM with activities, contact history, email automation, or permissions workflows.
How does the Search Sheet work?
The Search Sheet is designed to select or search a Deal ID and display the matching record details in a clean lookup view.
Can multiple users work on it?
Yes. Because it runs in Google Sheets, you can share the copied file with approved users through Google Drive permissions.
About the Author
Built by PK – Microsoft Certified Professional with 15+ years of Excel, Google Sheets, and Power BI experience. Founder of NextGenTemplates, reaching 300K+ subscribers across YouTube channels. Every template is hand-built and tested before release.
Explore Related Templates
You may also like the Public Relations (PR) Dashboard in Google Sheets, Lead Tracker Data Entry System in Excel, MarTech Dashboard in Excel, and Lead Nurturing KPI Dashboard in Google Sheets. Browse more Google Sheets templates and Google Sheets dashboard templates.
Ready to review business development performance in Google Sheets? Download the Business Development Performance Dashboard in Google Sheets, replace the sample data, and start tracking pipeline value, reps, regions, lead sources, stages, and win rate in one place.
Watch the step-by-step video Demo:
Last updated: July 7, 2026.































Reviews
There are no reviews yet.