

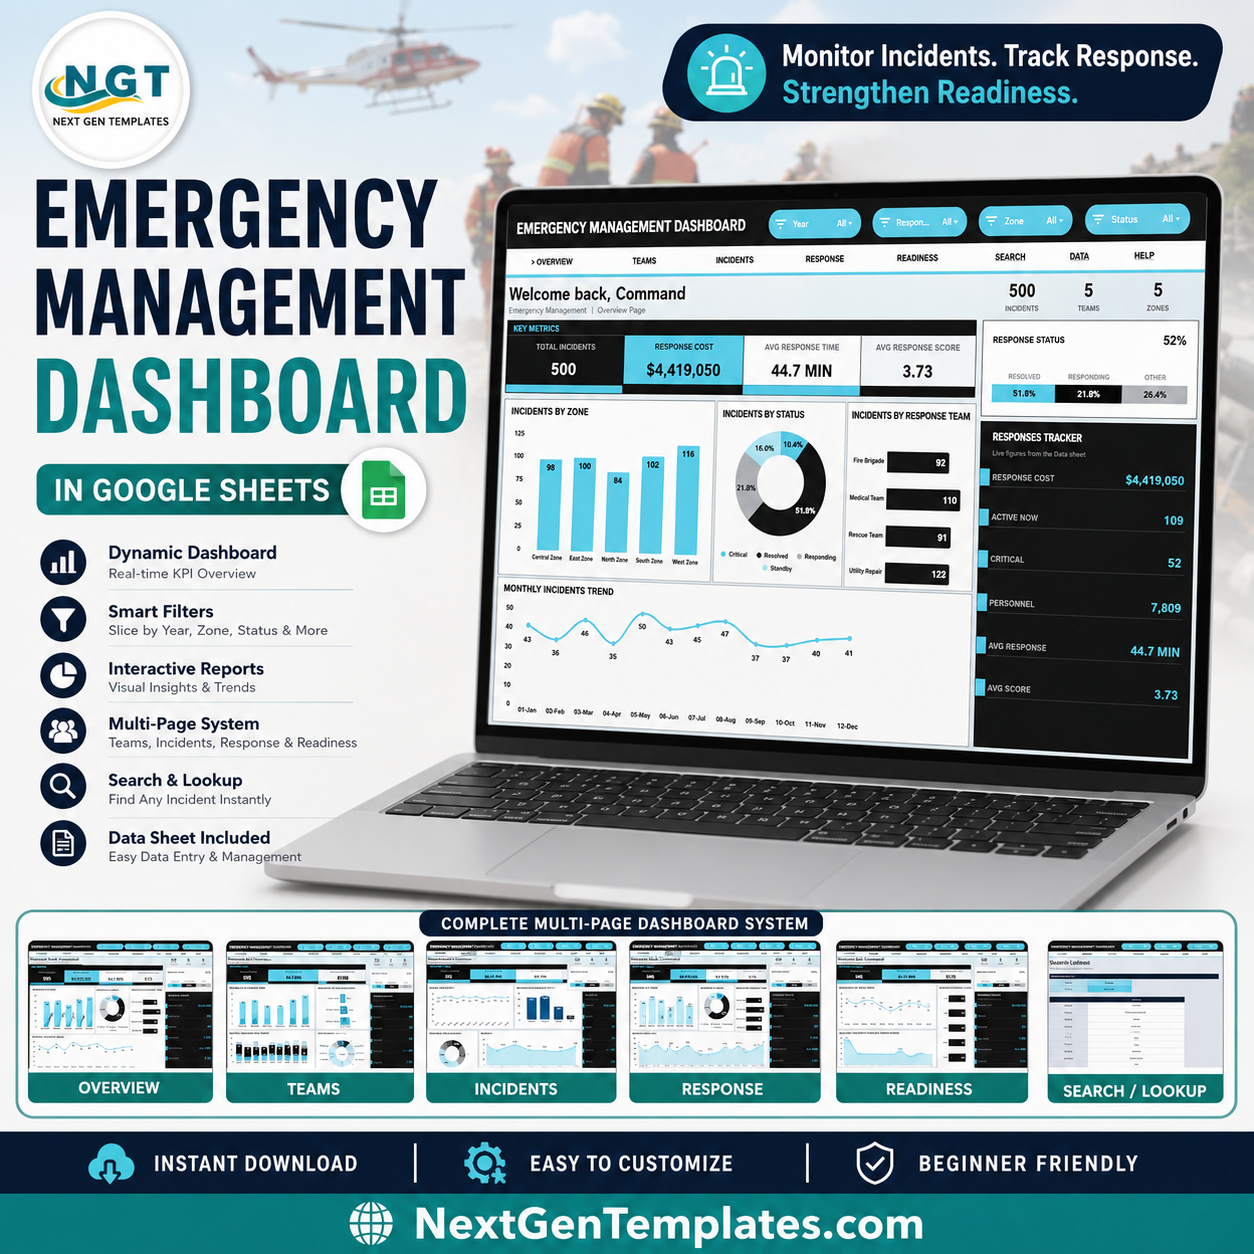

Emergency Management Dashboard in Google Sheets helps response coordinators turn incident records into seven ready-to-use tabs for cost, status, teams, response time, personnel, and response score review. NOAA NCEI tracks 403 U.S. billion-dollar weather and climate disasters from 1980-2024, a useful reminder that incident reporting needs to be organized before the review meeting starts. Built by PK for a 300K+ subscriber learning audience, this one-time $9.99 template gives you an editable Google Sheets structure without a recurring emergency-management software subscription.
Key Features of Emergency Management Dashboard in Google Sheets
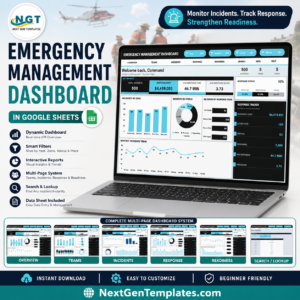
- Seven Google Sheets tabs: Overview, Team Performance, Incident Analysis, Response and Cost, Force Readiness, Search Sheet, and Data Sheet.
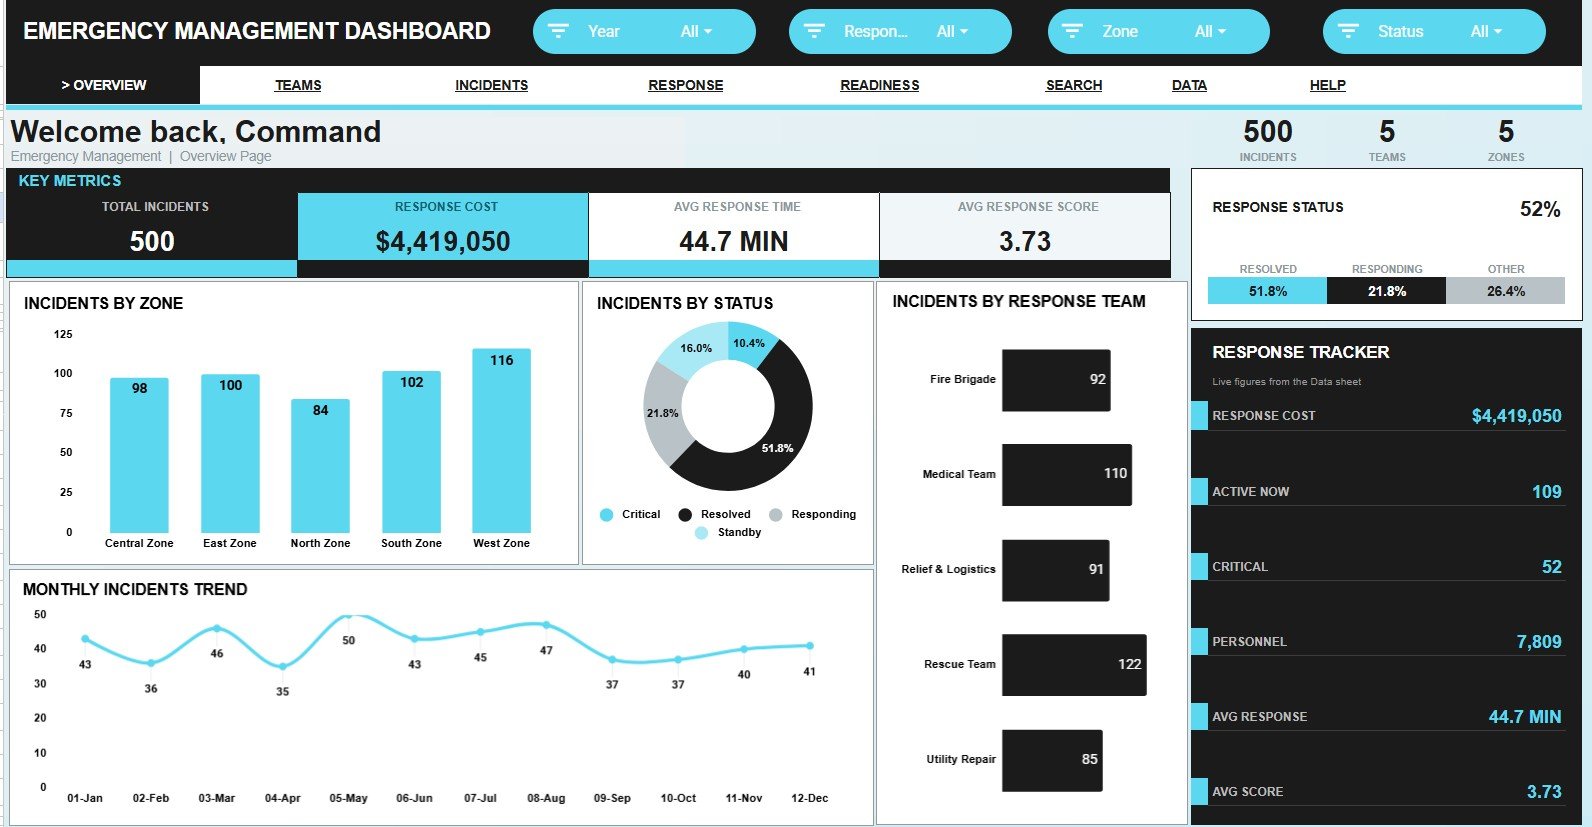
- Four headline cards: Total Incidents, Response Cost, Avg Response Time, and Avg Response Score.
- Multiple slicers: Filter charts and cards quickly by the available incident fields during reviews.
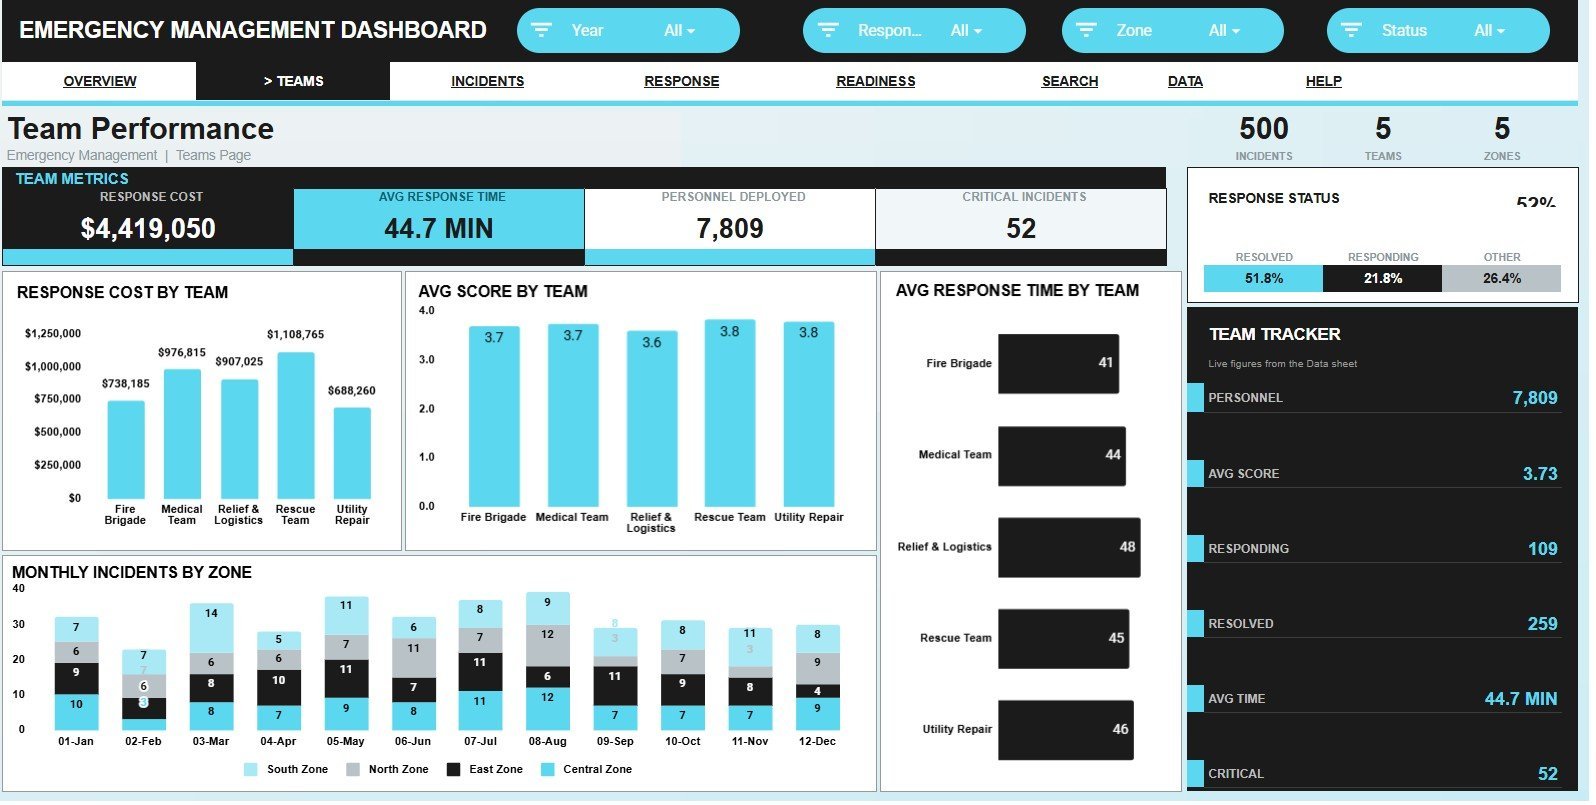
- Team performance views: Compare response cost, average score, average response time, and monthly incidents by zone.
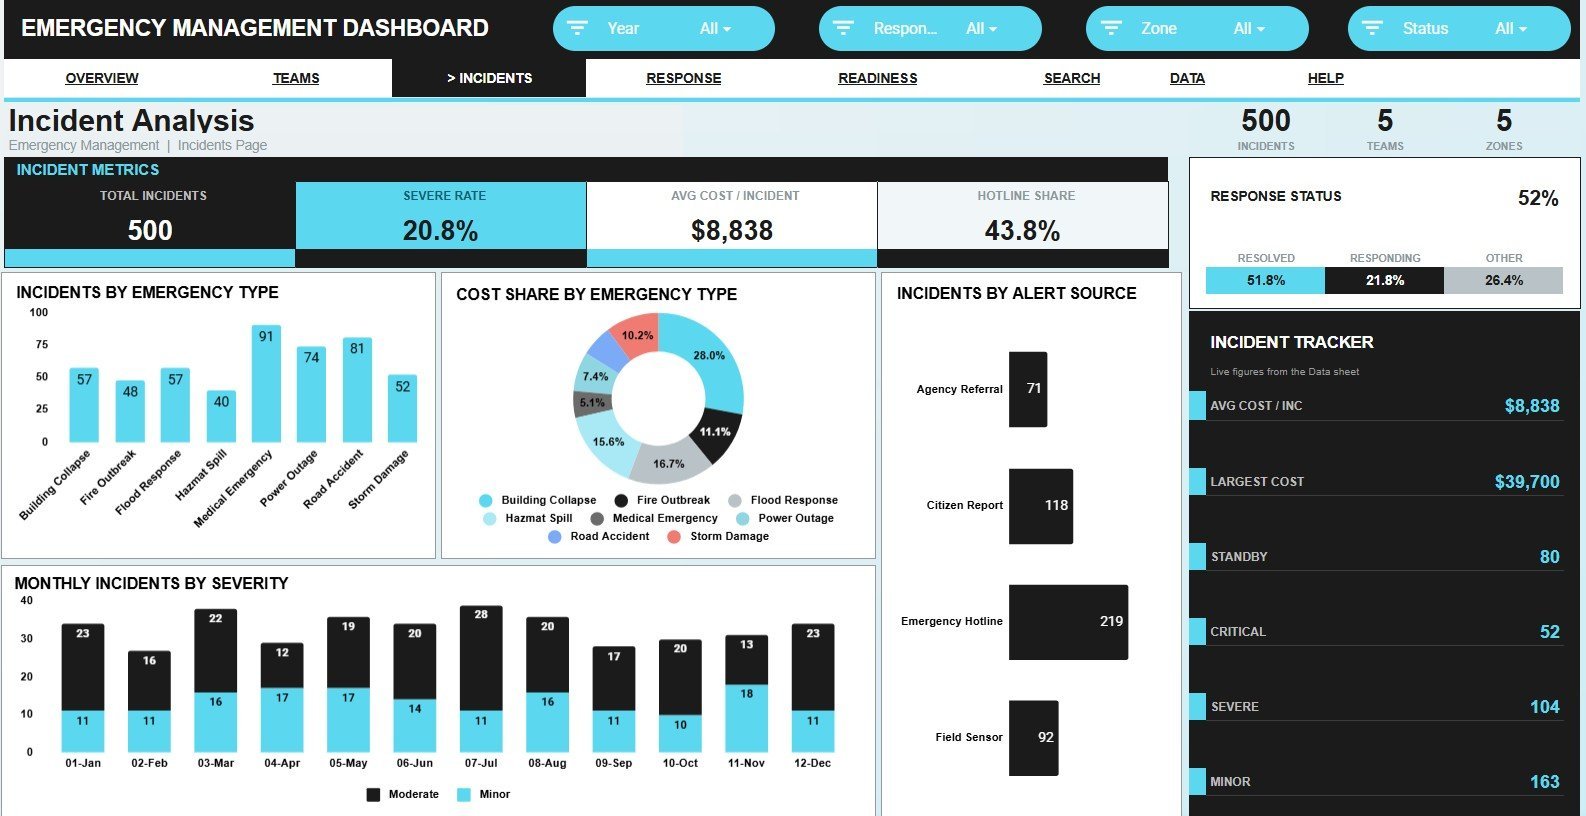
- Incident analysis: Review emergency type, alert source, severity, and response status patterns.
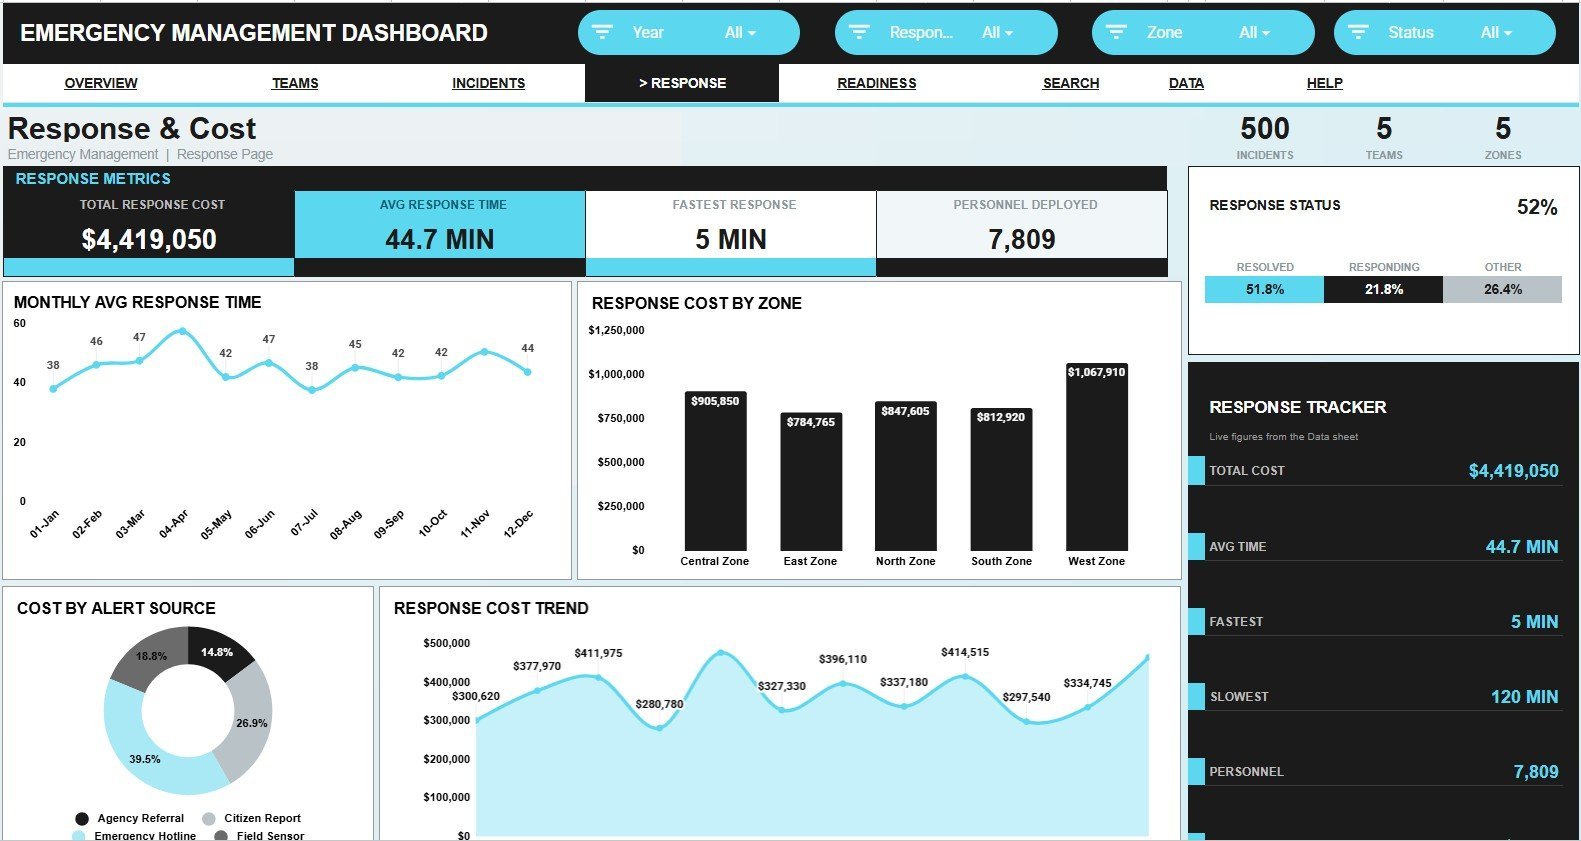
- Response and cost tracking: Analyze monthly response time, cost by zone, cost by alert source, and cost by month.
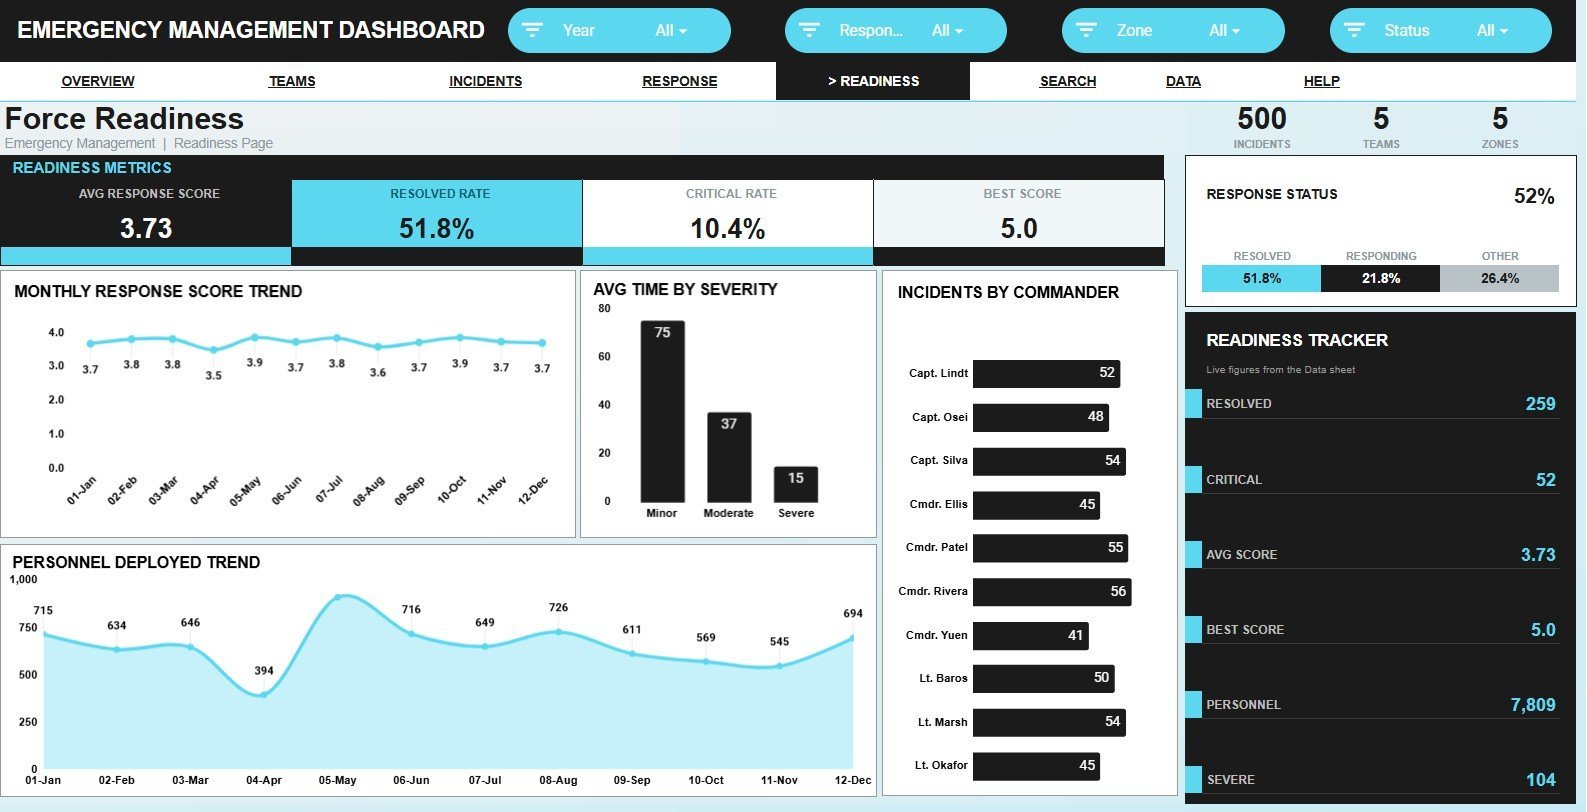
- Force readiness page: Monitor response score, severity time, commander workload, and personnel deployment.
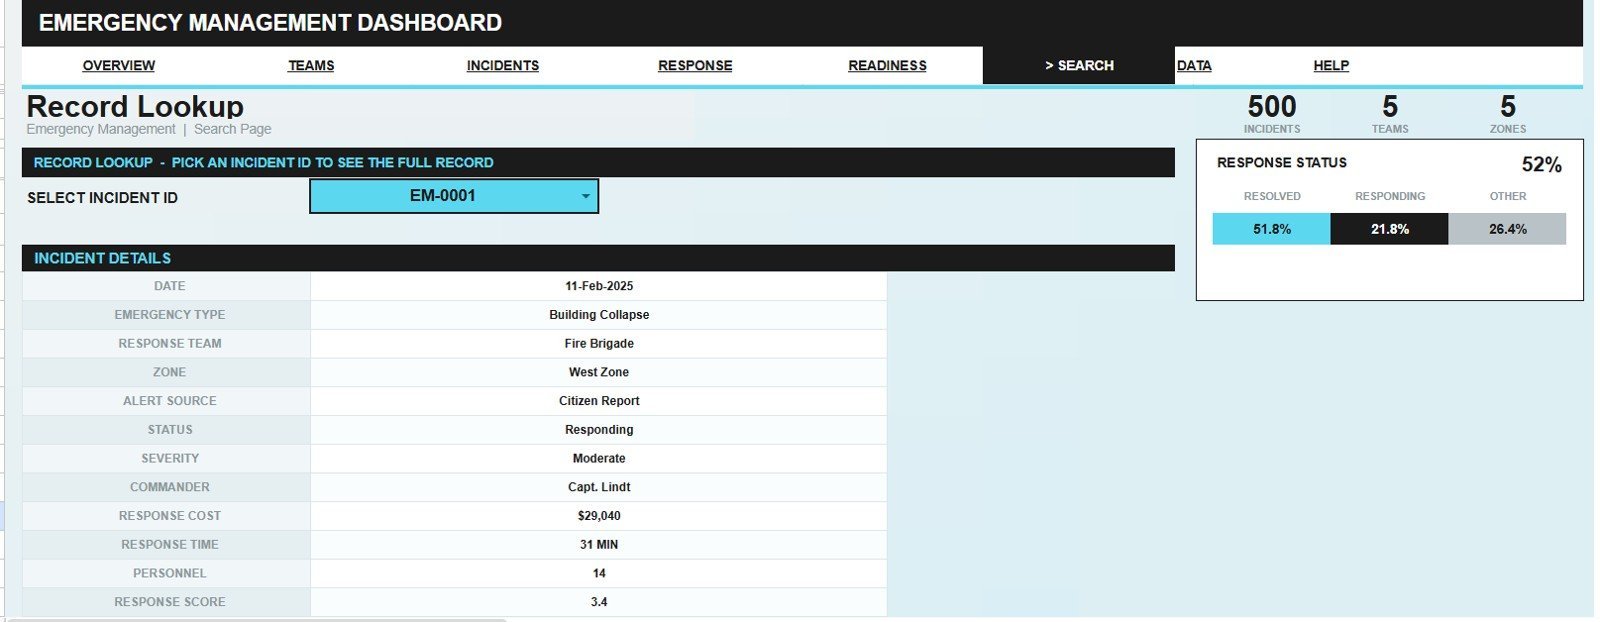
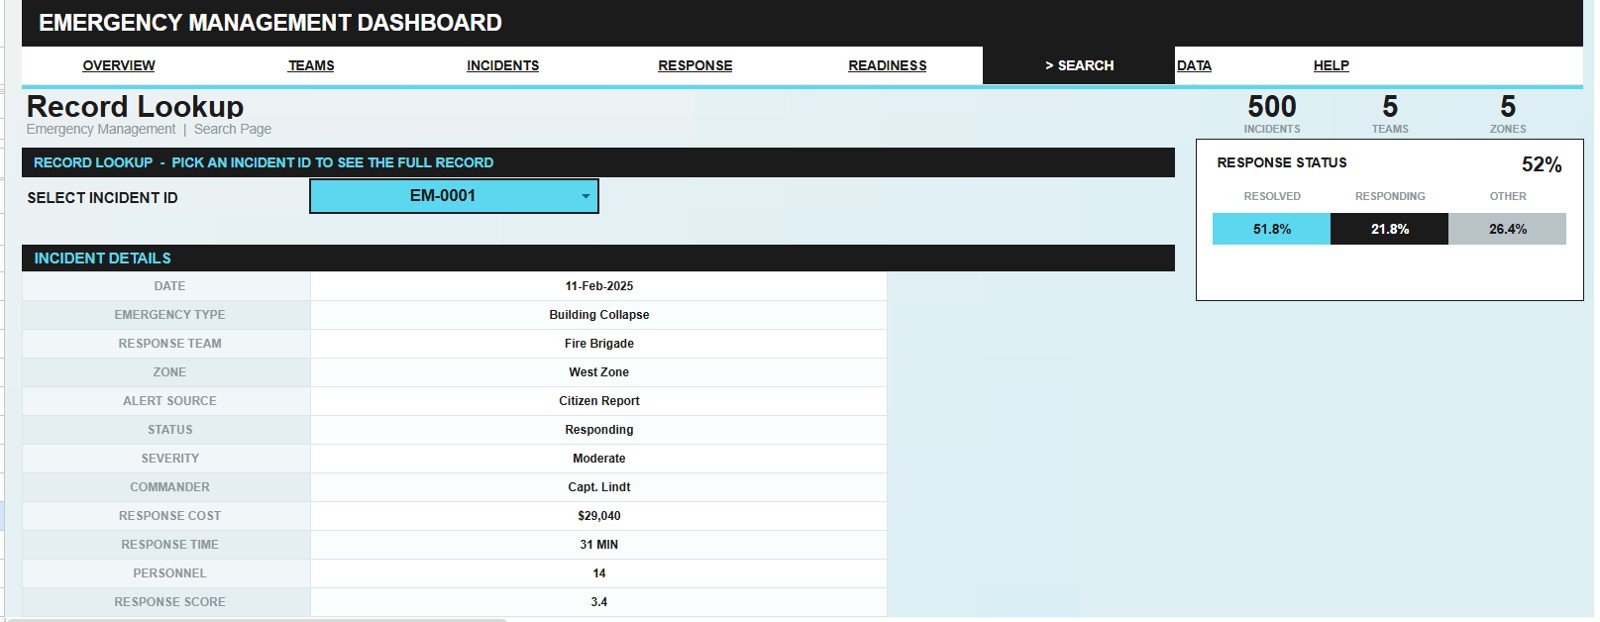
- Incident ID search: Select one incident and view the full record details in one place.
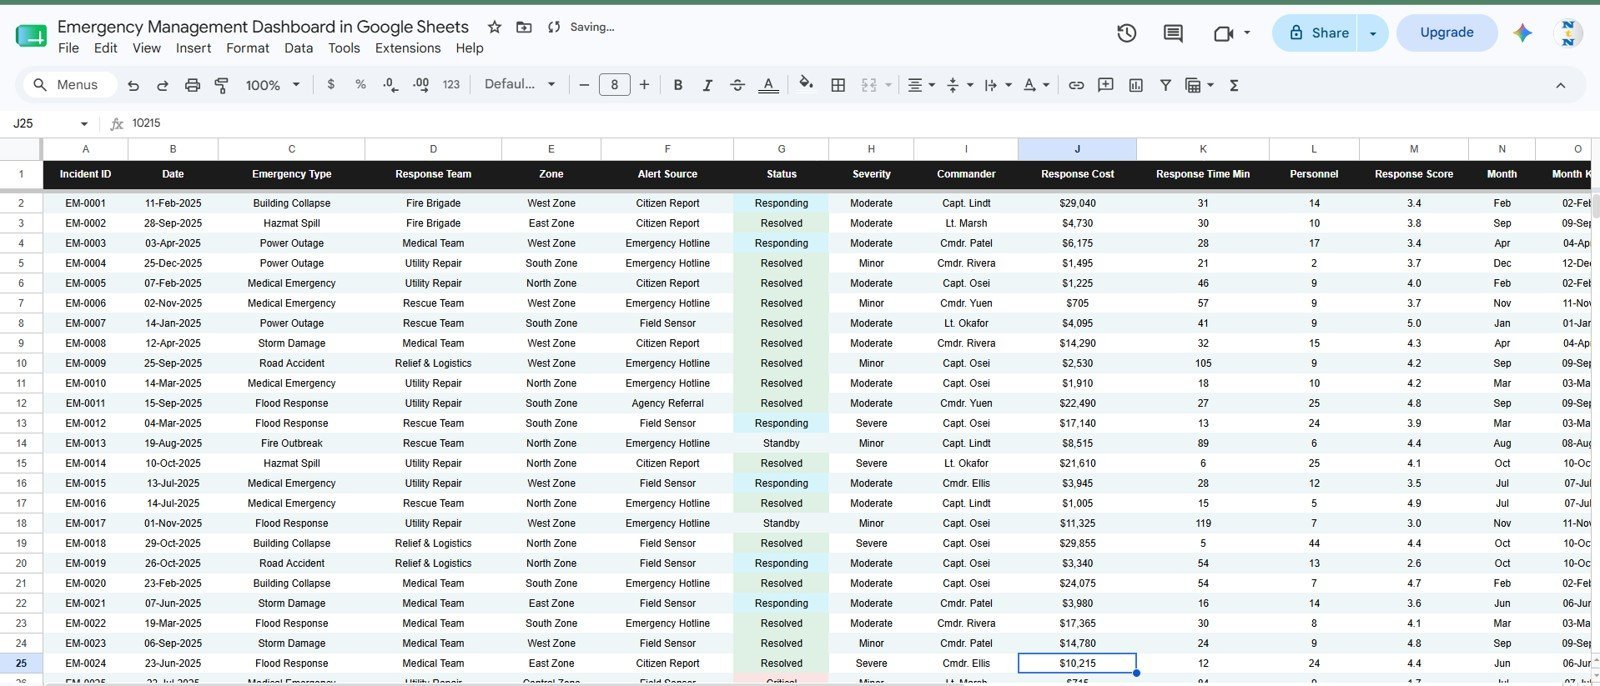
- Editable data sheet: Replace the sample rows in the same format and keep the dashboard connected.
What’s Inside the Emergency Management Dashboard in Google Sheets
1 – Overview Page
The Overview page gives leaders a fast incident snapshot using Total Incidents, Response Cost, Avg Response Time, and Avg Response Score cards. Slicers make it easier to isolate zones, teams, emergency types, alert sources, statuses, or months without rebuilding the dashboard.
Incidents by Zone: This chart shows where incidents are concentrated. It helps command teams compare risk, workload, and coverage pressure by operating zone.
Incidents by Status: This chart separates records by current status. It helps teams see how many incidents are open, closed, pending, escalated, or otherwise unresolved.
Incidents by Response Team: This chart compares incident volume by team. It helps supervisors understand workload balance and where support may be needed.
Monthly Incidents by Month: This chart tracks incident volume across the year. It helps reveal seasonal demand, operational peaks, and quieter periods.
Response Status by Status: This chart summarizes response-stage completion. It helps users monitor closure discipline and response workflow health.
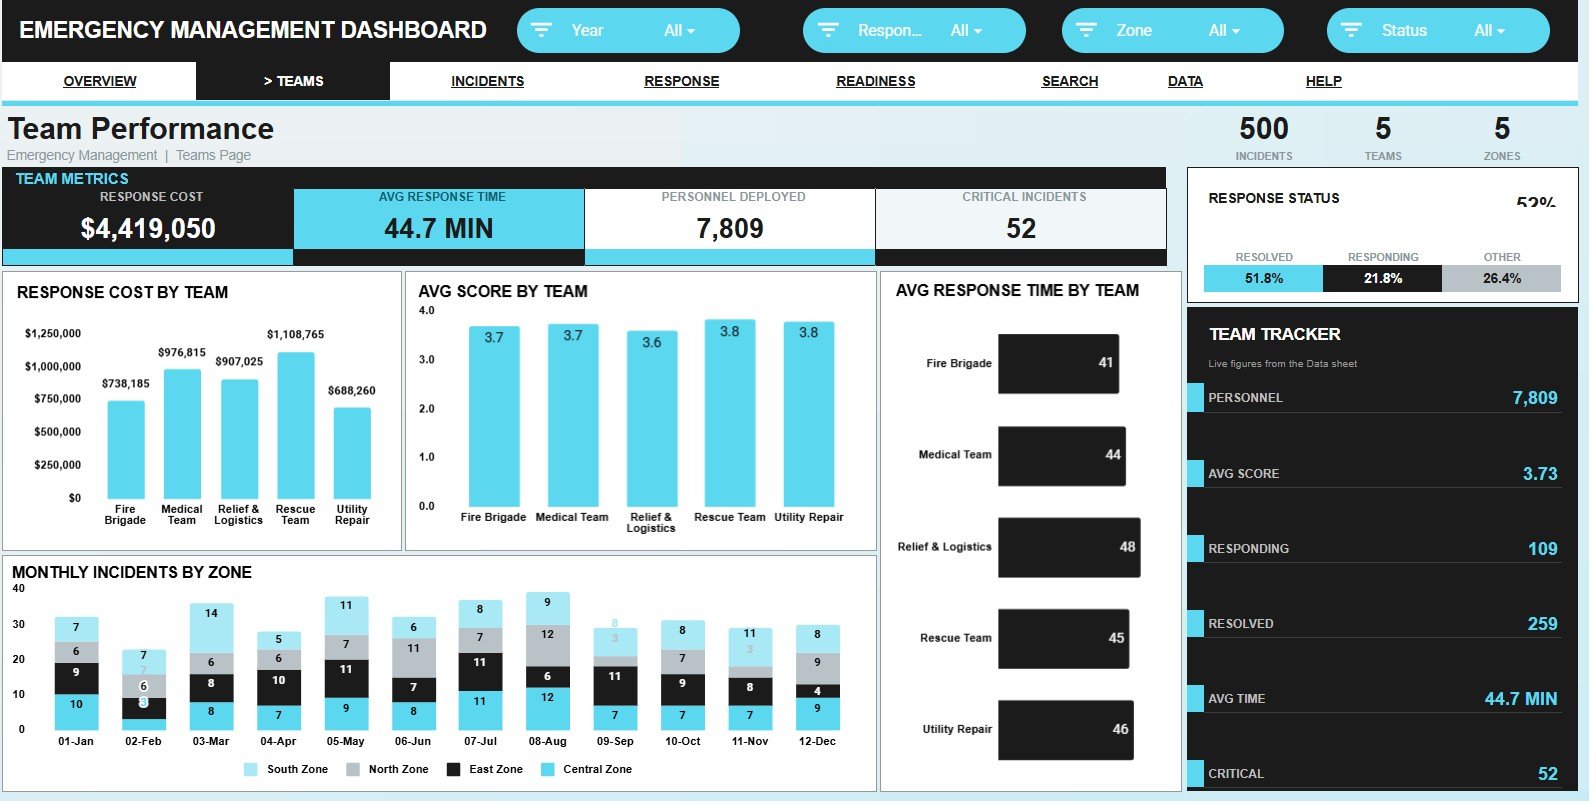
2 – Team Performance
This sheet focuses on how response teams perform across cost, score, response time, zone demand, and response status.
Response Cost by Team: This chart compares cost by response team. It helps identify teams with higher incident expense and where budget review may be needed.
Avg Score by Team: This chart compares average response score across teams. It helps managers spot strong performers and teams needing process review.
Avg Response Time by Team: This chart shows response speed by team. It helps explain whether delays are tied to workload, geography, staffing, or process gaps.
Monthly Incidents by Zone: This chart combines month and zone analysis. It helps users see whether demand is shifting across locations over time.
Response Status by Status: This chart keeps response closure visible on the team page. It helps teams track operational follow-through while reviewing performance.
3 – Incident Analysis
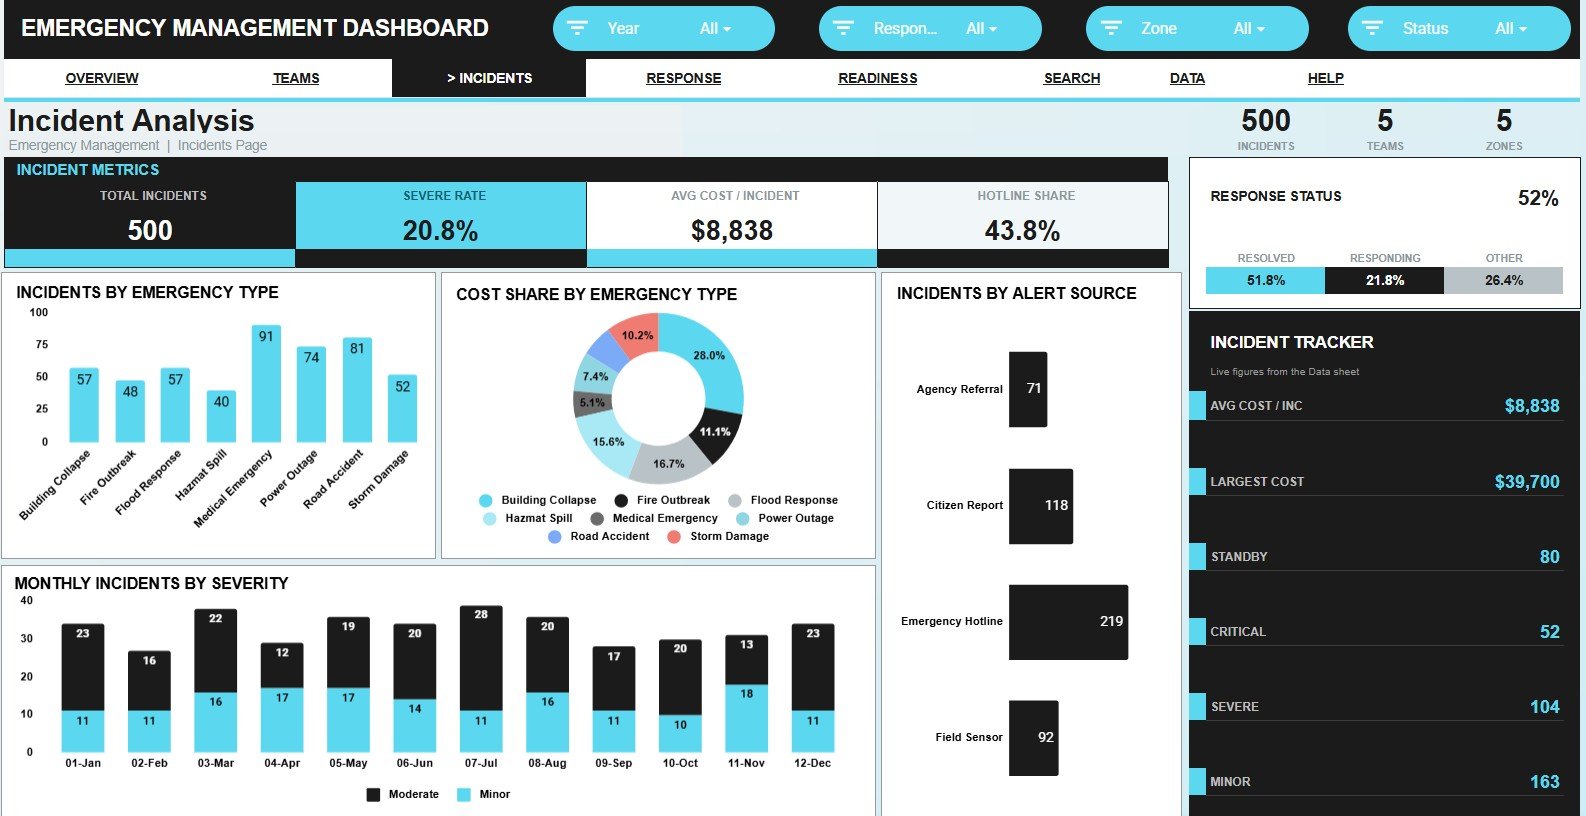
This tab explains the type, cost, source, severity, and status profile of emergency incidents.
Incidents by Emergency Type: This chart counts incidents by emergency type. It helps teams understand which emergency categories are driving the most work.
Cost Share by Emergency Type: This chart shows which emergency types consume the largest cost share. It helps separate high-volume categories from high-cost categories.
Incidents by Alert Source: This chart compares incidents by alert source. It helps teams review where incidents are being reported from and which intake paths need attention.
Monthly Incidents by Severity: This chart shows severity movement across months. It helps leaders see whether critical or high-severity incidents are increasing.
Response Status by Status: This chart adds status context to incident mix. It helps confirm whether certain incident groups are staying unresolved.
4 – Response and Cost
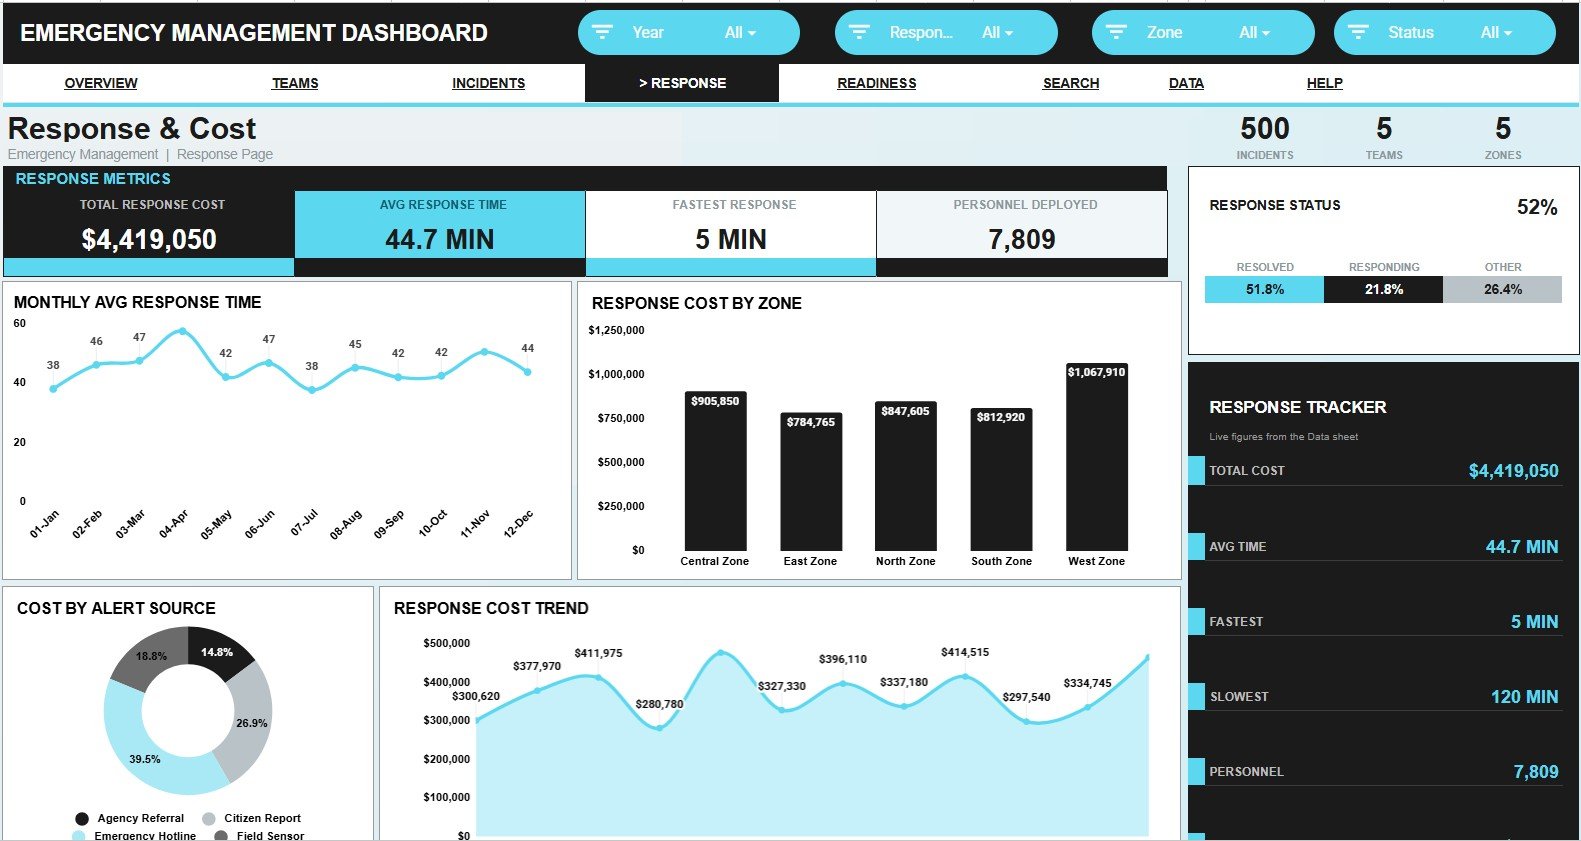
The Response and Cost tab connects response speed with spending so teams can review both operational urgency and financial pressure.
Monthly Avg Response Time by Month: This chart tracks response time over time. It helps teams see whether response speed is improving or slipping.
Response Cost by Zone: This chart compares response cost across zones. It helps identify locations that require more resources or cost review.
Response Cost by Alert Source: This chart shows cost by reporting source. It helps users understand whether certain alert channels create higher response expense.
Response Cost by Month: This chart tracks monthly cost movement. It helps finance and operations teams prepare for budget reviews.
Response Status by Status: This chart keeps closure status visible while reviewing cost. It helps connect spending with response completion.
5 – Force Readiness
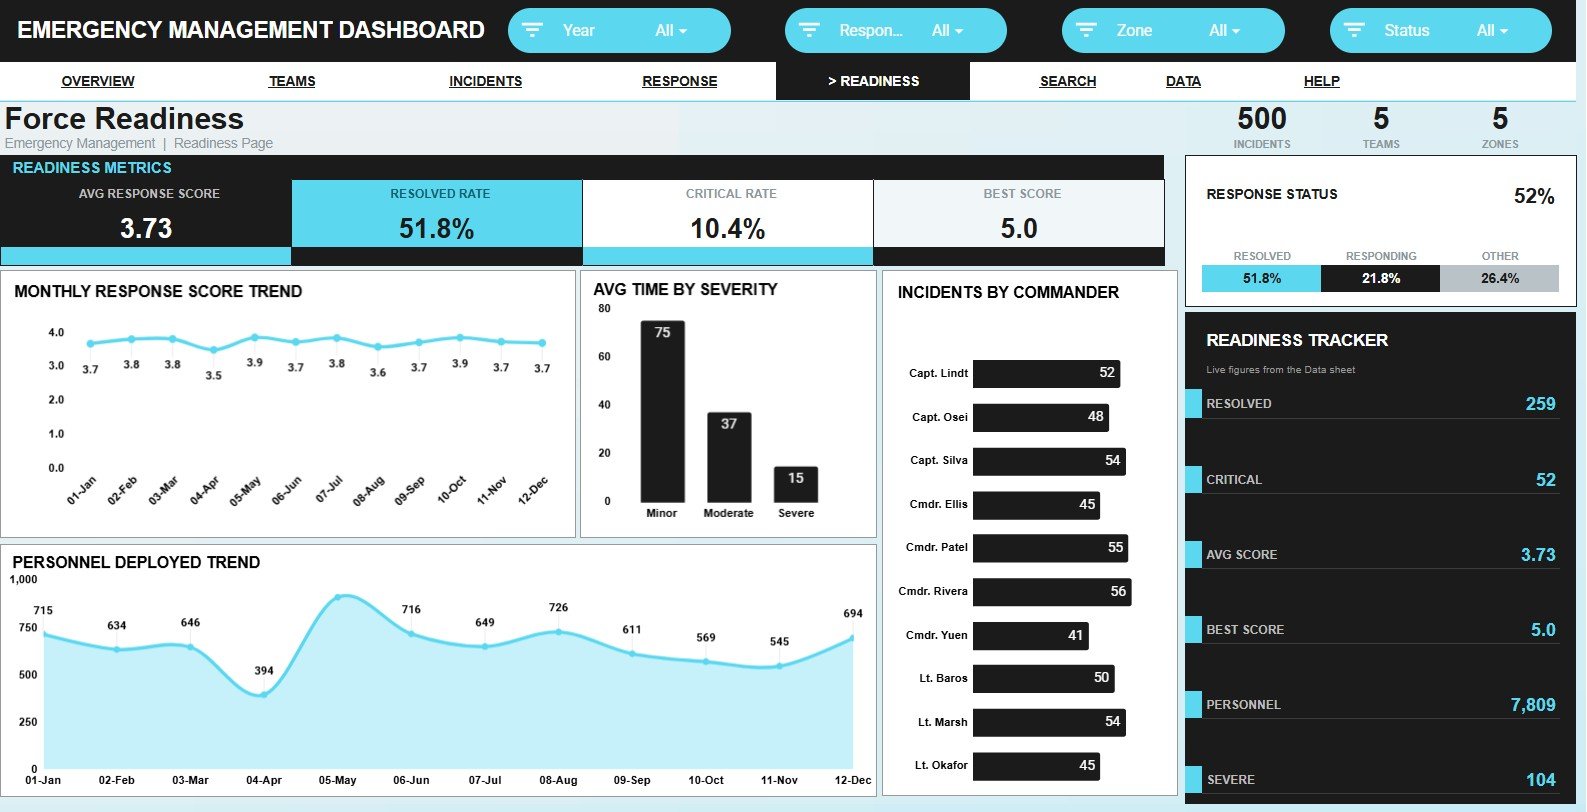
The Force Readiness tab is built for reviewing team readiness, command ownership, personnel deployment, and severity handling.
Monthly Response Score by Month: This chart tracks response score by month. It helps leaders see whether readiness quality is improving or declining.
Avg Time by Severity: This chart compares average response time by severity level. It helps confirm whether urgent incidents receive faster attention.
Incidents by Commander: This chart compares incident ownership by commander. It helps review workload distribution and leadership concentration.
Personnel Deployed by Month: This chart shows staffing deployment across months. It helps align personnel planning with incident demand.
Response Status by Status: This chart supports readiness review by showing current response status mix. It helps users see if unresolved work is affecting operational preparedness.
6 – Search Sheet Tab
The Search Sheet lets you select an Incident ID and view the full record details in one place, including date, emergency type, response team, zone, alert source, status, severity, commander, response cost, response time, personnel, and response score.
7 – Data Sheet Tab
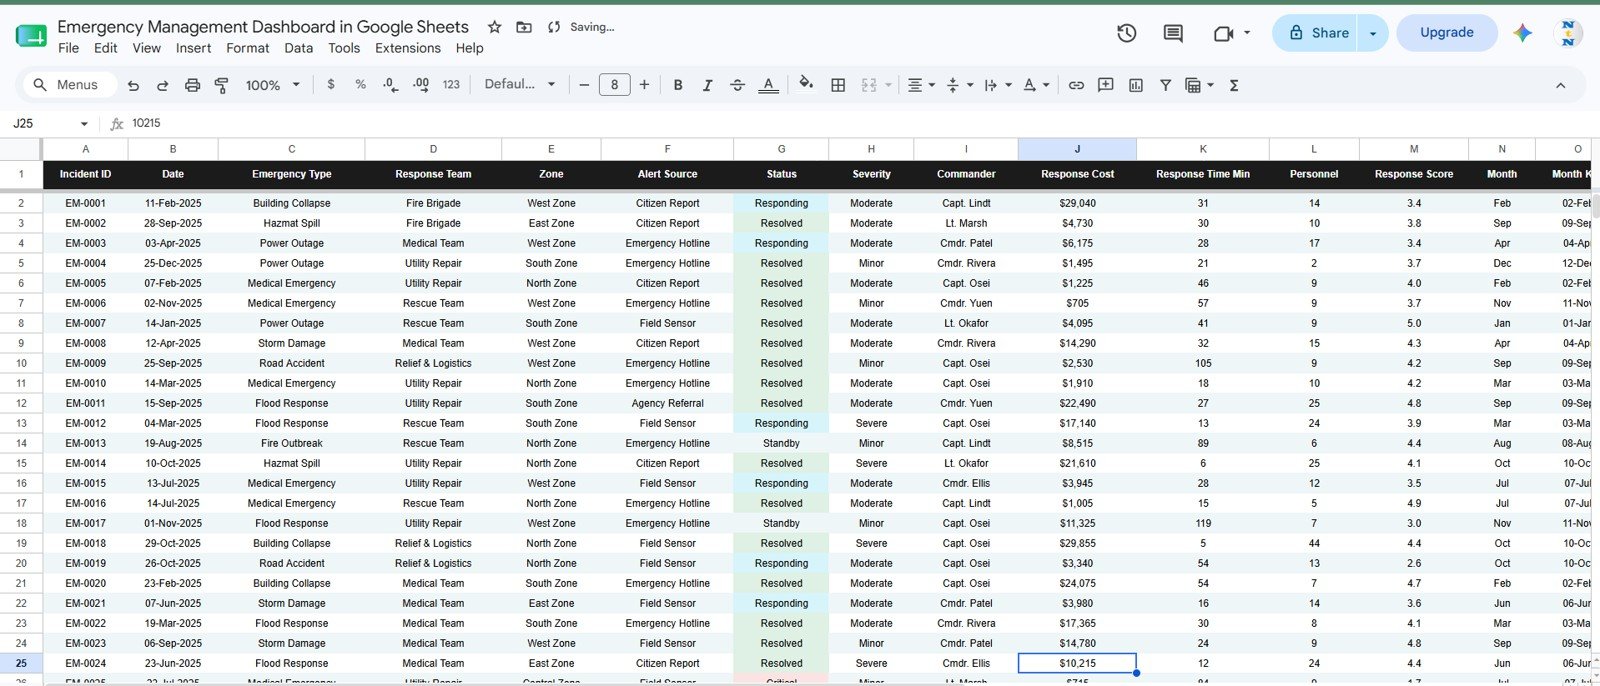
The Data Sheet is where you add or paste incident records in the same format as the sample data. Keep the column structure consistent so the KPI cards, slicers, charts, and Incident ID lookup continue to update correctly.
Emergency Management Dashboard in Google Sheets vs. Microsoft Excel Dashboard vs. Paid Emergency Management SaaS – Where This Fits
| Feature | This Google Sheets dashboard | Microsoft Excel dashboard | Paid emergency management SaaS |
|---|---|---|---|
| Cost | $9.99 sale price, one-time | Template cost plus Microsoft licensing | Recurring subscription or contract pricing |
| Platform | Google Sheets in Drive | Excel desktop or web | Vendor-hosted system |
| Setup time | Copy file and replace sample rows | Open workbook and customize | Often needs onboarding and configuration |
| Real-time team collaboration | Native Google Drive sharing | Requires OneDrive or SharePoint setup | Usually role-based |
| Mobile access | Google Sheets app or browser | Excel app or browser | Usually included |
| Customizable fields | Editable sheets, labels, charts, and formulas | Editable workbook structure | Depends on vendor controls |
| Share with link | Yes, with Google permissions | Yes, with Microsoft sharing tools | Usually invite-based |
| Year-1 cost at 5 users | $9.99 before any Google Workspace costs | Template plus license costs | Can increase with seats and modules |
| Incident ID lookup | Included Search Sheet | Must be built or customized | Usually included |
| Best fit | Spreadsheet-first emergency reporting | Teams standardized on Microsoft files | Teams needing live dispatch, alerts, and workflow automation |
Who This Template Is For – and Who It’s Not For
This template is for emergency management teams, public safety analysts, operations centers, campus safety departments, local-government coordinators, security managers, and consultants who already track structured incident records and need faster reporting in Google Sheets.
It is not a dispatch system, mass notification platform, evidence management system, legal records archive, or live command-and-control application. If your workflow requires regulated emergency alerts, chain-of-custody records, GIS dispatch, or automated field communication, use dedicated software and treat this template as a reporting companion.
How to Use the Emergency Management Dashboard in Google Sheets
- Open the PDF guide after purchase and copy the Google Sheets template to your Drive.
- Review the sample records in the Data Sheet before replacing them.
- Add your own incident records using the same column format.
- Use slicers to filter by emergency type, response team, zone, status, severity, commander, alert source, or month.
- Use the Search Sheet to select an Incident ID and inspect one full record quickly.
Real-World Use Cases
Asha, emergency operations coordinator: uses the Overview page before daily briefings to check total incidents, response cost, average response time, and response score.
Marcus, response team supervisor: opens Team Performance to compare cost, response time, and score across teams before resource planning.
Leah, public-sector analyst: uses Incident Analysis and Response and Cost to prepare a monthly incident review for leadership.
Frequently Asked Questions
What does this dashboard track?
It tracks incident ID, date, emergency type, response team, zone, alert source, status, severity, commander, response cost, response time, personnel deployed, and response score.
Does the dashboard work in Google Sheets?
Yes. It is built for Google Sheets and is intended to be copied into your own Google Drive account.
Can I filter the dashboard?
Yes. The dashboard uses slicers so you can filter the available dashboard views during reviews and meetings.
Does it include a search page?
Yes. The Search Sheet lets you select an Incident ID and view the matching full record details in one place.
Can I customize emergency types, teams, zones, and commanders?
Yes. The file is editable. Keep the source columns aligned so the cards, charts, slicers, and lookup formulas continue working.
Is this a replacement for emergency dispatch software?
No. It is a dashboard template for reporting and analysis, not a live dispatch, alerting, or case-management platform.
About the Author
Built by PK – Microsoft Certified Professional with 15+ years of Excel, Google Sheets, and Power BI experience. Founder of NextGenTemplates, reaching 300K+ subscribers across YouTube channels. Every template is hand-built and tested before release.
Explore Related Templates
- Public Safety Dashboard in Google Sheets for incident, district, response time, personnel, and safety analysis.
- Enterprise Emergency Management Dashboard in Google Sheets for broader enterprise emergency tracking and budget analysis.
- Government Administration Dashboard in Google Sheets for public-service request reporting.
- Municipal Services Dashboard in Google Sheets for city service ticket analysis.
- Government Citizen Services Performance Dashboard in Google Sheets for citizen-service performance analysis.
- Browse more Google Sheets templates and Google Sheets dashboard templates.
Get the Emergency Management Dashboard in Google Sheets to turn incident records into a clear, filterable reporting system for response, cost, status, readiness, and team-performance reviews.
Watch the step-by-step video Demo:
Last updated: July 21, 2026.
Compatibility and Requirements
- Works in Google Sheets. You need a free Google account and a web browser, and you copy the file to your own Google Drive.
- You filter the dashboard with slicers and pick one record from the Incident ID selector on the Search Sheet. Google explains charts in Add & edit a chart or graph.
More Questions About This Template
Which tabs does the file have?
Seven tabs: Overview, Team Performance, Incident Analysis, Response and Cost, Force Readiness, Search Sheet and Data Sheet.
How do I replace the sample data?
Open the Data Sheet and add or paste your incident records in the same column format as the sample rows. Keep the columns aligned so the cards, slicers, charts and Incident ID lookup keep updating.
Can I see all details for one incident?
Yes. On the Search Sheet, select an Incident ID and the full record appears in one place, including date, emergency type, response team, zone, status, severity, commander, response cost, response time, personnel and response score.
Is there an Excel or Power BI version?
Yes. See the Emergency Management Dashboard in Excel and the Emergency Management Dashboard in Power BI.






























Reviews
There are no reviews yet.