


Coach Performance and Revenue Dashboard in Google Sheets
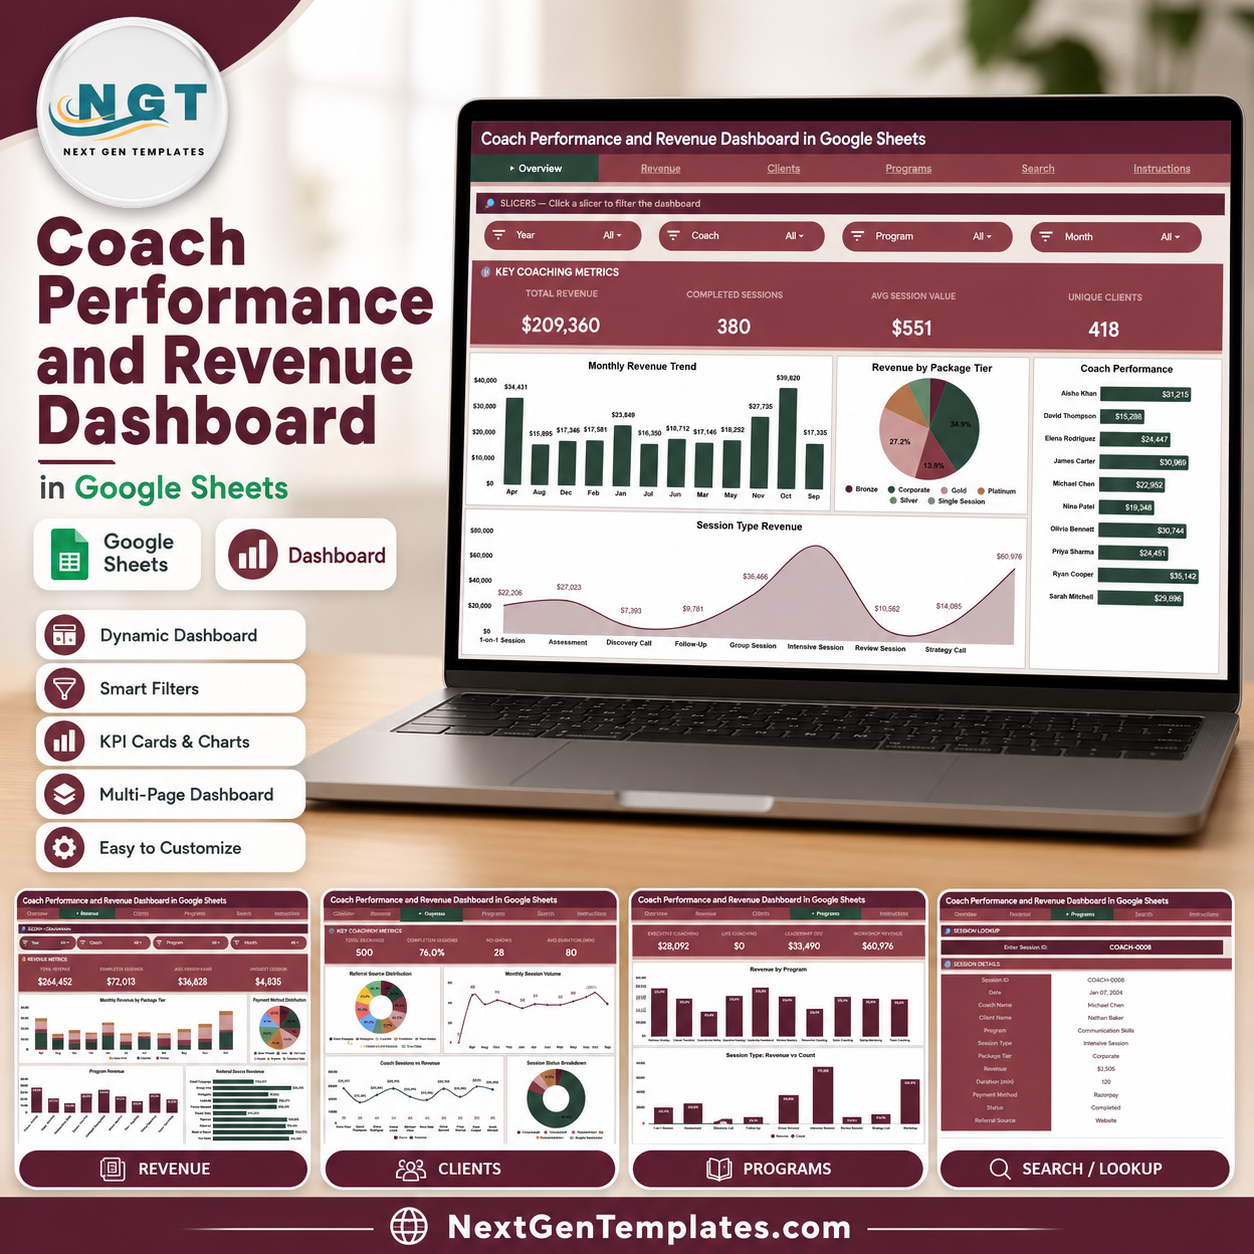
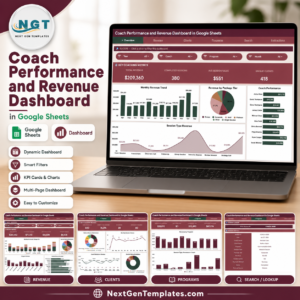
The Coach Performance and Revenue Dashboard in Google Sheets helps coaching businesses, consultants, mentors, wellness coaches, career coaches, executive coaches, and training teams track revenue, completed sessions, client activity, referral sources, package tiers, program performance, and coach-level results in one editable Google Sheets dashboard.
Instead of manually checking separate client lists, payment notes, session logs, and program reports, this dashboard brings the most important coaching KPIs into clear visual tabs. Use it to review revenue trends, monitor session completion, compare coach performance, understand client sources, and manage coaching operations with a practical spreadsheet workflow.
What You Can Track
- Total Revenue from coaching sessions and programs.
- Completed Sessions across coaches, clients, and service types.
- Average Session Value to understand pricing and revenue efficiency.
- Unique Clients served during the selected reporting period.
- Monthly revenue trends, package tier performance, payment methods, referral sources, client segments, session status, and program-level revenue.
Dashboard Pages Included
This Google Sheets dashboard includes multiple report pages designed for day-to-day coaching performance tracking and revenue analysis.
1. Overview Page
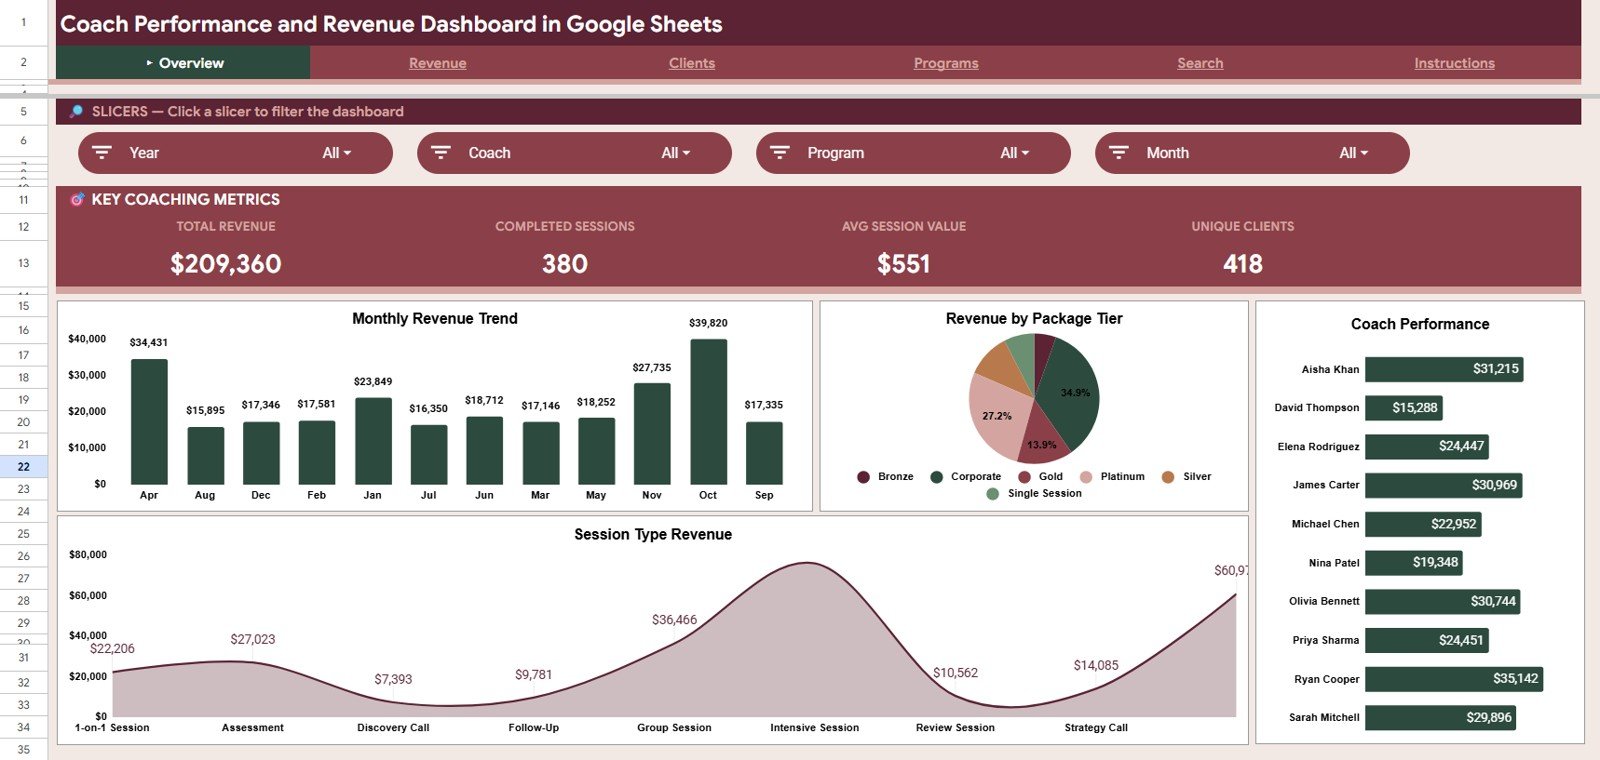
The Overview page gives you a high-level summary of your coaching business with KPI cards for Total Revenue, Completed Sessions, Avg Session Value, and Unique Clients. It also includes slicers so you can quickly filter the dashboard and review the metrics that matter most.
- Monthly Revenue by Month: Shows revenue trends across months so you can identify seasonal patterns, growth periods, and slower months. This chart is useful for monitoring overall business momentum and planning coaching capacity.
- Revenue by Package Tier: Compares revenue generated by each package tier, helping you see which offers drive the most income. Use this to evaluate pricing structure and package demand.
- Coach Performance by Coach: Compares coach-level performance so managers can review contribution, workload, and revenue impact. This helps identify top-performing coaches and areas where support may be needed.
- Session Type Revenue by Session Type: Breaks down revenue by session type, such as individual, group, strategy, or follow-up sessions. This helps clarify which services are most valuable to the business.
2. Revenue Page
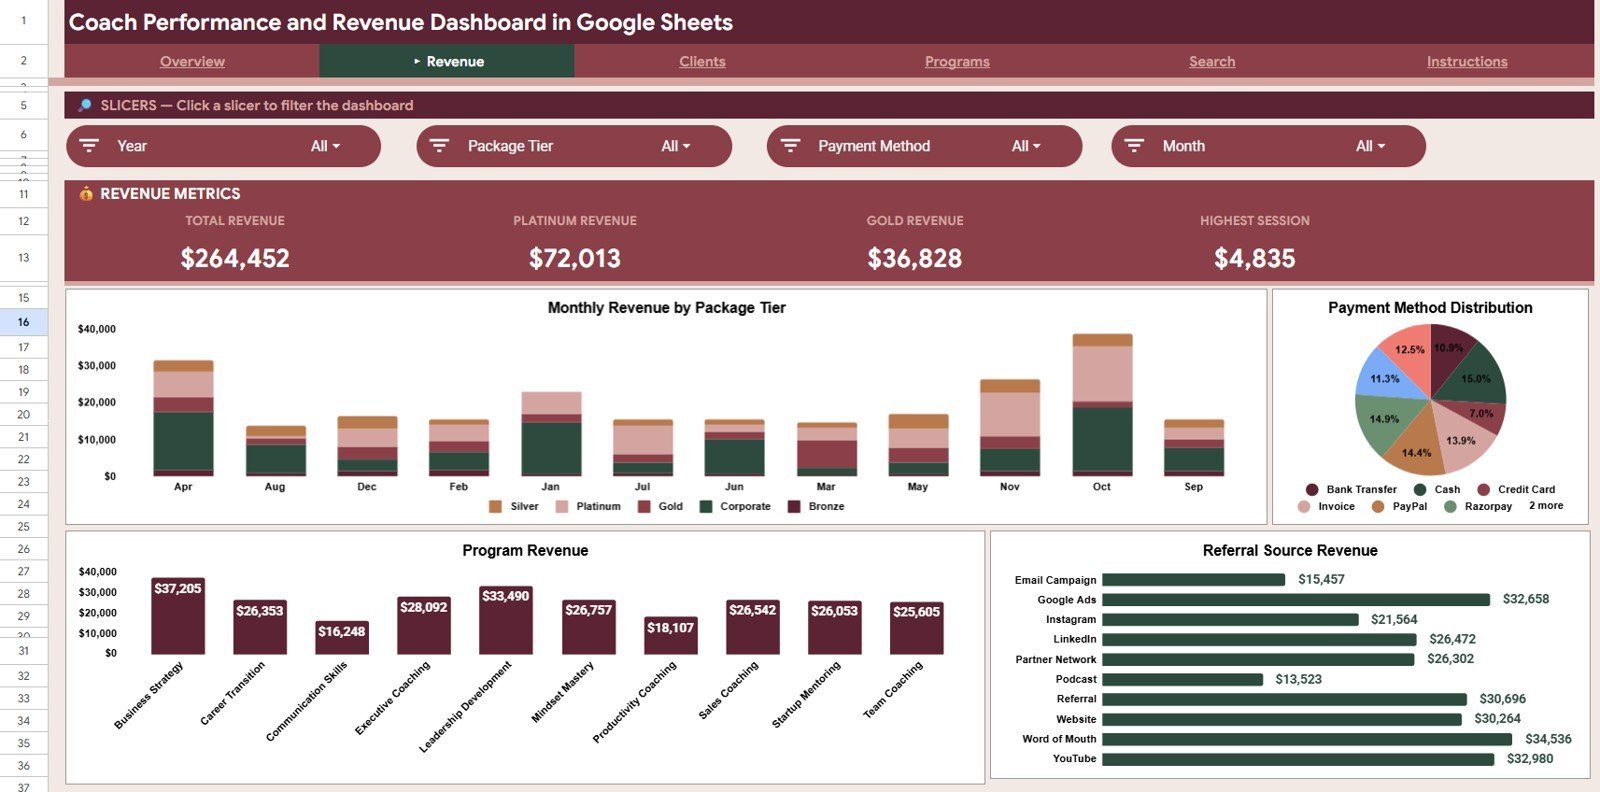
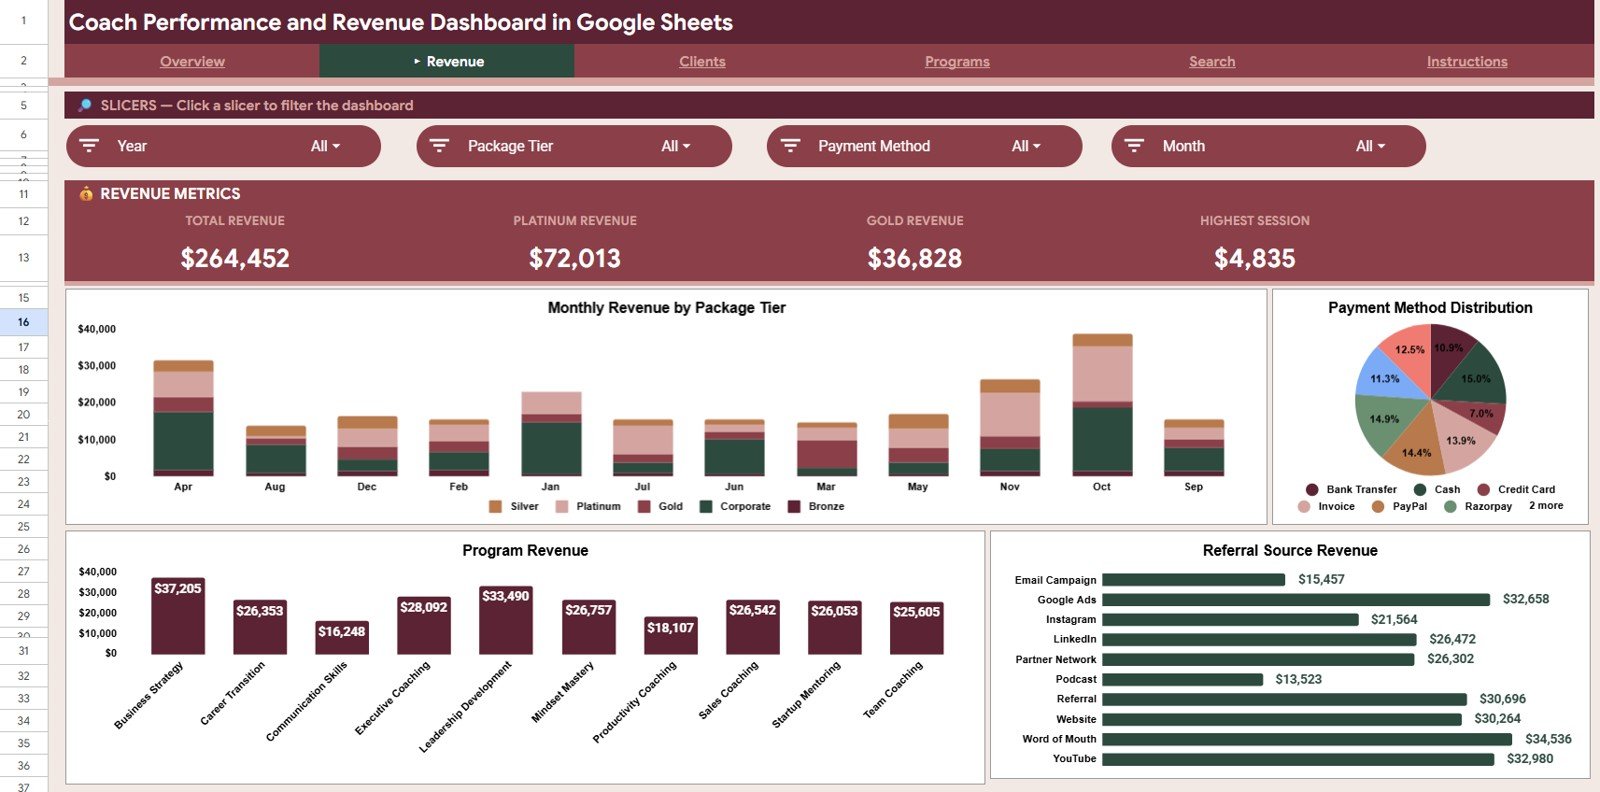
The Revenue tab focuses on income analysis across package tiers, payment methods, programs, and referral channels. It helps coaching businesses understand where revenue comes from and which services or acquisition sources are producing the strongest results.
- Monthly Revenue by Package Tier: Shows how each package tier contributes to revenue month by month. Use it to compare premium, standard, and entry-level packages over time.
- Payment Method Distribution by Payment Method: Displays how clients pay for coaching services. This is helpful for understanding payment preferences and reconciling revenue collection methods.
- Program Revenue by Program: Compares revenue across coaching programs. Use this chart to identify your strongest programs and decide where to focus marketing or delivery improvements.
- Referral Source Revenue by Referral Source: Shows revenue generated from each referral source. This helps you evaluate whether channels like referrals, social media, website traffic, partnerships, or paid ads are producing valuable clients.
3. Clients Page
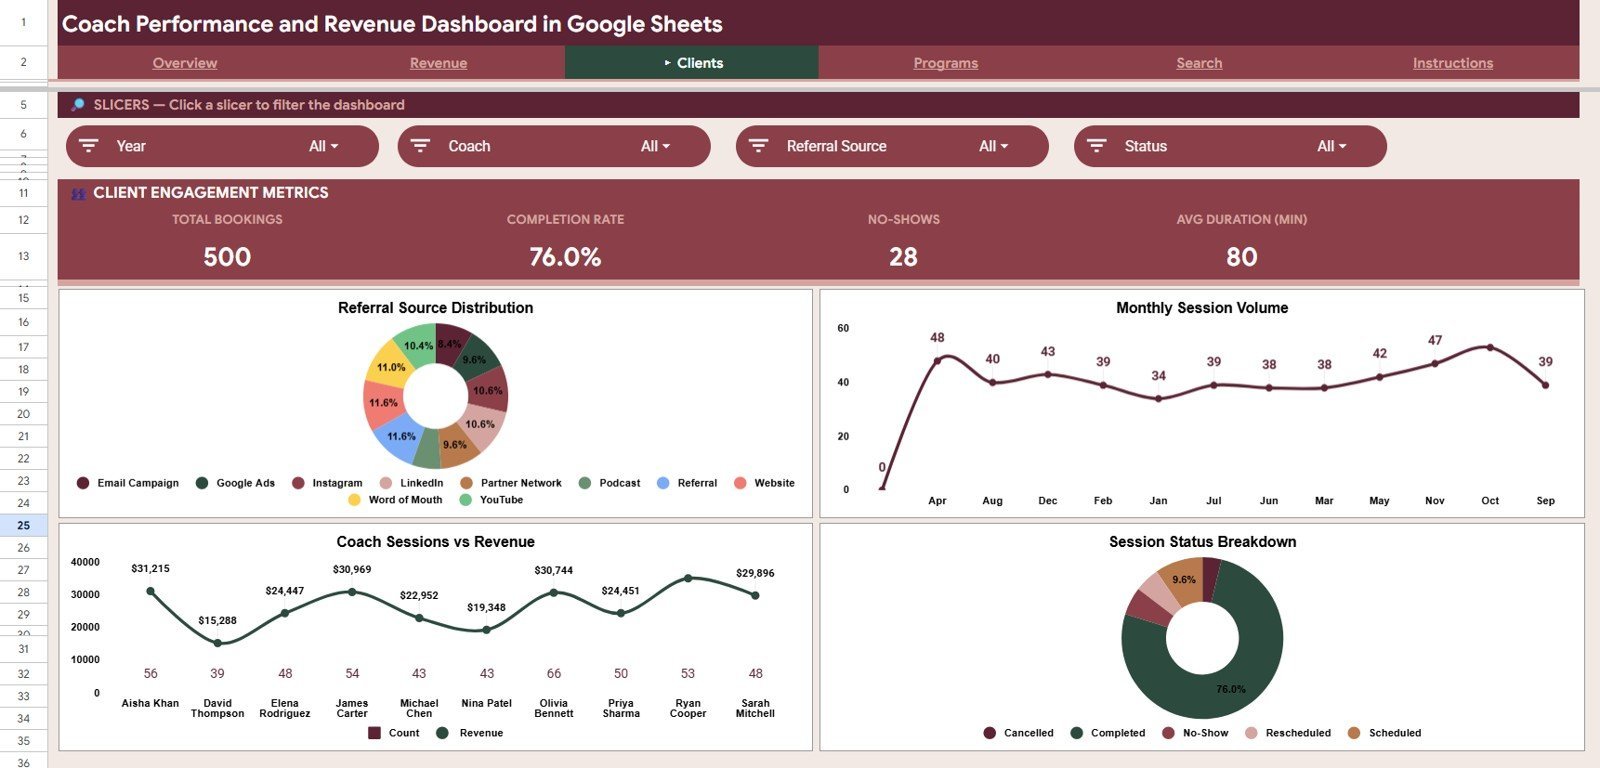
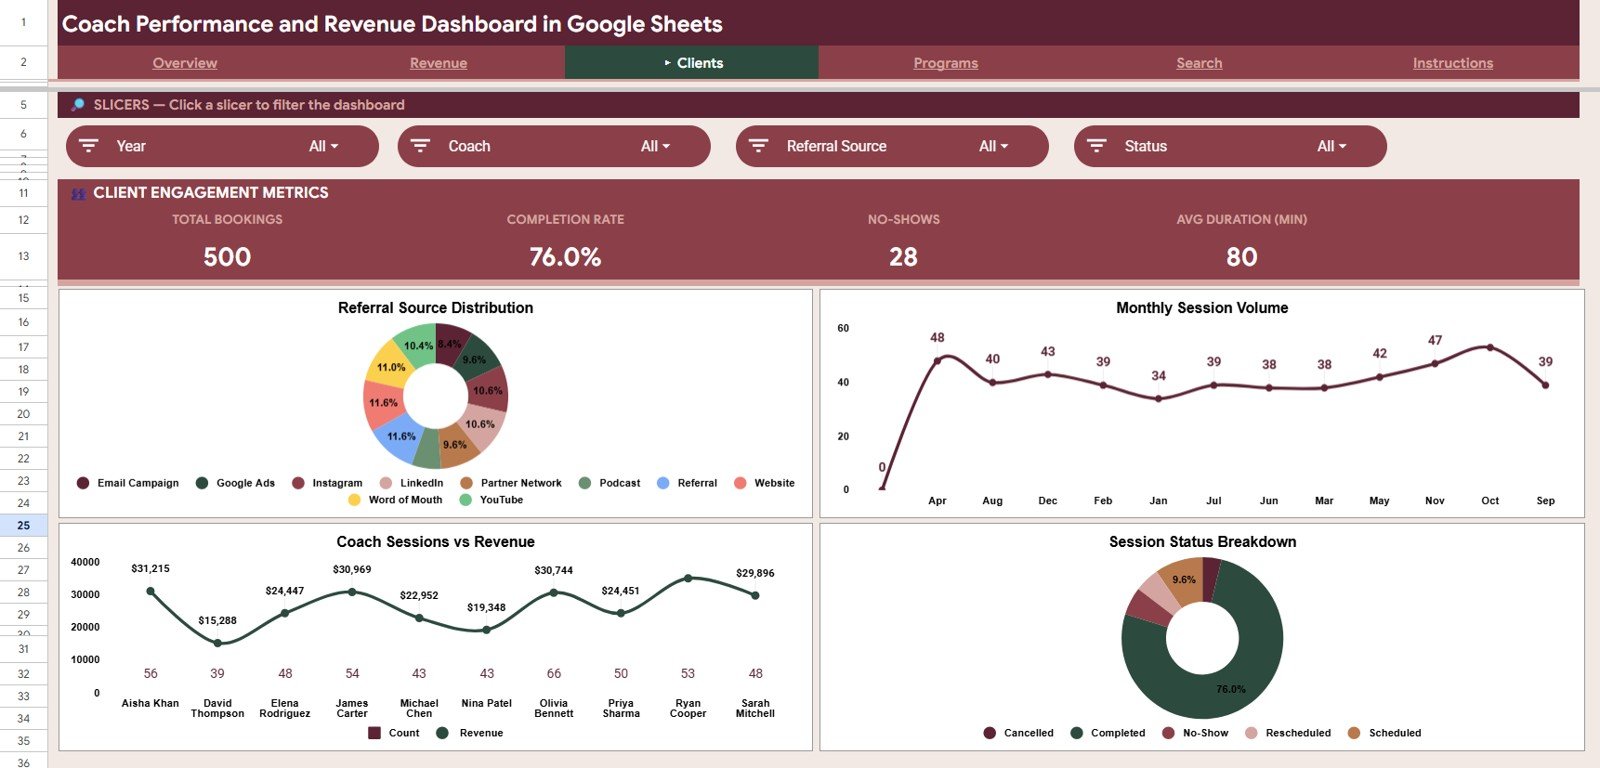
The Clients tab helps you understand client acquisition, session volume, coach contribution, and session status. It is useful for reviewing client engagement and operational activity across your coaching practice.
- Referral Source Distribution by Referral Source: Shows how clients are distributed across different acquisition sources. This helps you understand where your client base is coming from.
- Monthly Session Volume by Month: Tracks how many sessions were delivered each month. Use this to monitor demand, scheduling load, and coaching capacity.
- Sessions and Revenue by Coach: Compares both session count and revenue by coach. This gives a balanced view of activity volume and financial contribution.
- Session Status Breakdown by Status: Breaks sessions into statuses such as completed, scheduled, cancelled, or pending. This helps spot delivery gaps and follow-up needs.
4. Programs Page
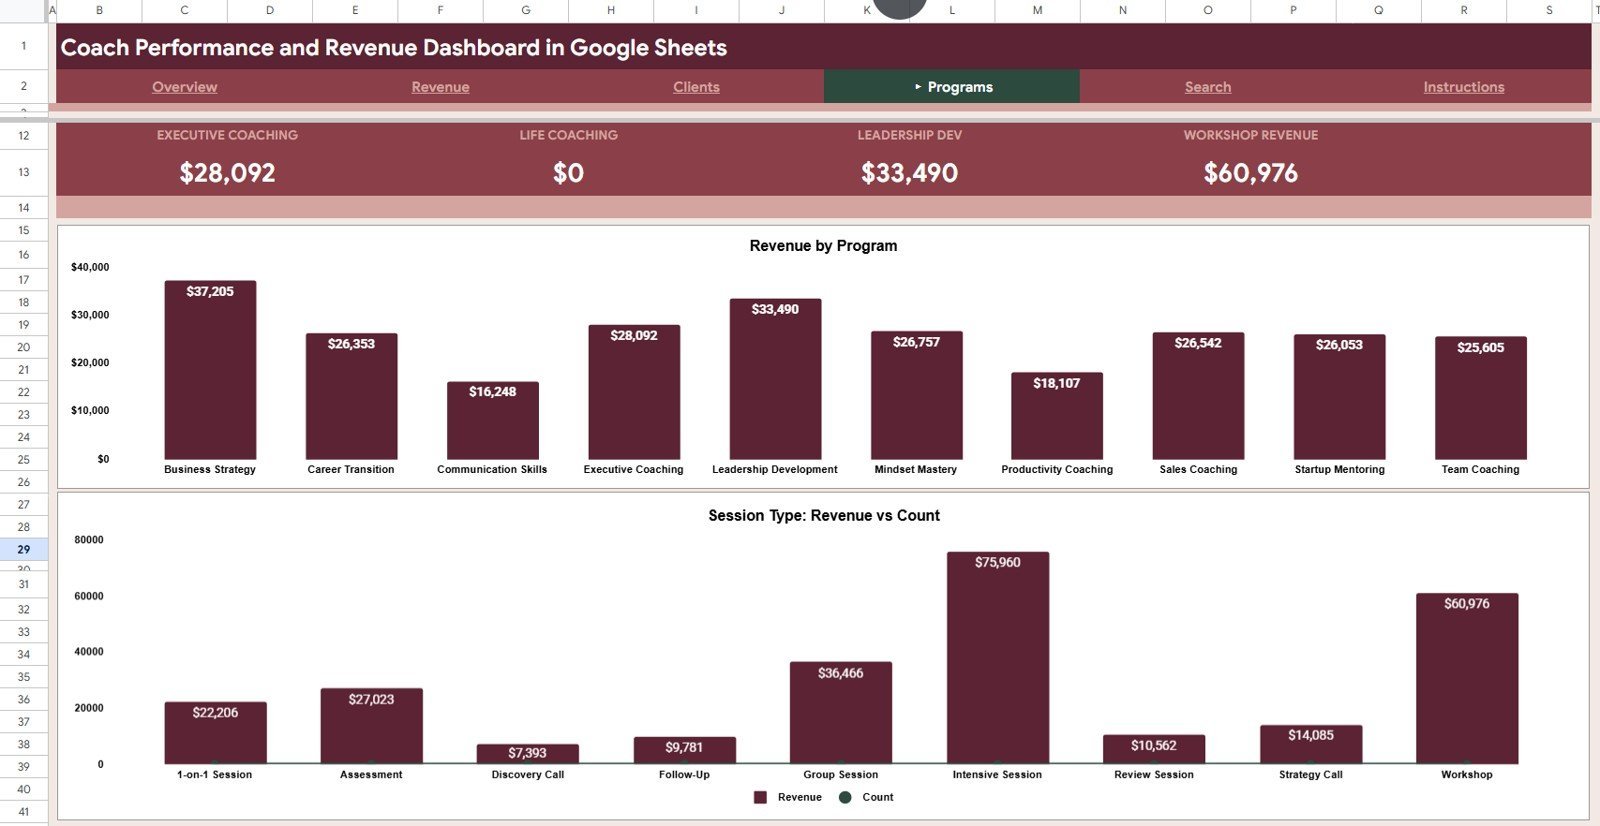
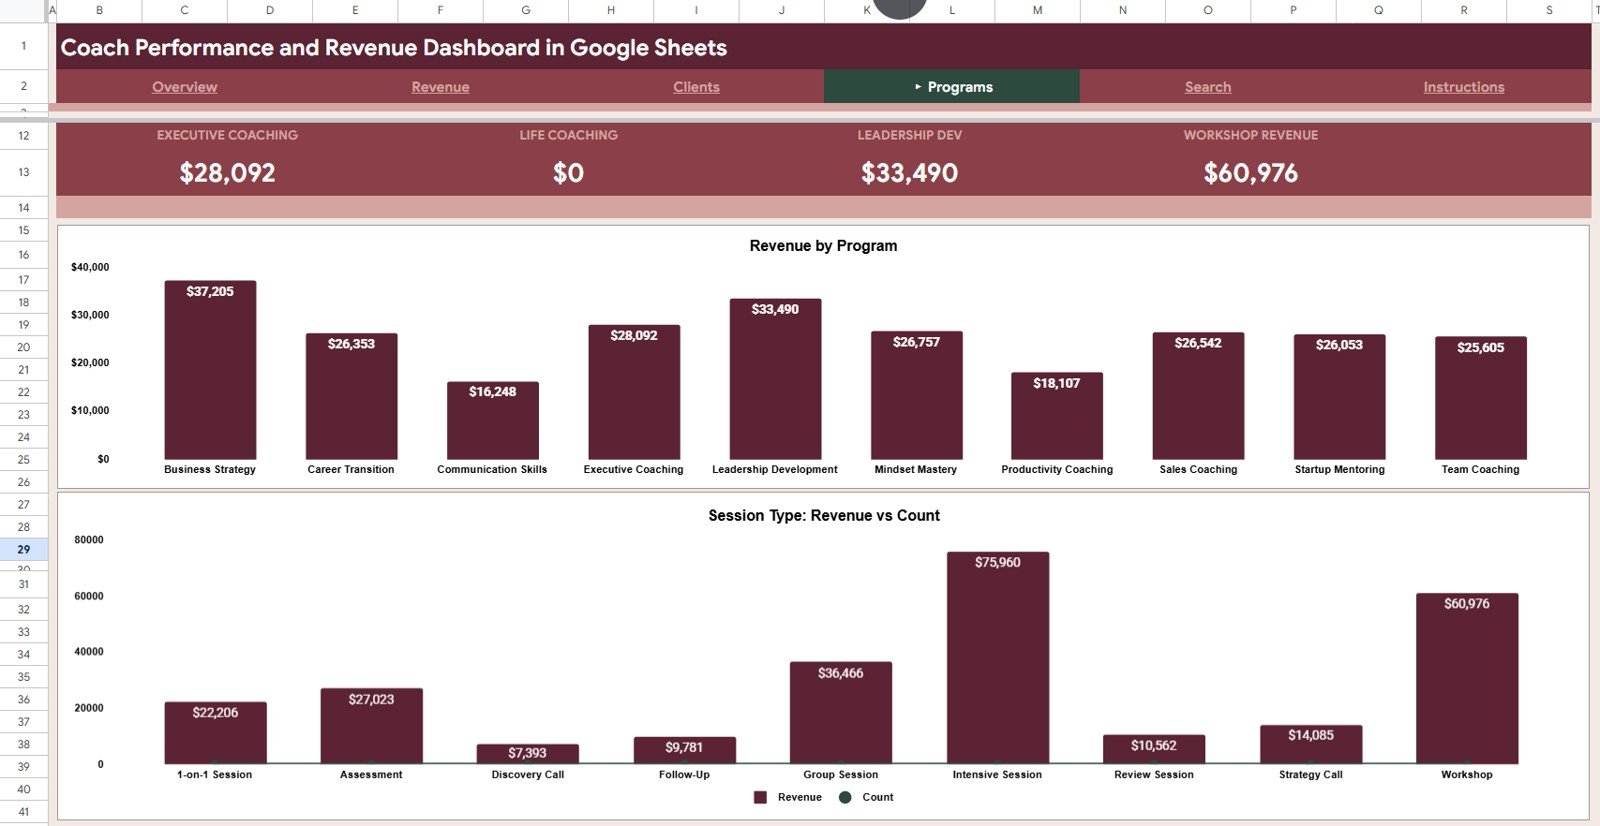
The Programs tab focuses on coaching program performance and session-type analysis. It gives you a focused way to compare which programs and session formats are producing the most revenue and activity.
- Revenue by Program: Compares total revenue across each coaching program. Use it to identify high-value programs and decide where to expand or optimize your offerings.
- Revenue and Count by Session Type: Shows both revenue and session count for each session type. This helps compare popularity and profitability across your service formats.
5. Search Sheet Tab
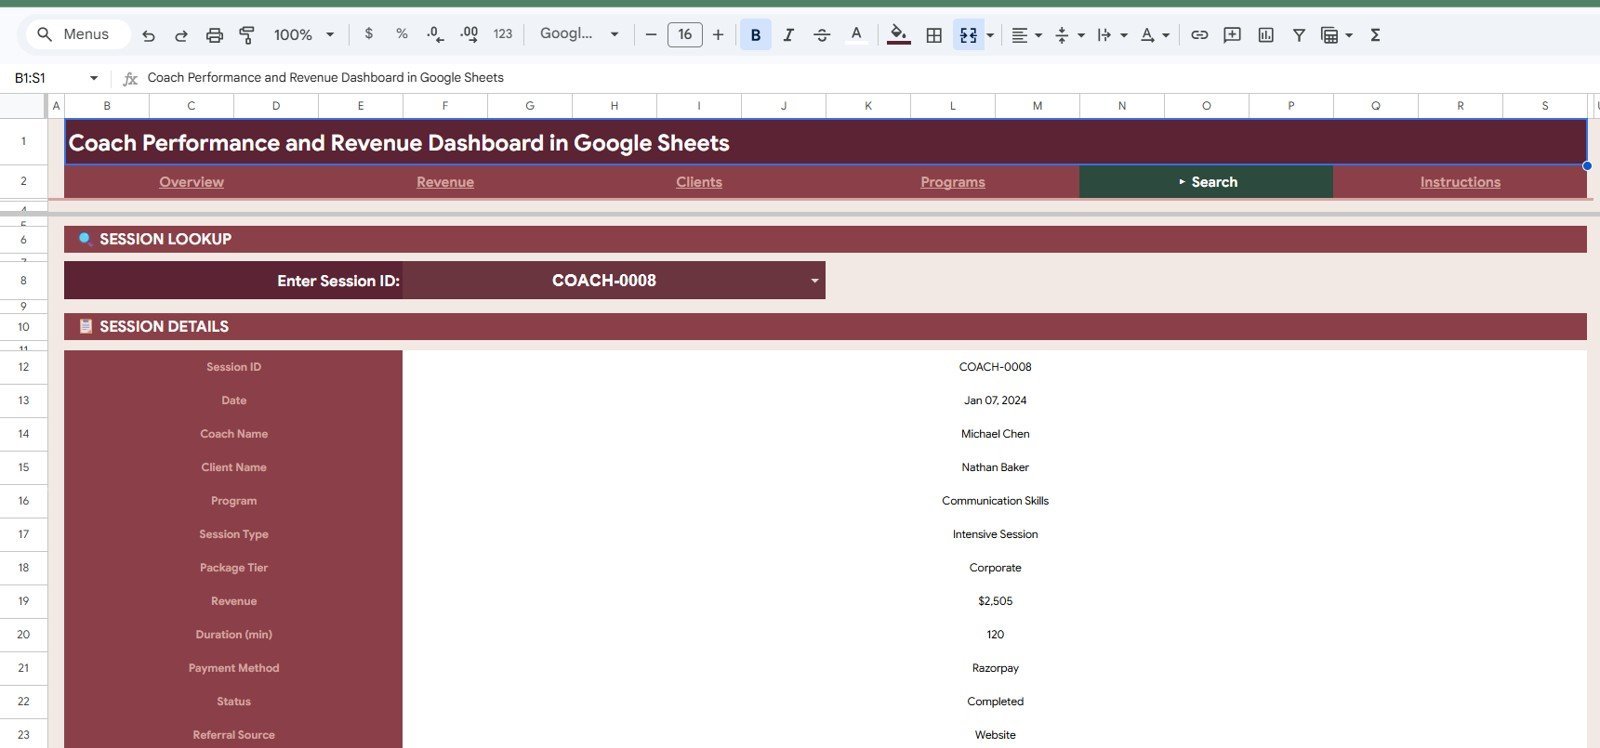
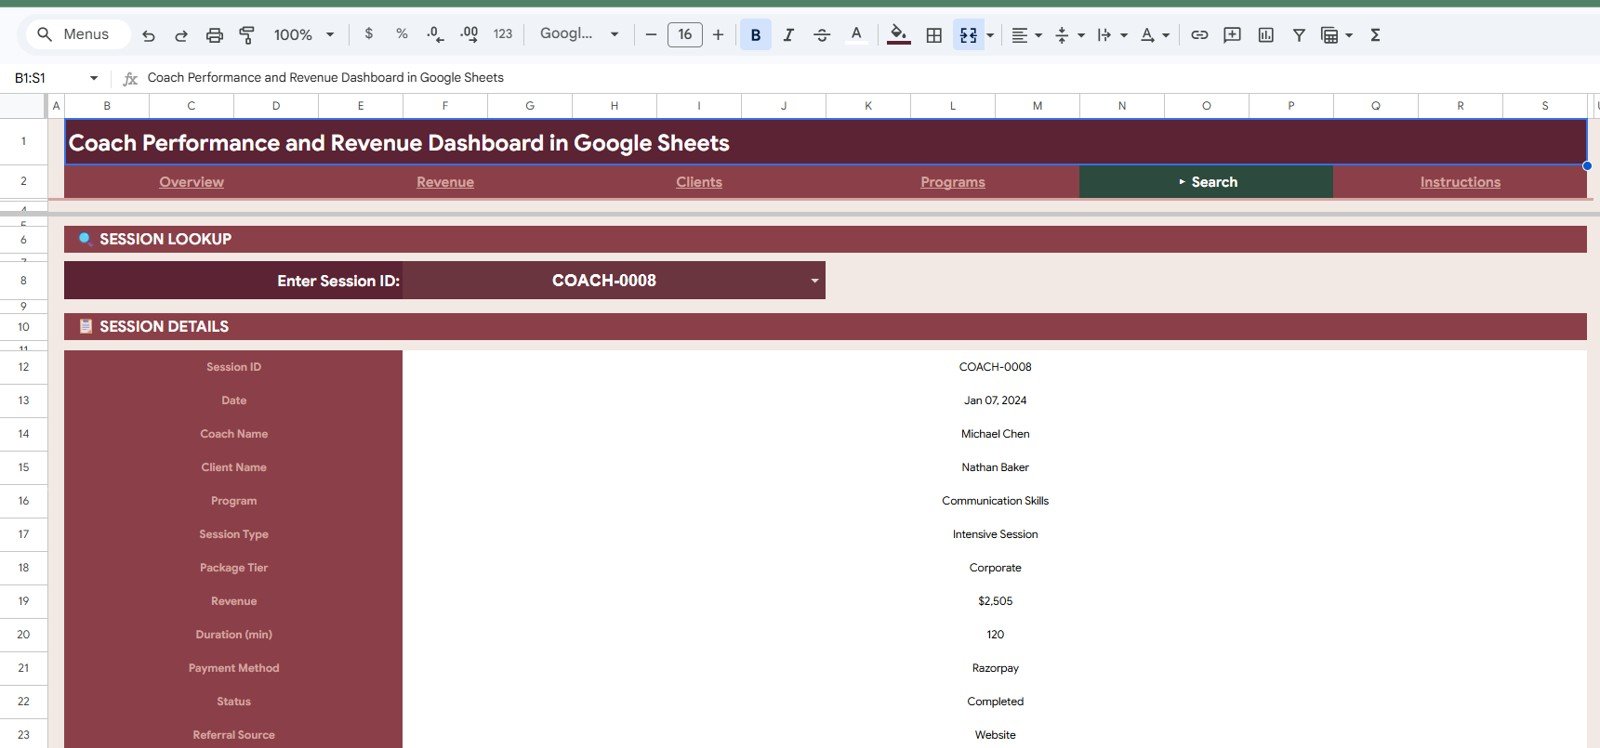
The Search Sheet tab lets users select a Session ID and quickly view the matching coaching session details. The lookup view includes date, coach name, client name, program, session type, package tier, revenue, duration, payment method, status, referral source, client segment, and month.
This tab is useful when you need to verify one session record, check client history, confirm revenue details, or review session-specific information without scrolling through the full data table.
6. Data Sheet Tab
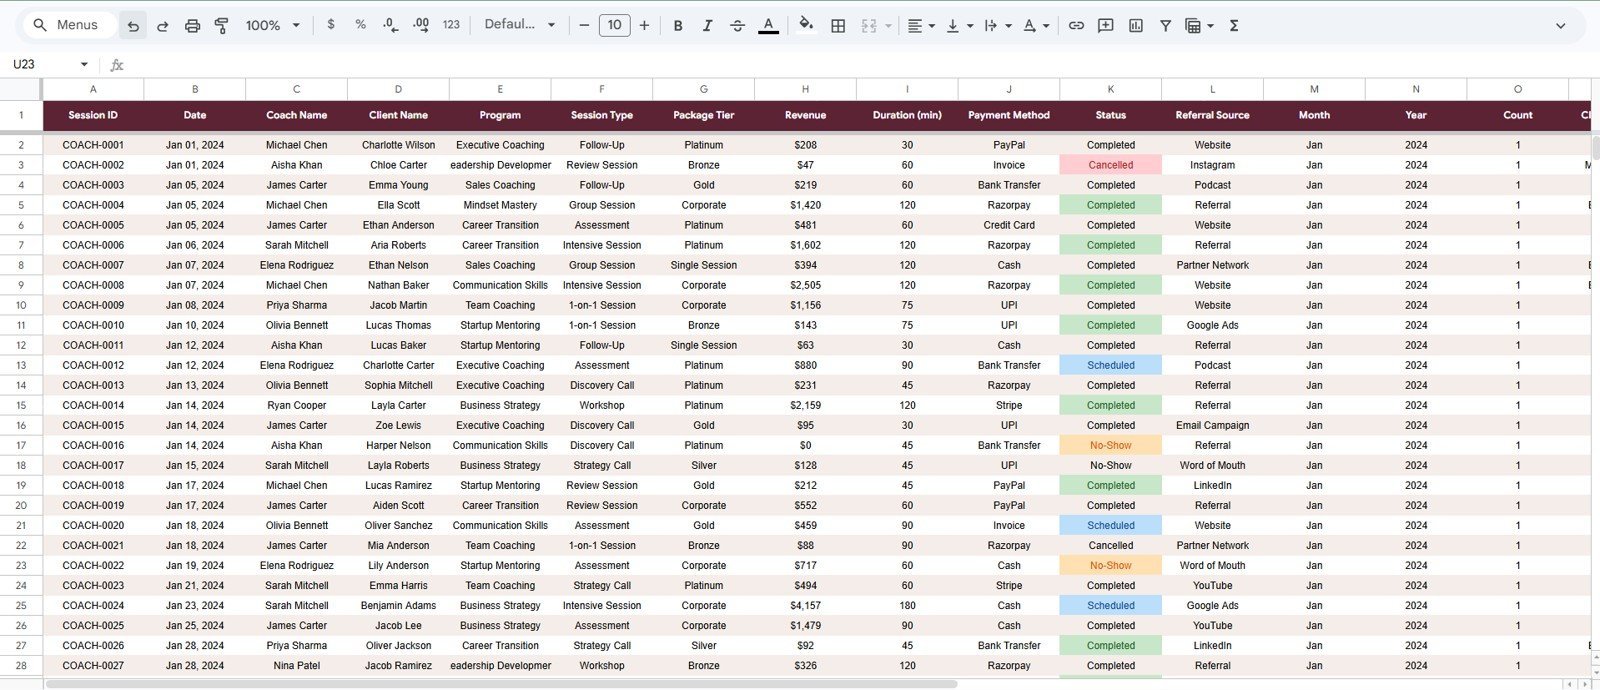
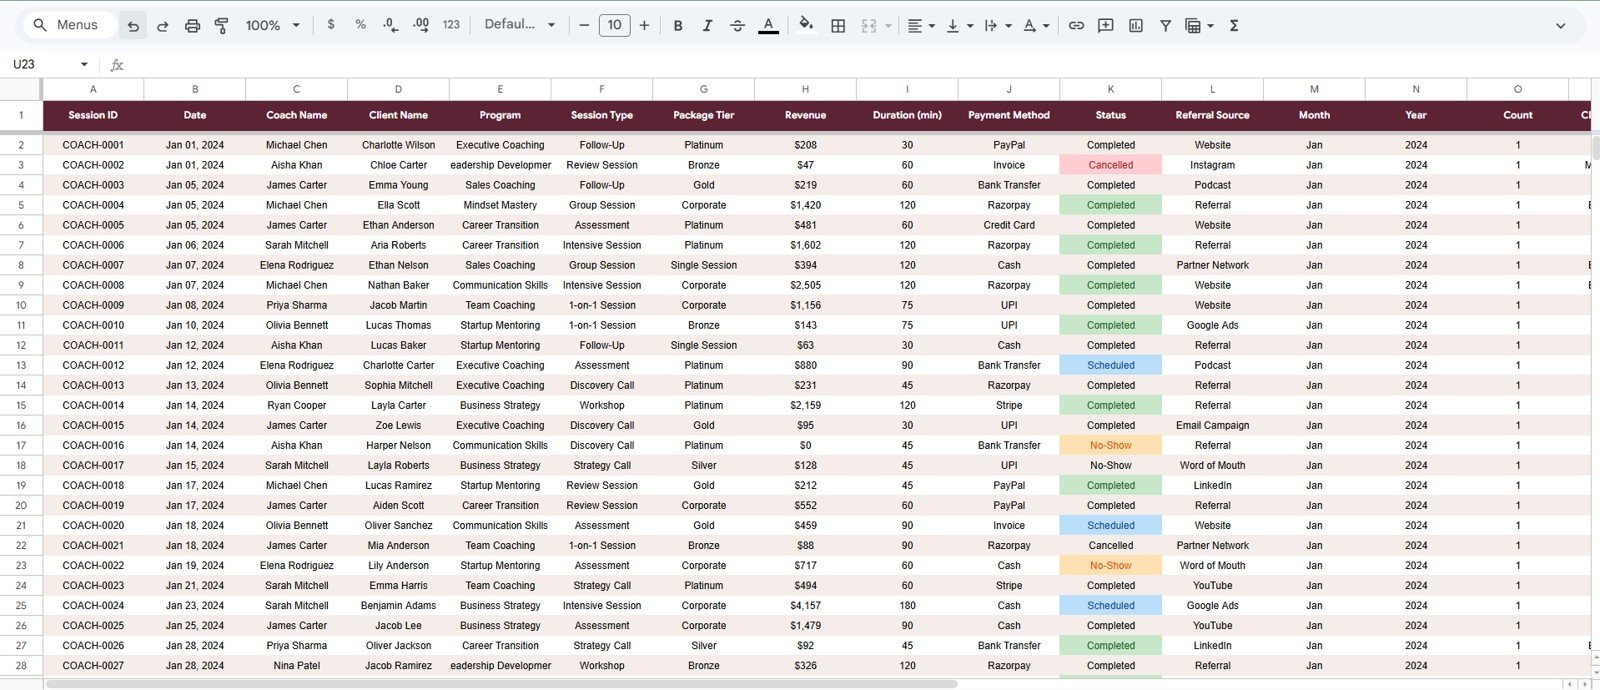
The Data Sheet tab is where you add or paste coaching session records in the same format used by the dashboard. Once your data is entered consistently, the dashboard pages summarize the information into KPI cards, charts, and filtered views.
Typical fields include session ID, date, coach, client, program, session type, package tier, revenue, duration, payment method, status, referral source, client segment, and month.
Key Features
- Editable Google Sheets dashboard for coaching revenue and performance tracking.
- Multiple dashboard pages for overview, revenue, clients, programs, search, and raw data.
- KPI cards for revenue, completed sessions, average session value, and unique clients.
- Charts for monthly revenue, package tiers, coach performance, session types, payment methods, programs, referral sources, and session status.
- Slicers and filters for fast interactive analysis.
- Search sheet for quick session-level lookup.
- Structured data sheet designed for easy updating.
- Works in Google Sheets, with no recurring subscription required.
Who This Dashboard Is For
- Business coaches tracking clients, sessions, and revenue.
- Executive coaches reviewing coach performance and program revenue.
- Career coaches monitoring client segments and session outcomes.
- Fitness, wellness, and life coaches managing packages and referrals.
- Coaching agencies that need a simple operating dashboard in Google Sheets.
- Consultants and mentors who sell sessions, packages, or coaching programs.
How This Template Helps
- Identify top revenue-driving programs and package tiers.
- Review which coaches, session types, and referral sources generate the most value.
- Monitor completed sessions and session status in one place.
- Understand client acquisition channels and monthly activity trends.
- Make faster decisions about coaching capacity, pricing, marketing, and program improvements.
What Is Included After Purchase
- Google Sheets copy link access through the included download guide.
- Editable dashboard tabs with charts, slicers, KPI cards, search view, and data sheet.
- Sample structure that can be updated with your own coaching data.
- One-time purchase pricing. No monthly software fee from NextGenTemplates.
Important Notes
- This is a digital Google Sheets dashboard template.
- You need a Google account to copy and use the spreadsheet in Google Drive.
- The dashboard works best when your data follows the same column structure shown in the Data Sheet tab.
- This template is not affiliated with or endorsed by Google.
Explore Related Resources
- Read the full Coach Performance and Revenue Dashboard blog post.
- Browse more Google Sheets templates.
- Browse dashboard templates.
- See the Coaching Business Dashboard in Google Sheets.
Frequently Asked Questions
Can I edit this dashboard?
Yes. After creating your own copy in Google Drive, you can edit the data, labels, charts, and structure based on your coaching business needs.
Does this require Excel?
No. This version is built for Google Sheets.
Can I use it for multiple coaches?
Yes. The dashboard includes coach-level fields and charts, making it useful for solo coaches, coaching teams, and coaching agencies.
Can I track different programs and session types?
Yes. The template includes program, session type, and package tier fields so you can analyze revenue and activity by service offering.
Is a download file included?
The product is delivered as a digital template access package. The final Google Sheets copy link or guide should be attached to the WooCommerce download before publishing.
Watch the step-by-step video Demo:
Last updated: July 7, 2026.































Reviews
There are no reviews yet.