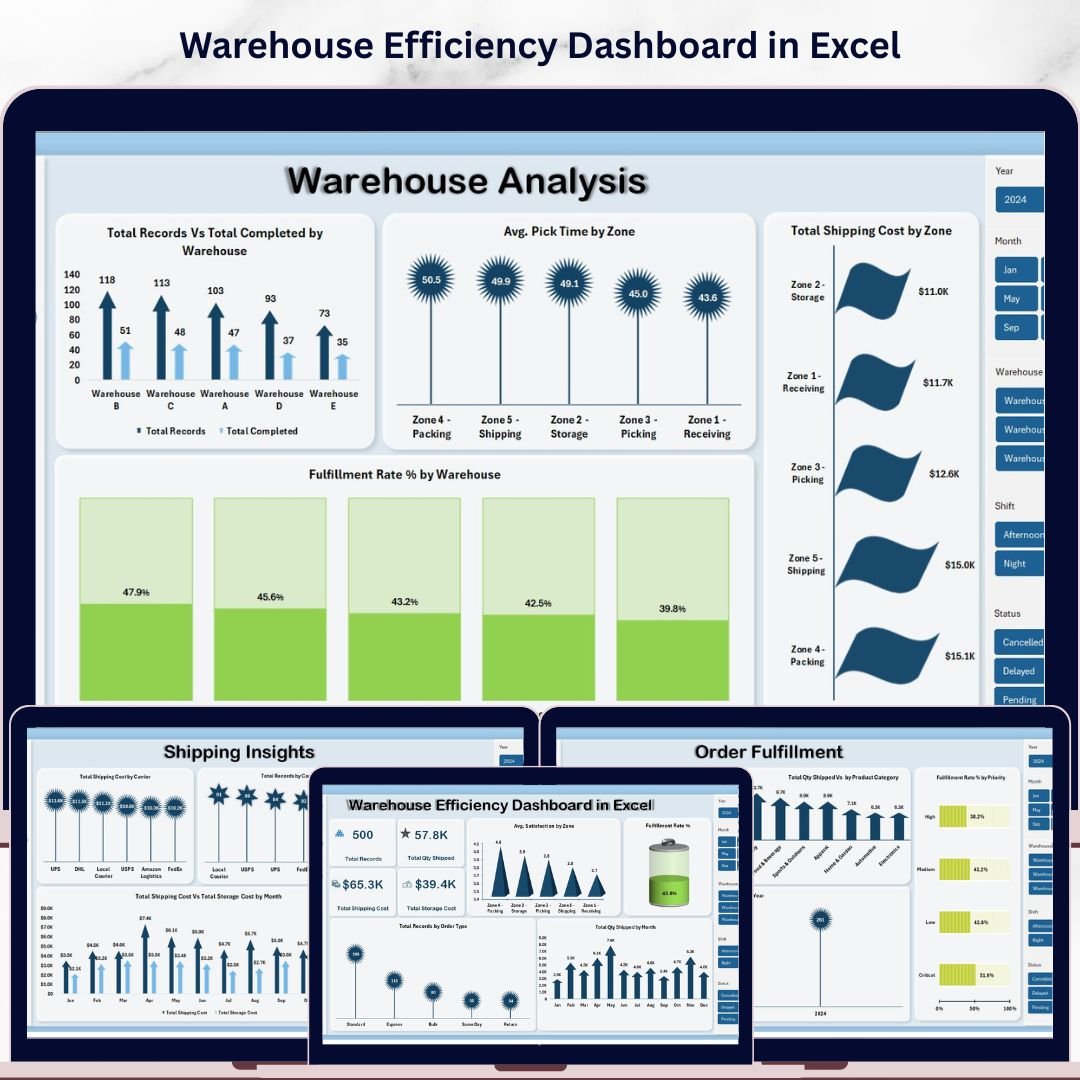

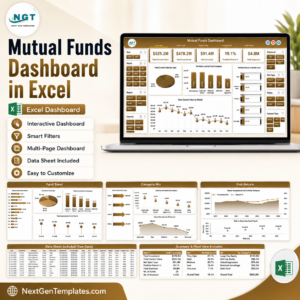
Warehouse Efficiency Dashboard in Excel is a professionally designed, ready-to-use Excel dashboard template built for warehouse managers, logistics coordinators, supply chain directors, and operations teams who need to monitor warehouse throughput, storage utilization, order fulfillment, picking accuracy, and delivery performance from a single interactive workbook. This template includes 5 interactive dashboard pages, a structured data sheet, and a support sheet with pivot tables — giving you complete warehouse visibility within Microsoft Excel 📊📦.
Without centralized warehouse analytics, operations teams face slow order processing, misallocated storage, poor picking accuracy, and rising operational costs. The Warehouse Efficiency Dashboard in Excel eliminates these blind spots by transforming your raw warehouse data into clear, actionable visuals with dynamic charts, KPI cards, and slicer-based filtering. This template includes 5 interactive pages — Overview, Warehouse Analysis, Shipping Insights, Worker Productivity, and Order Fulfillment — and tracks key performance indicators including Total Orders, Total Units Shipped, Order Fulfillment Rate, Avg Processing Time, and On-Time Shipment %.

Warehouse Efficiency Dashboard in Excel
🔑 Key Features of Warehouse Efficiency Dashboard in Excel
📊 5 Interactive Dashboard Pages — The template delivers complete warehouse performance visibility across Overview, Warehouse Analysis, Shipping Insights, Worker Productivity, and Order Fulfillment pages. Each page is packed with dynamic charts and slicers for instant filtering by warehouse zone, product category, shift, time period, and worker.
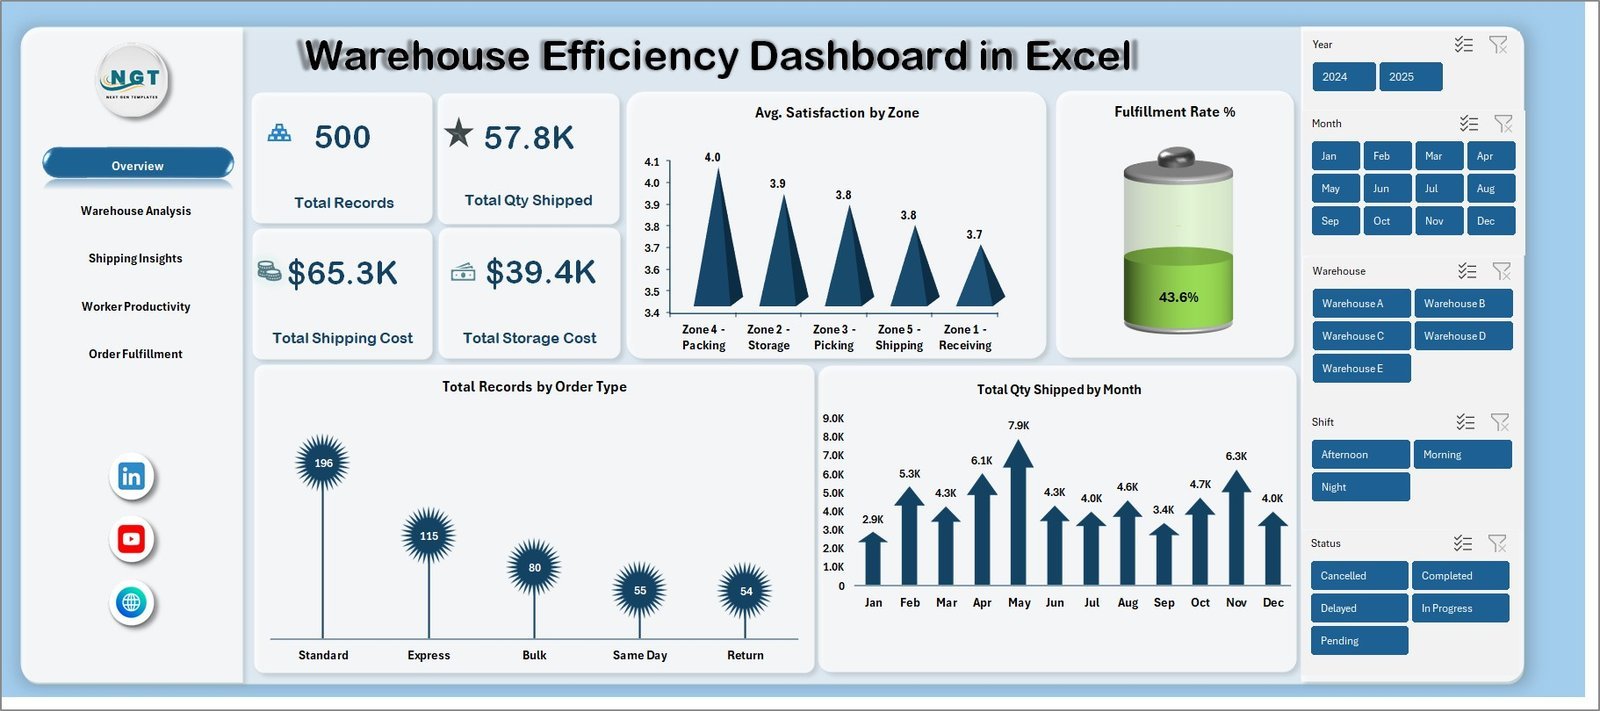
📈 Executive-Level KPI Cards — The Overview page displays KPI cards including Total Orders, Total Units Shipped, Order Fulfillment Rate, Avg Processing Time, and On-Time Shipment % — providing an instant health check of your warehouse operations at a glance.
🔄 Pivot-Powered Auto-Refresh — Every chart in the dashboard is connected to pivot tables in the Support sheet. Update your data, click Refresh All, and all 5 pages update instantly. No VBA or macros required — 100% formula and pivot-table driven.
📦 500-Row Sample Dataset — A pre-loaded sample dataset with 500 warehouse transaction records is included so you can explore the dashboard immediately. Simply replace the sample data with your own warehouse records and the entire dashboard auto-refreshes.
🔍 Built-in Slicers on Every Page — Filter by warehouse zone, product category, shift, worker name, order status, and time period across all dashboard pages for targeted analysis and executive presentations.
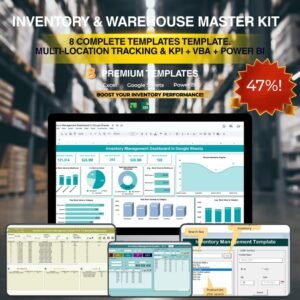
If you manage warehouse operations across multiple locations, consider the Inventory & Warehouse Master Kit which bundles 8 premium templates including Excel, Google Sheets, VBA, and Power BI tools at 36% savings. For complementary supply chain analytics, explore the Procurement Management Dashboard in Excel and the Trucking and Logistics Dashboard in Excel. Browse all available Excel Dashboard Templates on NextGenTemplates.
📦 What’s Inside the Warehouse Efficiency Dashboard in Excel
📌 Overview Page — KPI summary cards (Total Orders, Total Units Shipped, Order Fulfillment Rate, Avg Processing Time, On-Time Shipment %) plus analytical charts covering orders by warehouse zone, units shipped by month, order status distribution, and fulfillment rate by product category. Multiple slicers enable instant drill-down filtering.
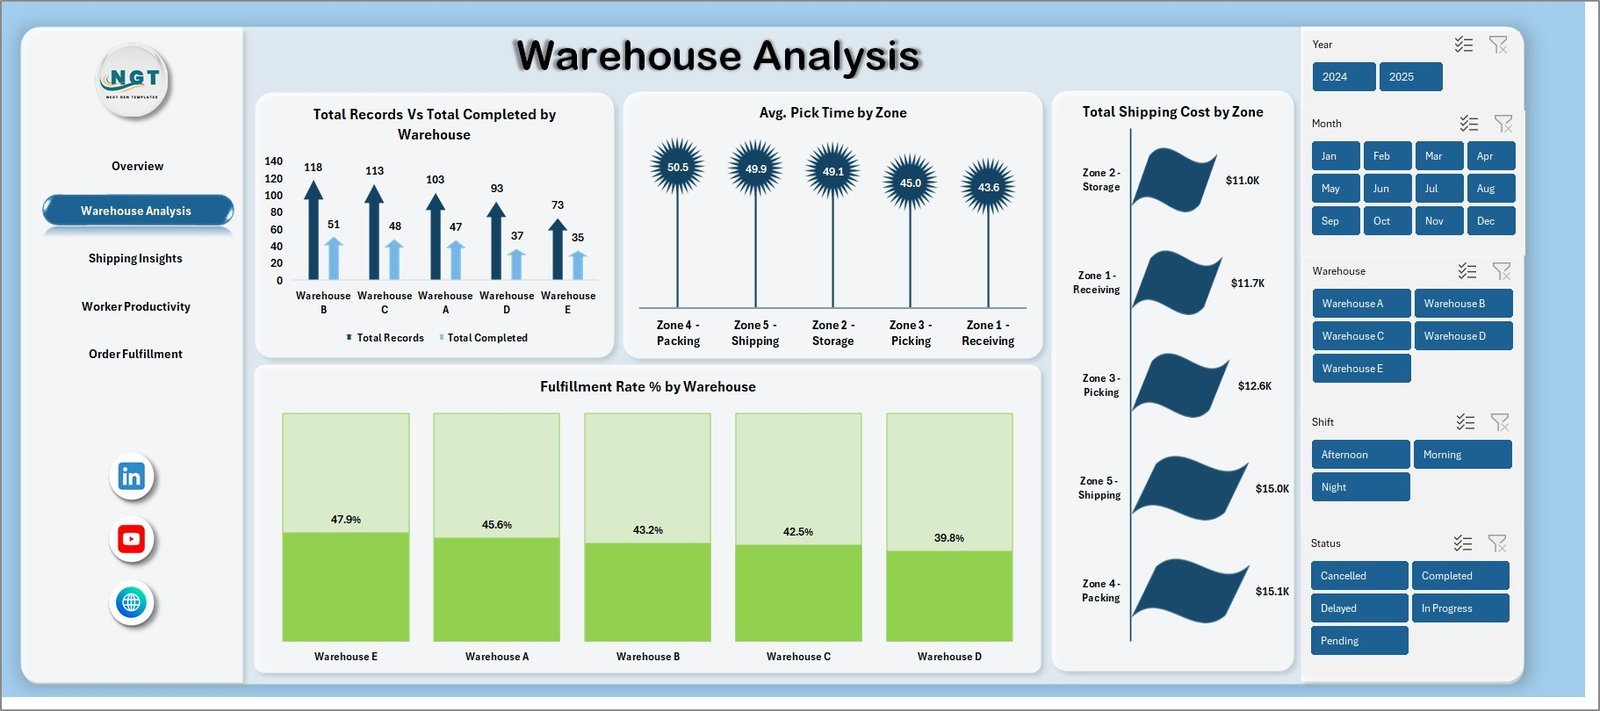
📌 Warehouse Analysis Page — Deep-dive into warehouse-level performance with inventory movement by category, stock turnover by zone, units received vs units shipped trends, and storage utilization analysis. Helps warehouse teams optimize stock rotation and reduce holding costs.
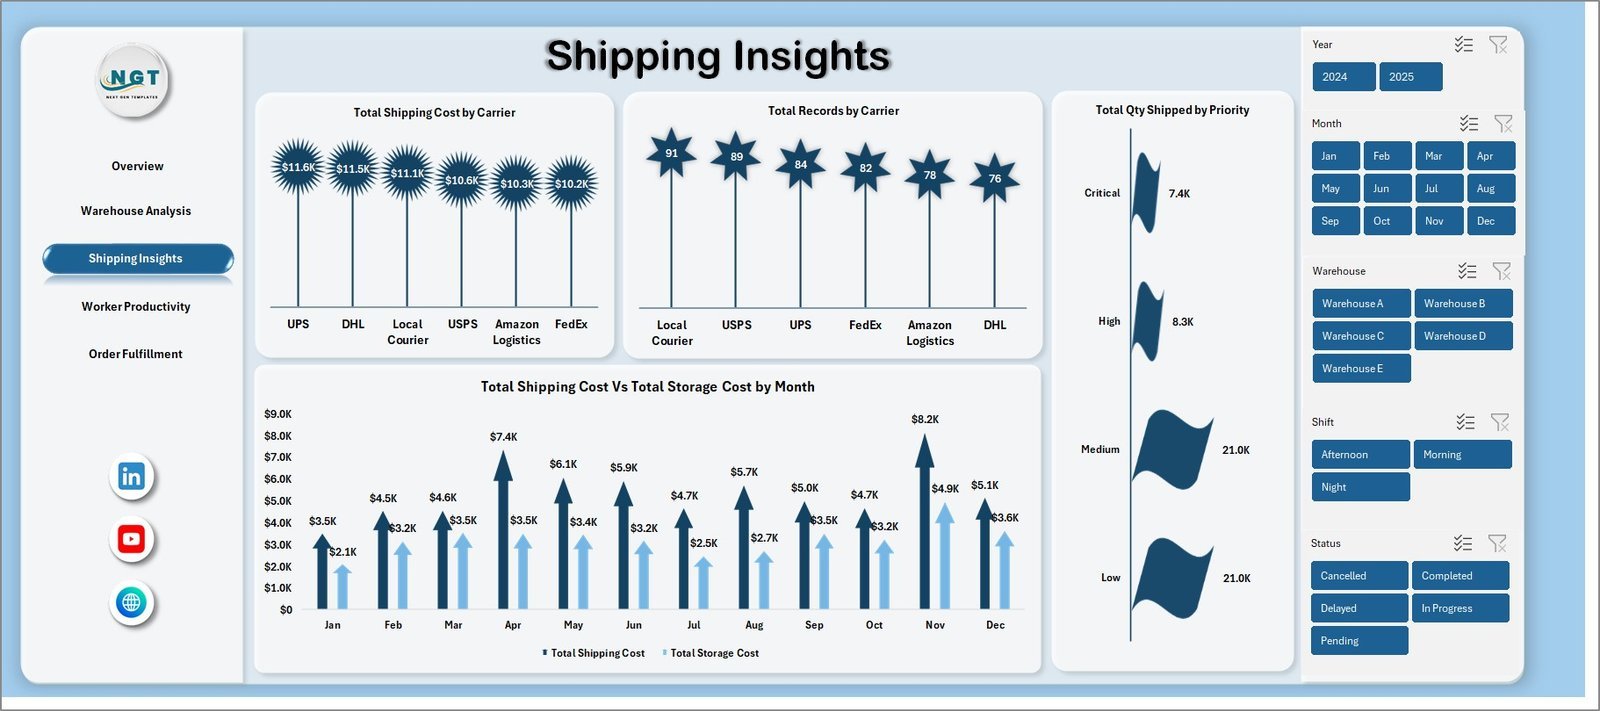
📌 Shipping Insights Page — Analyzes on-time shipment rates by carrier, shipping cost by zone, delivery delays by category, and monthly shipping volume trends. Supports logistics optimization and carrier selection decisions.
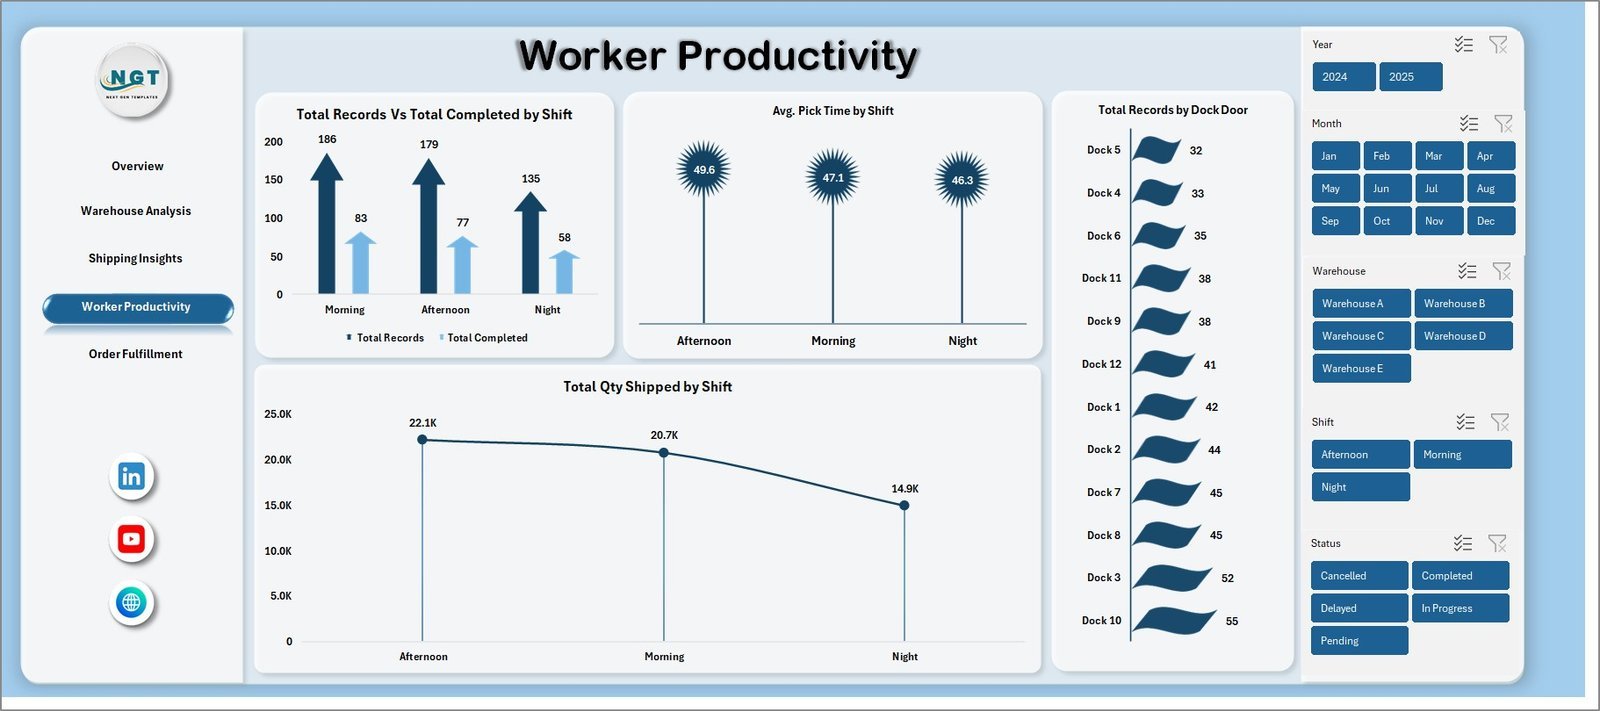
📌 Worker Productivity Page — Compares worker performance by orders processed, units picked per shift, processing time by worker, and shift-level productivity analysis. Critical for workforce planning and performance evaluations.
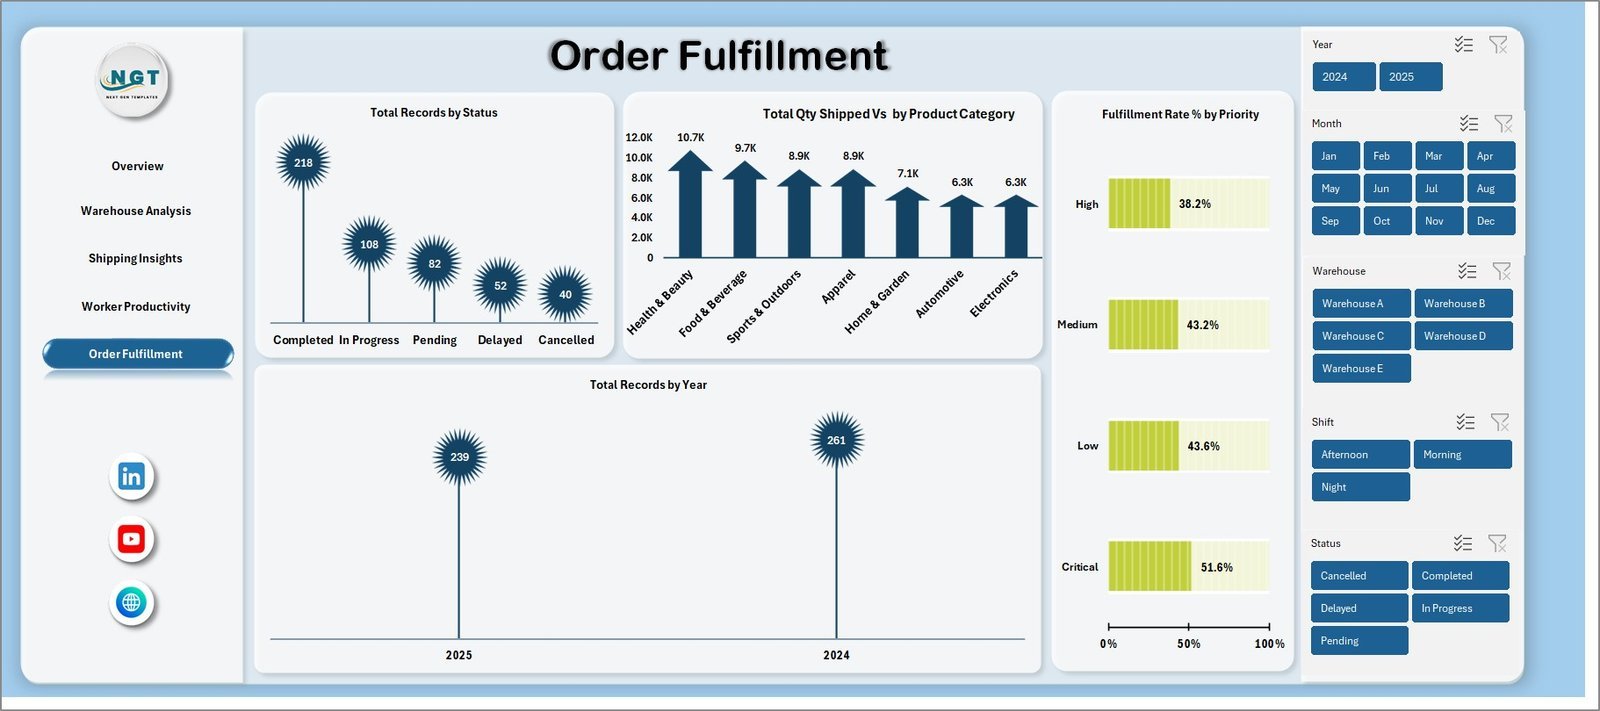
📌 Order Fulfillment Page — Tracks fulfillment rates by zone, orders by status and priority, average processing time by category, and fulfillment trends over time. Essential for identifying bottlenecks in order processing workflows.
📌 Data Sheet — Structured data entry sheet with 500 pre-loaded sample records including order date, warehouse zone, product category, worker name, shift, units, processing time, order status, shipment status, carrier, and cost fields.
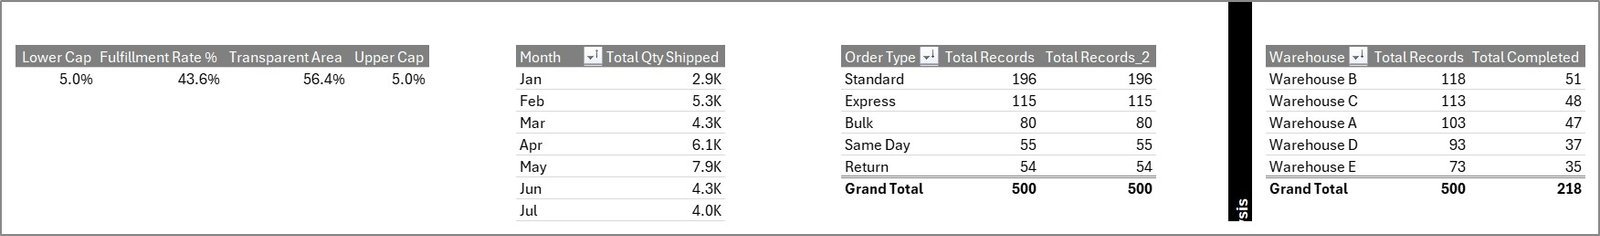
📌 Support Sheet — Contains all pivot tables powering the dashboard charts and KPI cards. Click Refresh All in the Data tab after updating data to auto-refresh everything.
⚙️ How to Use the Warehouse Efficiency Dashboard in Excel
1️⃣ Open the downloaded Excel file in Microsoft Excel 2016 or later.
2️⃣ Navigate to the Data Sheet tab and replace the sample data with your own warehouse transaction records, keeping the same column structure.
3️⃣ Go to the Data tab in the Excel Ribbon and click Refresh All to update all pivot tables and charts across all 5 dashboard pages.
4️⃣ Use the built-in slicers on each dashboard page to filter by warehouse zone, product category, shift, worker, or time period.
5️⃣ Present the dashboard pages directly to stakeholders or hide the Support Sheet for a clean executive view.
👥 Who Can Benefit from This Warehouse Efficiency Dashboard in Excel
📦 Warehouse Managers — Monitor daily throughput, picking accuracy, and order fulfillment across zones and shifts.
📦 Supply Chain Directors — Get executive-level visibility into warehouse performance, inventory turnover, and shipping efficiency.
📦 Operations Teams — Track workforce productivity, processing times, and identify operational bottlenecks quickly.
📦 Logistics Coordinators — Analyze carrier performance, shipping costs, and on-time delivery rates to optimize logistics.
📦 Small Business Owners — Run professional warehouse analytics without investing in expensive warehouse management software.
❓ Frequently Asked Questions
What KPIs does the Warehouse Efficiency Dashboard in Excel track?
The Warehouse Efficiency Dashboard in Excel tracks key performance indicators including Total Orders, Total Units Shipped, Order Fulfillment Rate, Avg Processing Time, and On-Time Shipment %. These KPIs are displayed on the Overview page through interactive KPI cards and are analyzed across all 5 dashboard pages.
Do I need VBA or macros to use this warehouse dashboard?
No. The Warehouse Efficiency Dashboard in Excel is 100% formula and pivot-table based. No VBA or macros are needed. It works in Microsoft Excel 2016 and later versions without enabling macros, making it safe, lightweight, and accessible for any user.
How do I update the dashboard with my own warehouse data?
Navigate to the Data Sheet tab, replace the 500 sample records with your own warehouse transaction data in the same column format, then click Refresh All in the Data tab. All pivot tables and charts across all 5 dashboard pages will update instantly.
Can I track warehouse worker productivity with this Excel template?
Yes. The Worker Productivity page includes dedicated charts comparing orders processed by worker, units picked per shift, processing time by worker, and shift-level productivity trends. Use slicers to filter by specific workers for individual performance reviews.
What is the best Excel template for tracking warehouse efficiency?
The Warehouse Efficiency Dashboard in Excel from NextGenTemplates is one of the most comprehensive warehouse analytics templates available. It features 5 interactive dashboard pages — Overview, Warehouse Analysis, Shipping Insights, Worker Productivity, and Order Fulfillment — all powered by pivot tables with automatic refresh.
Can I customize this dashboard for my specific warehouse setup?
Yes. The dashboard is fully unlocked and editable in Microsoft Excel. You can modify charts, add new KPIs, change color themes, adjust slicer options, add new data columns, and connect it to your own warehouse data structure. All pivot tables and formulas are accessible for complete customization.
🔗 Explore Related Templates
🔹 Inventory & Warehouse Master Kit — Bundle of 8 premium inventory and warehouse templates for Excel, Google Sheets, VBA, and Power BI at 36% savings.
🔹 Procurement Management Dashboard in Excel — Track procurement spending, supplier performance, and budget compliance across 5 interactive pages.
🔹 Trucking and Logistics Dashboard in Excel — Monitor fleet operations, driver performance, route analysis, and financial trends.
📖 Click here to read the Detailed Blog Post
Watch the step-by-step video tutorial:


Reviews
There are no reviews yet.