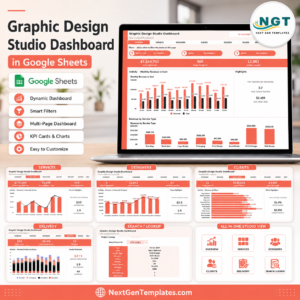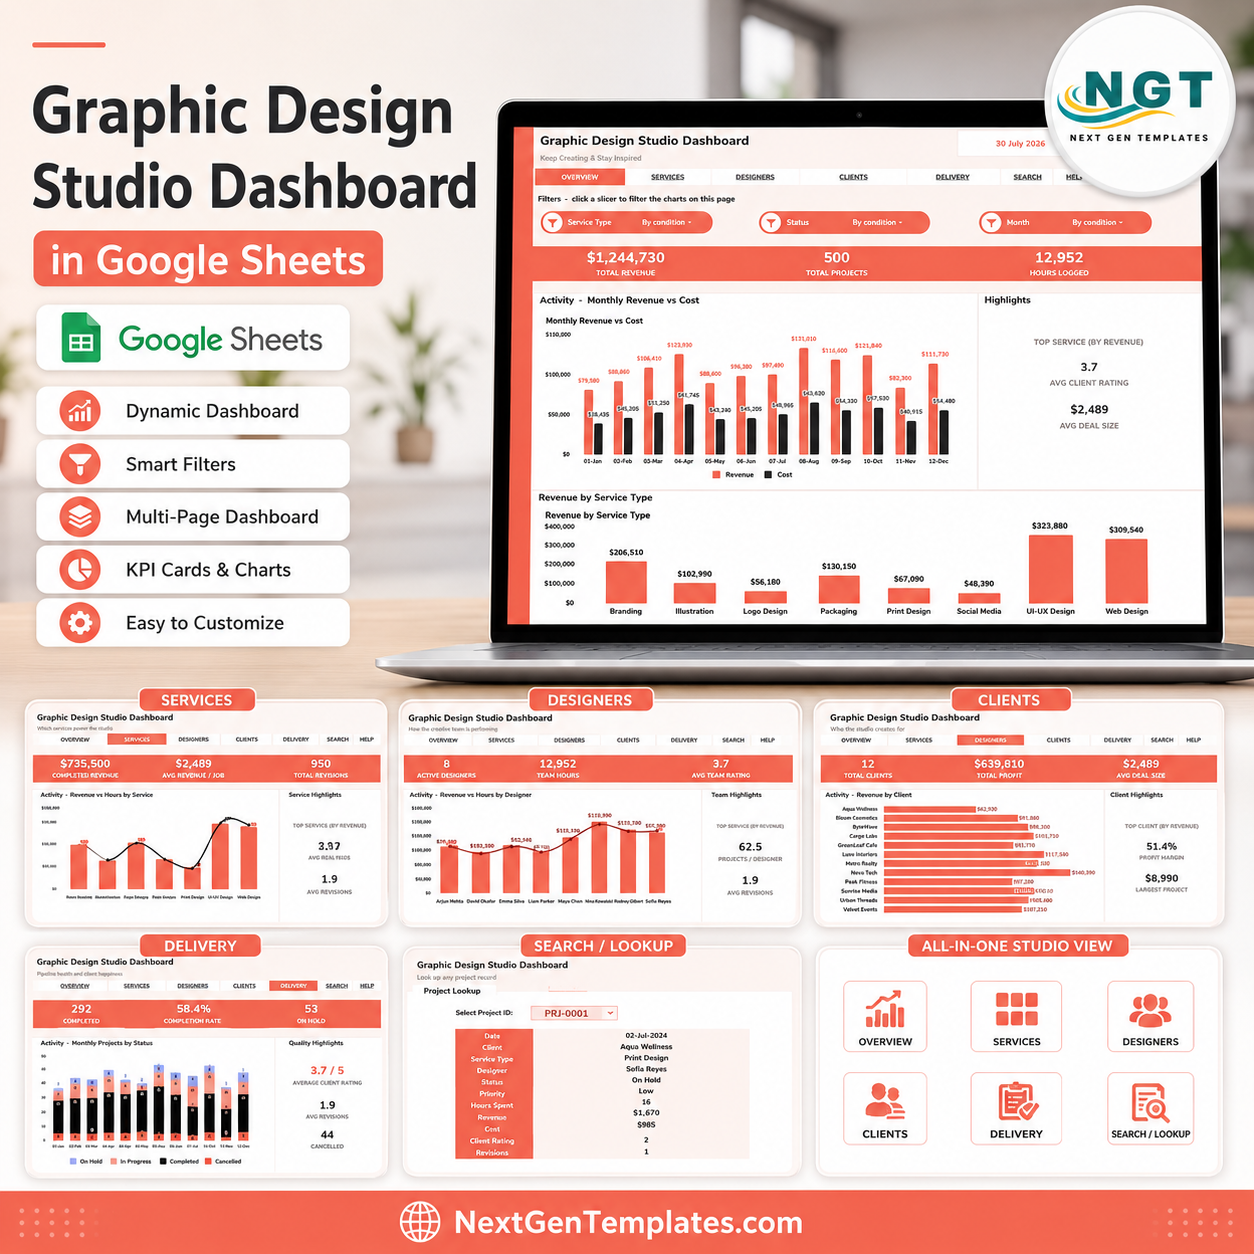
The U.S. Bureau of Labor Statistics projects about 20,000 graphic designer openings each year from 2024 to 2034, even while employment grows 2 percent. The Graphic Design Studio Dashboard in Google Sheets helps studio owners, creative directors, project managers, and freelance design teams turn project rows into a clear studio performance workbook. Built by PK, whose spreadsheet tutorials reach 300K+ subscribers across YouTube channels, this one-time $9.99 template gives you editable reporting in your own Google Drive instead of another monthly SaaS tool. Review the screenshots, copy the file, replace the sample data, and keep control of your own reporting setup.
Source: U.S. Bureau of Labor Statistics, Graphic Designers Occupational Outlook Handbook.
Key Features of Graphic Design Studio Dashboard in Google Sheets
- 7 practical sheet tabs: Overview, Service Studio, Creative Team, Client Portfolio, Delivery Desk, Search Sheet, and Data Sheet.
- 8 headline cards: Total Revenue, Total Projects, Hours Logged, Designers, Clients, Services, Avg Client Rating, and Avg Deal Size.
- 24 ready-made chart views: Review revenue, cost, hours, service mix, designers, clients, revisions, ratings, profit, and delivery quality.
- Multiple slicers: Filter dashboard pages quickly during weekly production meetings, client reviews, or monthly performance reporting.
- Service analysis: Compare revenue, hours, average job effort, revisions, and top service categories.
- Creative team analysis: Review designer revenue, monthly projects, project count, revisions, and top contributors.
- Client portfolio view: Track client revenue, profit, margin, monthly trend, and largest project value.
- Delivery desk reporting: Monitor status, rating distribution, delivery quality, revision load, and high-revision services.
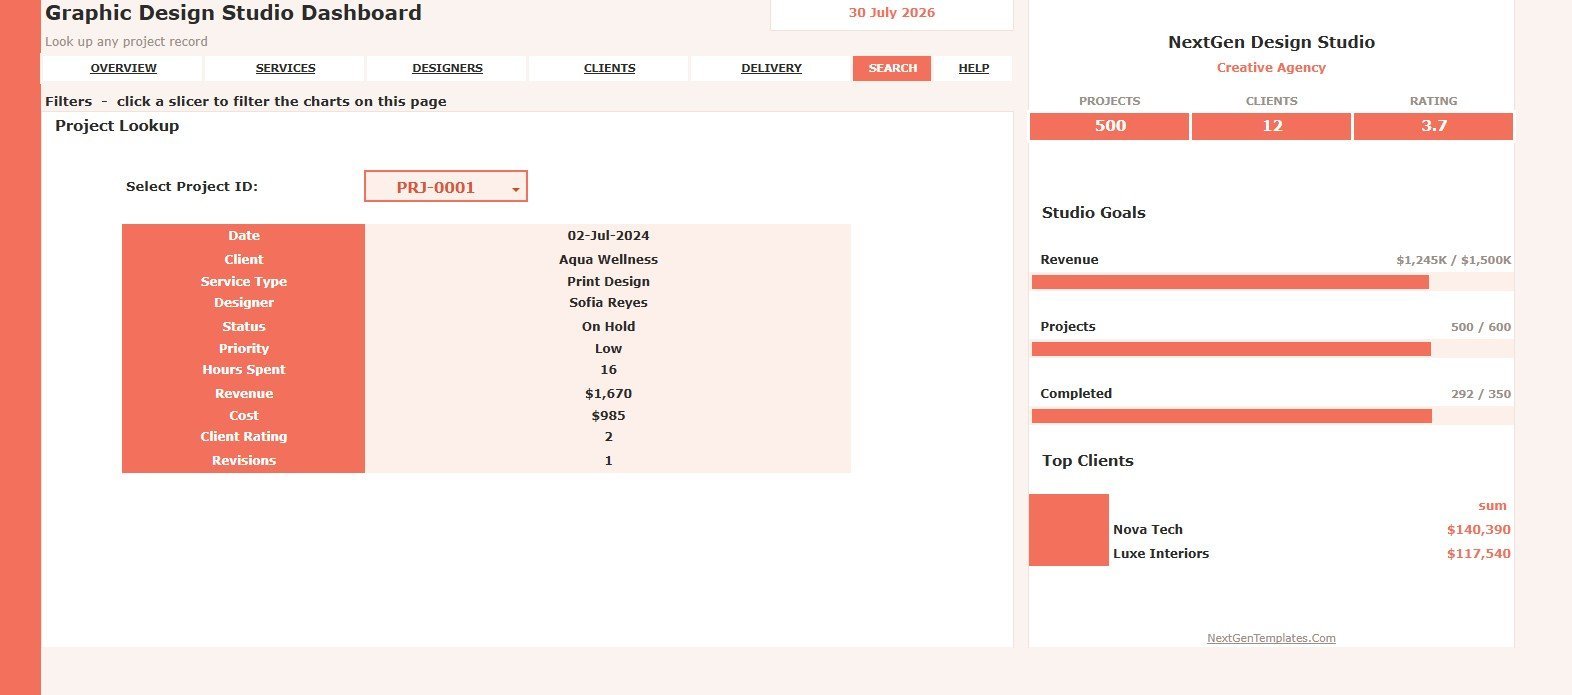
- Search Sheet lookup: Select a Project ID and instantly view the matching project details.
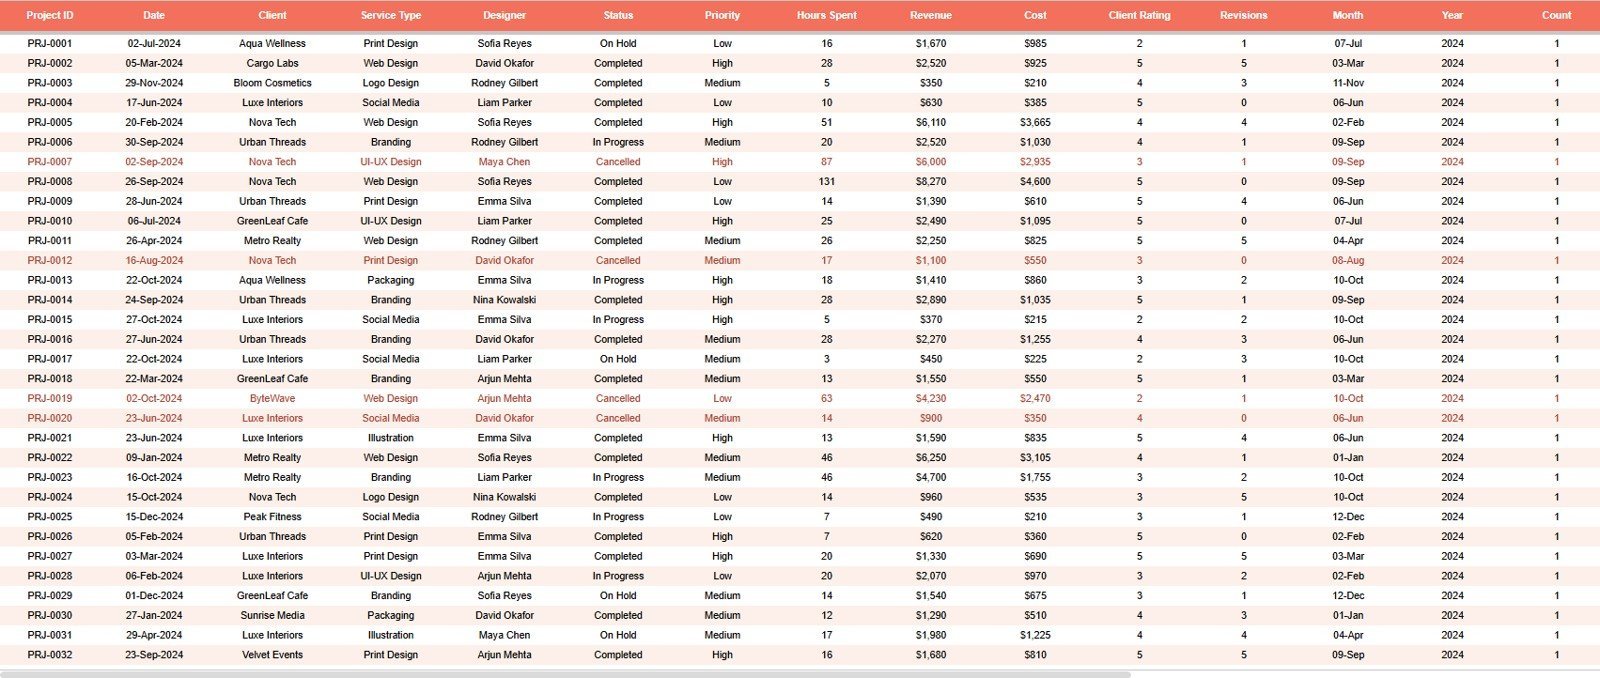
- Editable Data Sheet: Replace sample rows in the same format so cards, charts, slicers, and lookup logic stay connected.
What’s Inside the Graphic Design Studio Dashboard in Google Sheets
1 – Overview Page
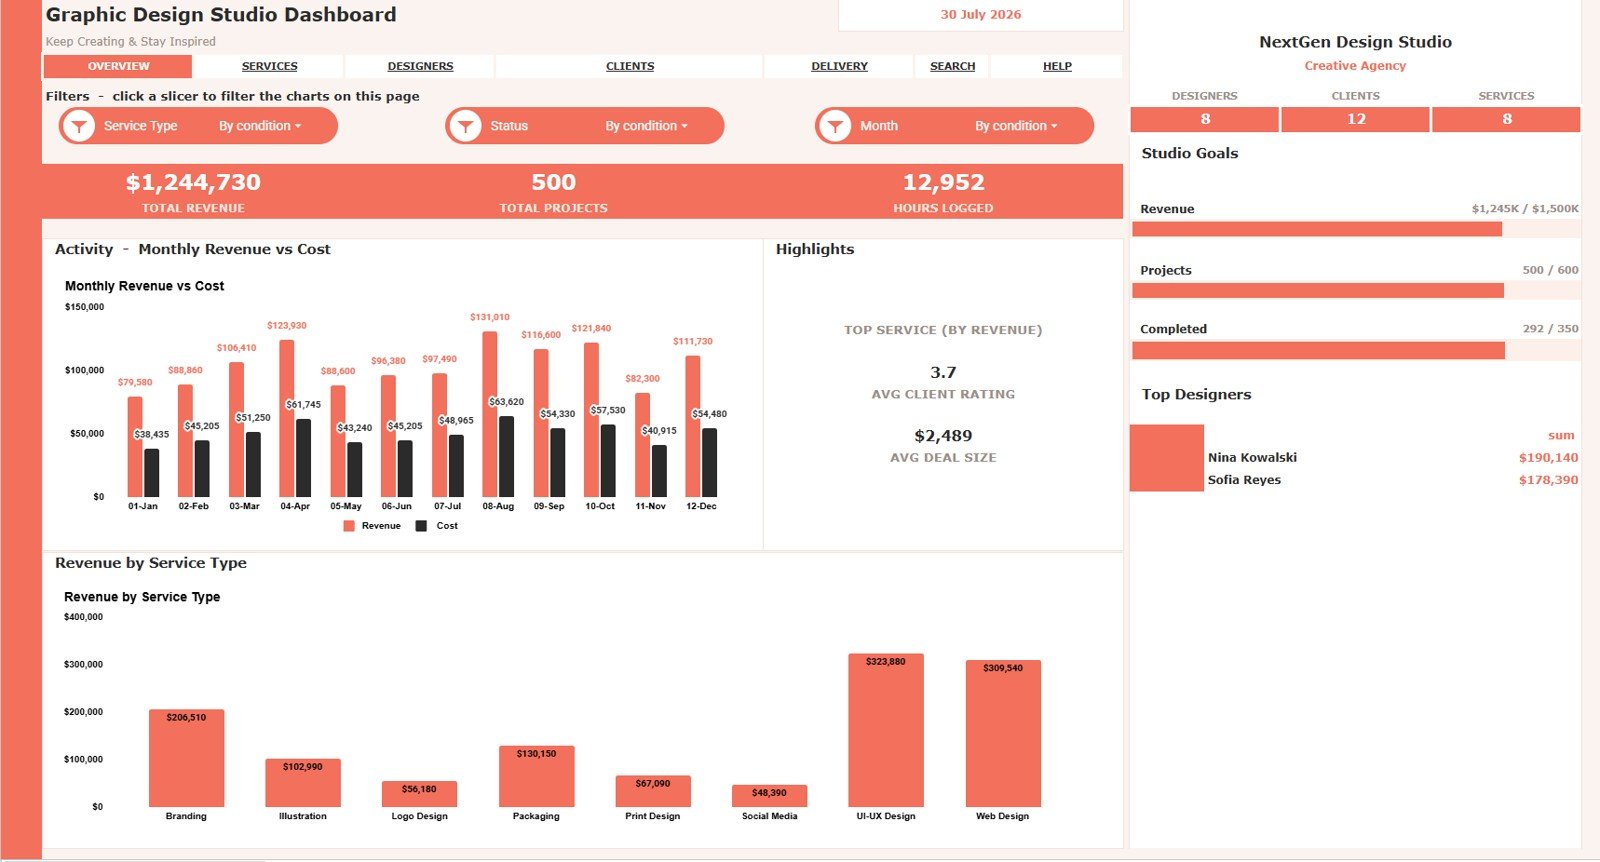
The Overview page gives studio leaders a fast read on high-level performance. The top cards show Total Revenue, Total Projects, Hours Logged, Designers, Clients, Services, Avg Client Rating, and Avg Deal Size before users move into the charts.
Monthly Revenue and Cost by Month: This chart compares revenue with cost across each month. It helps show whether higher studio activity is also producing healthier margin.
Revenue by Service Type: This view breaks revenue down by design service category. It helps identify which services carry the strongest income contribution.
Top Designer Revenue by Designer: This chart ranks designers by revenue contribution. It helps owners recognize top performers and balance work across the creative team.
Studio Goal Progress by Goal: This chart shows progress against studio goals. It helps connect daily delivery activity with larger business targets.
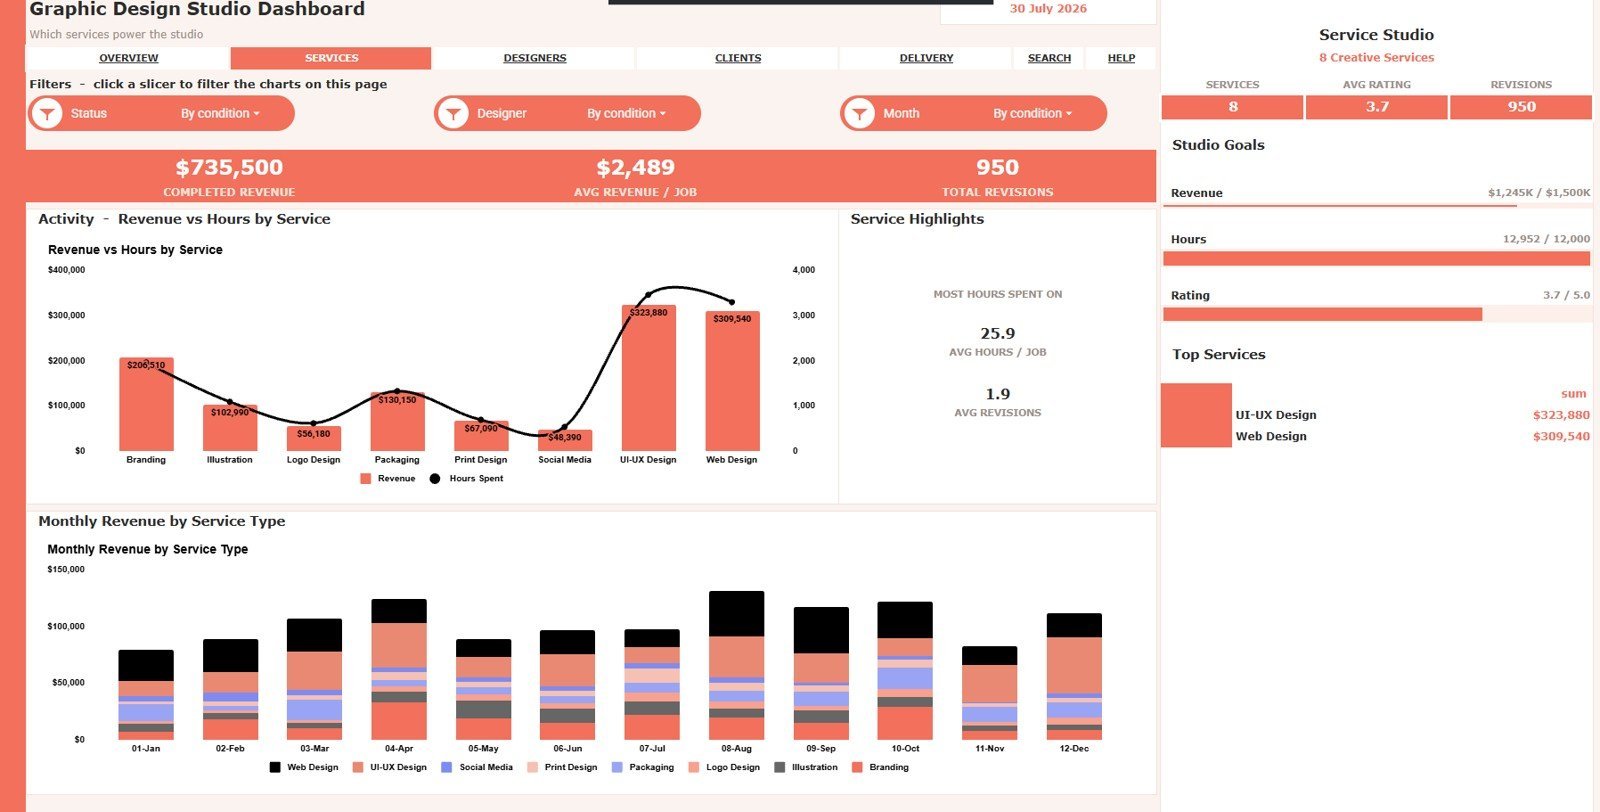
2 – Service Studio
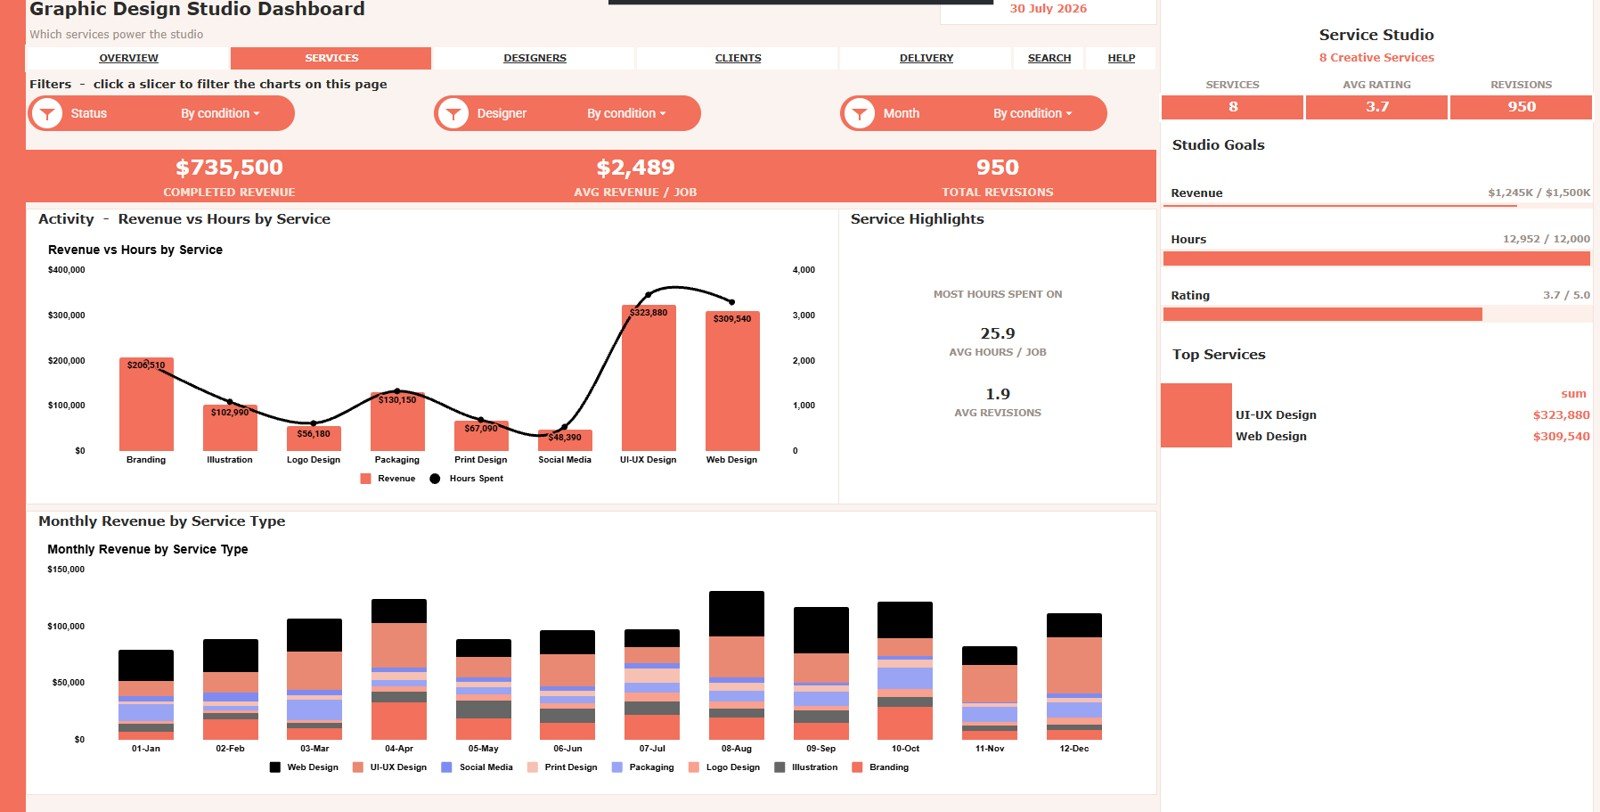
The Service Studio tab focuses on the work mix. It helps compare services by money earned, time consumed, revisions required, and monthly movement.
Revenue and Hours by Service: This chart compares service revenue with hours spent. It helps separate profitable services from time-heavy services that may need pricing review.
Monthly Revenue by Service Type: This trend shows how each service type performs across months. It helps spot seasonal demand or growth in specific design offers.
Average Hours per Job by Service: This chart shows average job effort by service. It helps managers estimate capacity before accepting new work.
Average Revisions by Service: This chart compares revision load by service category. It helps identify services that may need clearer briefs, scope rules, or client education.
Top Service Revenue by Service: This view ranks services by revenue. It helps decide which services deserve more marketing, packaging, or upsell attention.
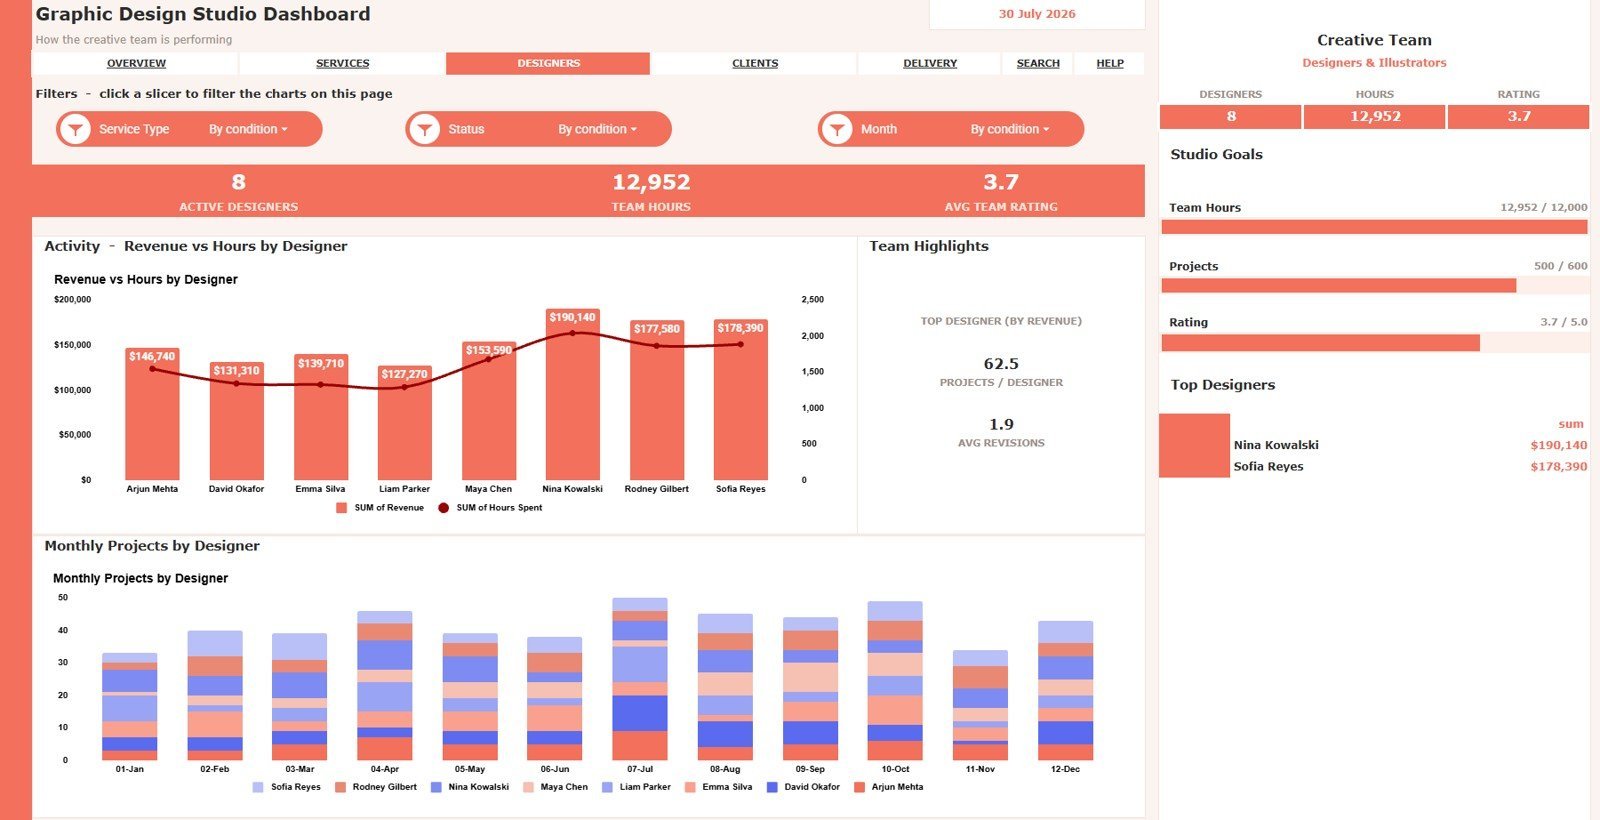
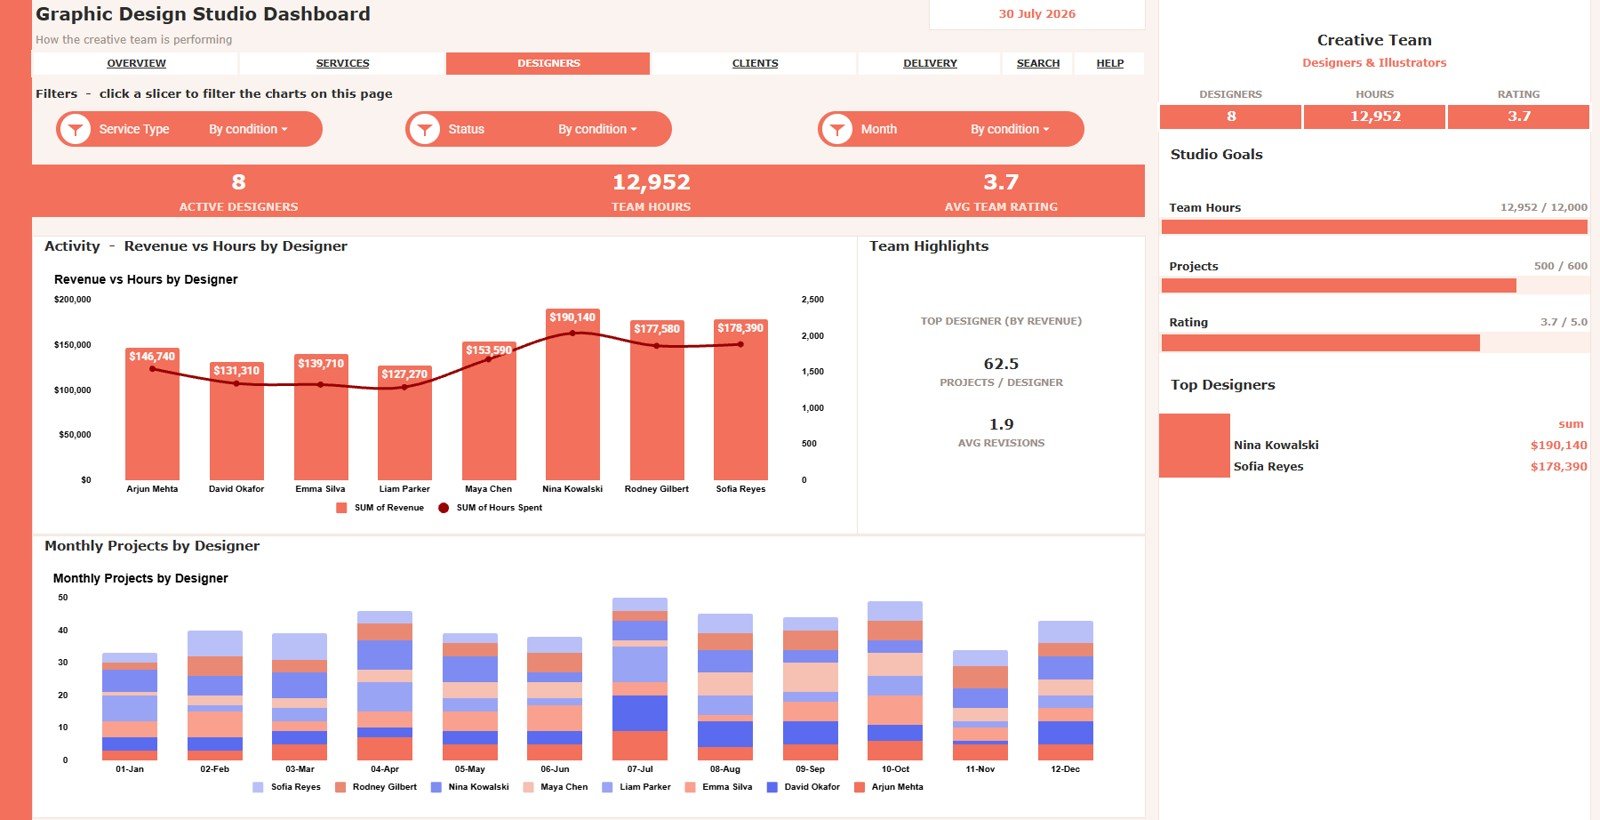
3 – Creative Team
The Creative Team tab gives a designer-level view of workload and revenue. It is useful for team leads who need to understand contribution, project volume, and revision patterns by designer.
Revenue and Hours by Designer: This chart compares designer revenue with hours logged. It helps show who is driving revenue and where effort is concentrated.
Monthly Projects by Designer: This chart shows designer project volume by month. It helps identify workload spikes and assignment balance.
Projects per Designer by Designer: This view ranks project count by designer. It helps compare output volume without opening the raw data sheet.
Average Revisions by Designer: This chart compares average revision count by designer. It helps review whether certain project types, clients, or handoff patterns are creating rework.
Top Designer Revenue by Designer: This chart highlights top revenue contributors. It supports recognition, staffing, and future resource planning.
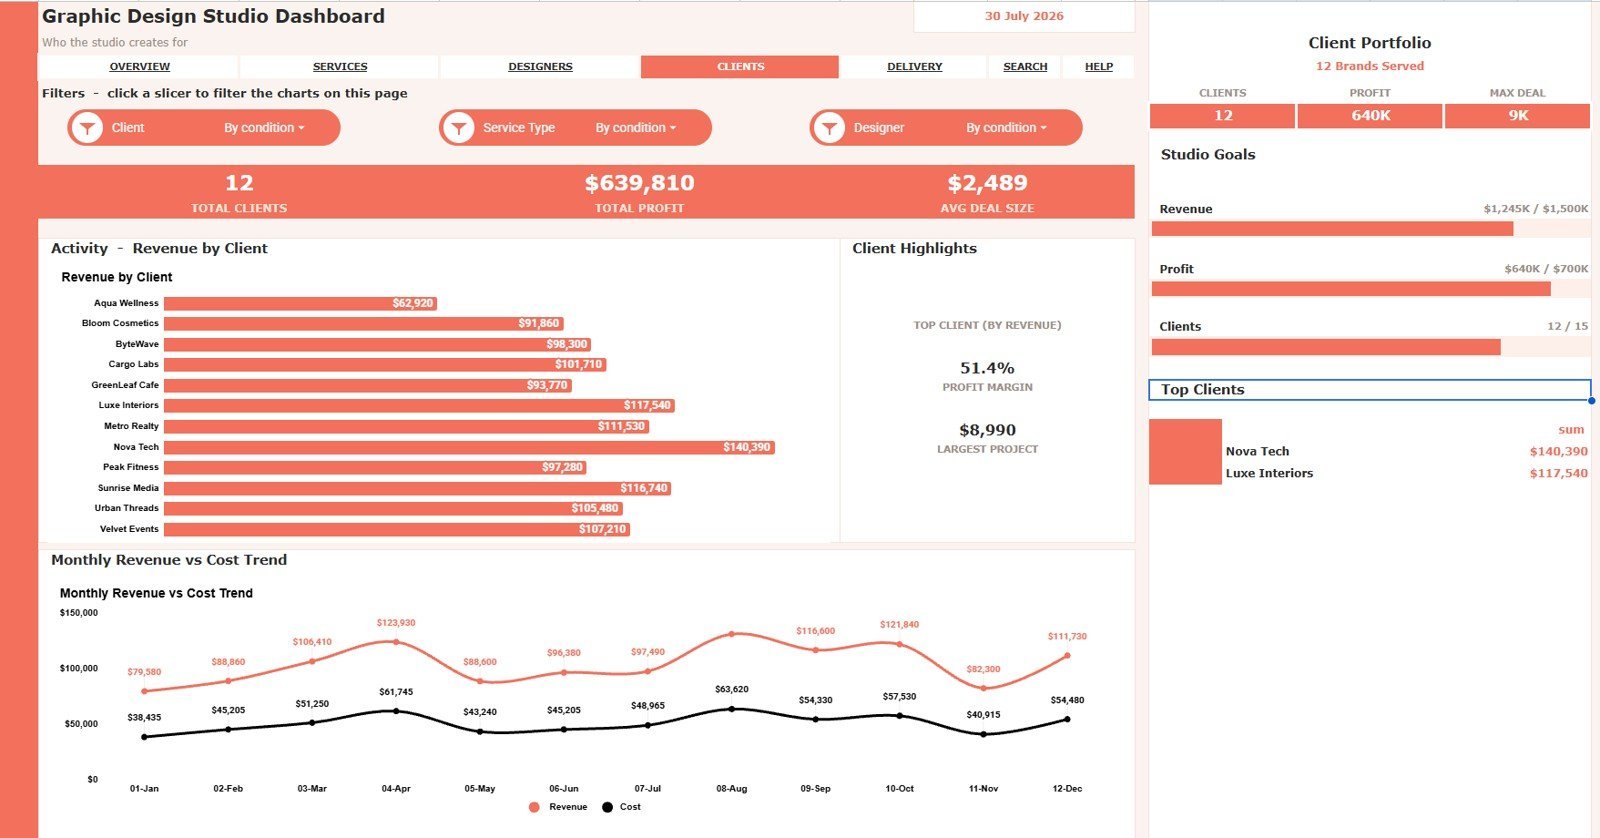
4 – Client Portfolio
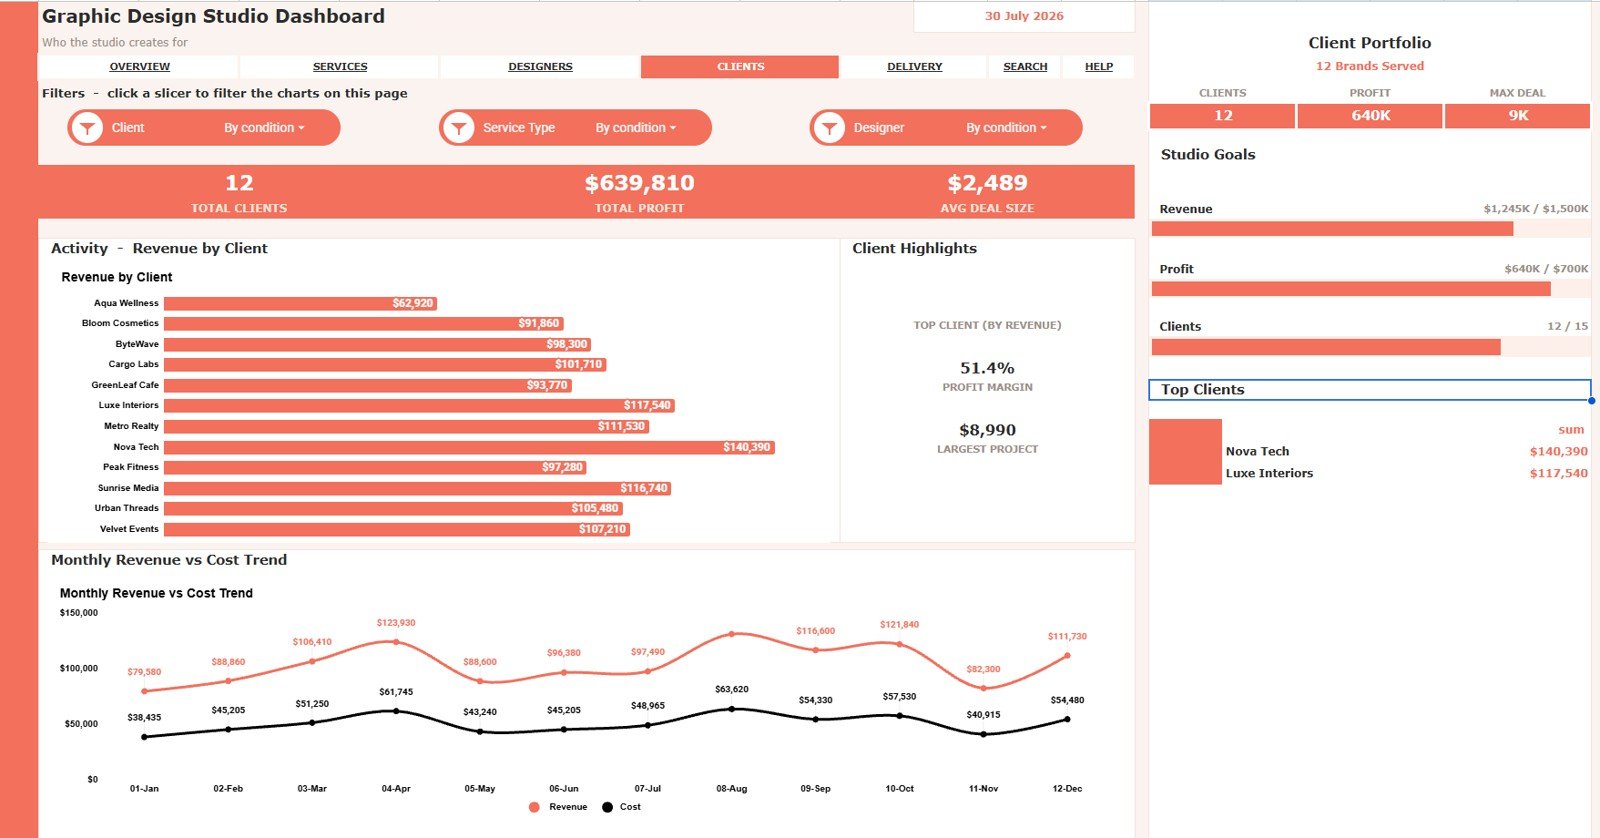
The Client Portfolio tab reviews clients from revenue, cost, profit, margin, and project-value angles. It helps studios move beyond top-line billing and understand which relationships are most valuable.
Revenue by Client: This chart ranks client revenue. It helps identify key accounts and concentration risk.
Monthly Revenue and Cost by Month: This trend compares monthly income with cost. It helps owners see whether monthly revenue is supported by strong profitability.
Profit by Client: This chart compares profit across clients. It helps reveal accounts that may look large but produce weaker net results.
Profit Margin by Client Portfolio: This view compares margin by client portfolio. It helps prioritize accounts that combine revenue with healthy margin.
Largest Project Value by Client: This chart shows each client’s largest project value. It helps spot clients with upsell potential or major project history.
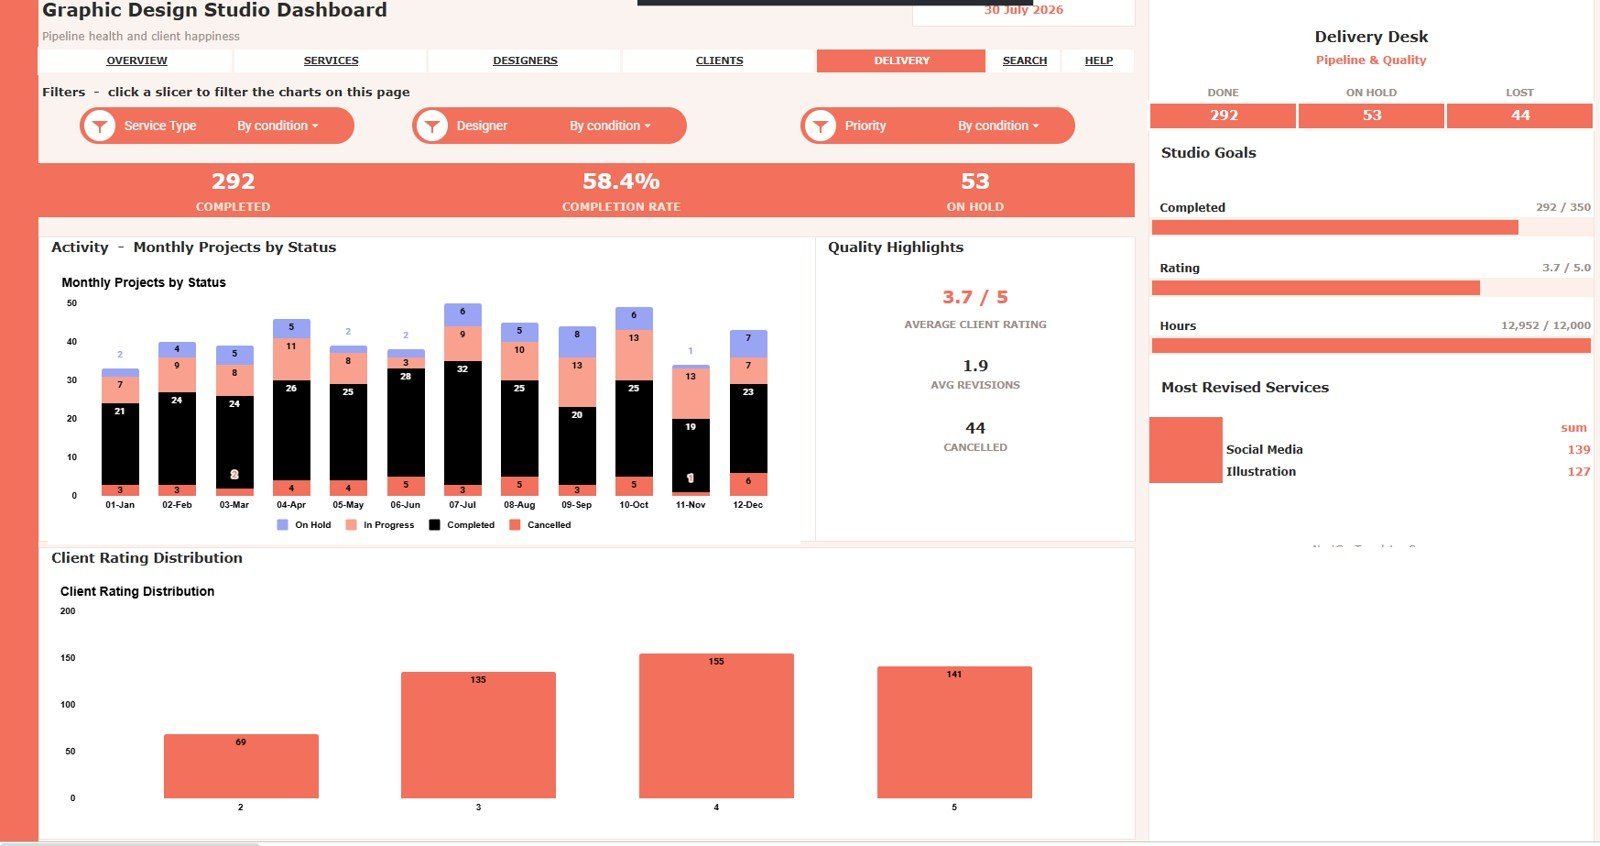
5 – Delivery Desk
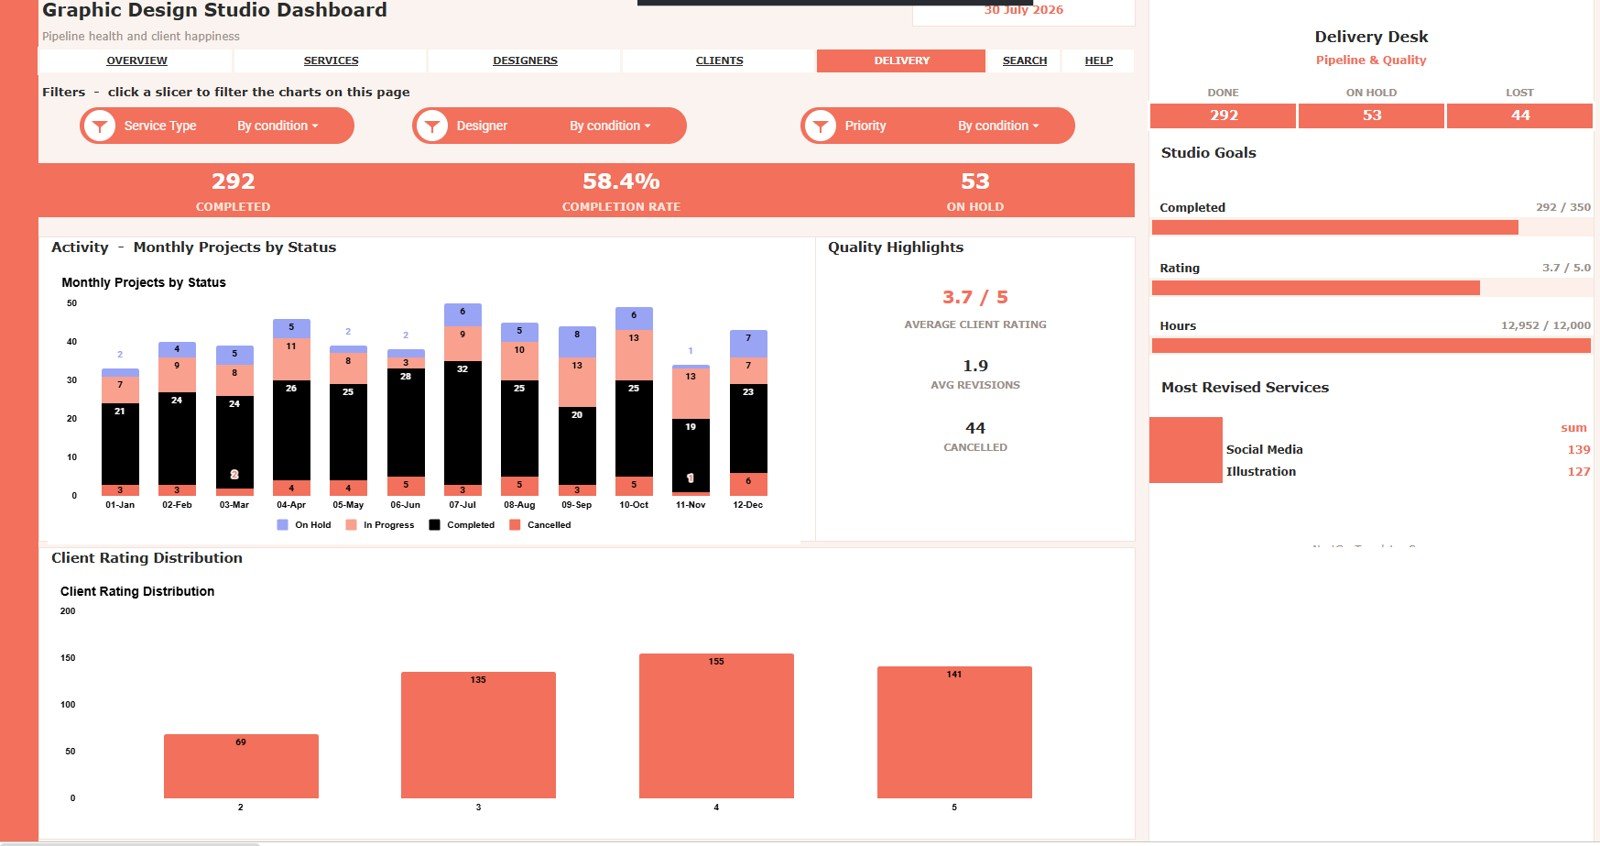
The Delivery Desk tab focuses on operational follow-through. It helps teams review status, ratings, quality, revisions, and services that need delivery attention.
Monthly Projects by Status: This chart groups project status by month. It helps show whether work is moving through the studio or piling up in a status bucket.
Client Rating Count by Rating: This chart counts client ratings. It helps review satisfaction distribution rather than only an average rating.
Average Client Rating by Delivery Quality: This view connects quality labels with client ratings. It helps determine whether delivery quality is reflected in client feedback.
Average Revisions by Delivery Quality: This chart compares revision count by quality group. It helps see whether lower quality labels are also creating more rework.
Most Revised Services by Service: This view identifies services with the highest revision load. It helps prioritize scope notes, creative briefs, and process fixes.
6 – Search Sheet Tab
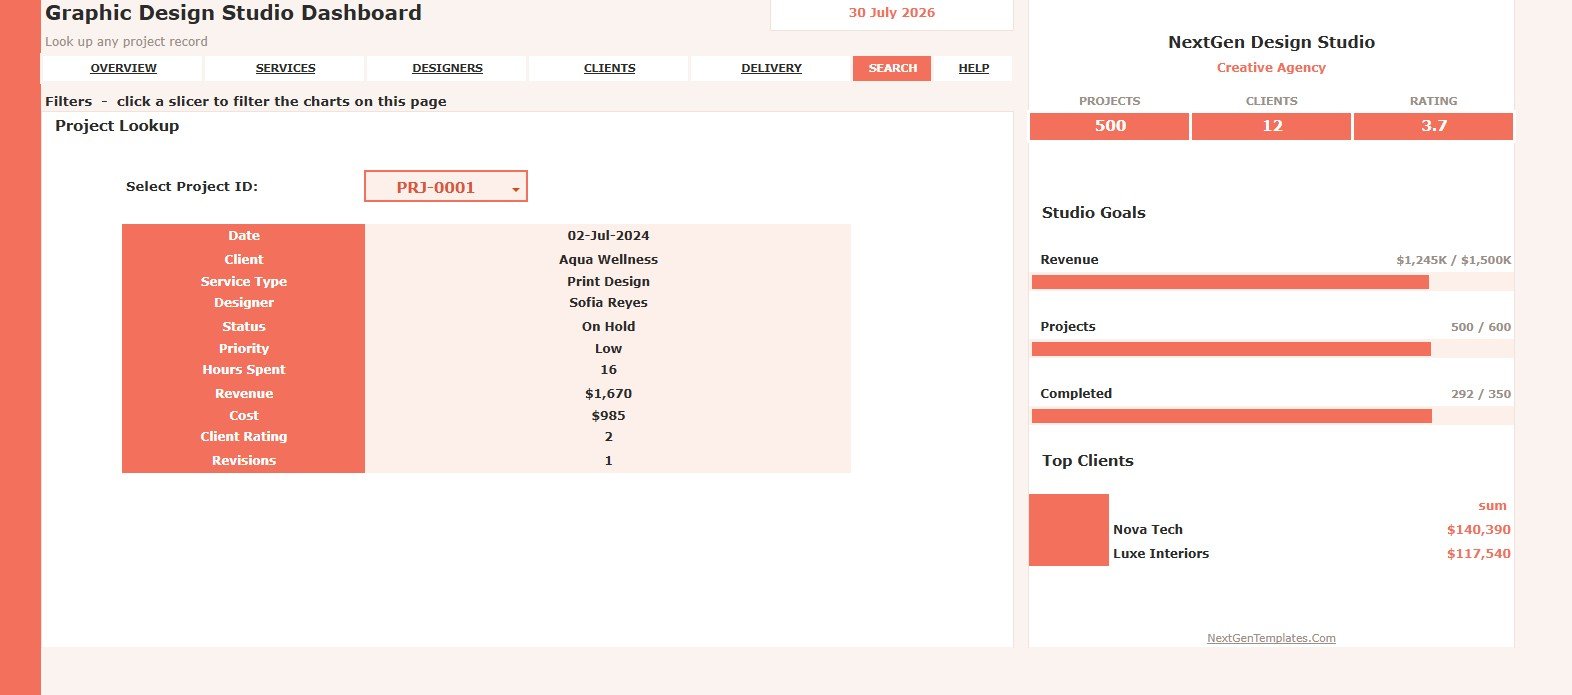
The Search Sheet lets you select a Project ID and instantly view the matching project details, including date, client, service type, designer, status, priority, hours spent, revenue, cost, client rating, and revisions.
7 – Data Sheet Tab
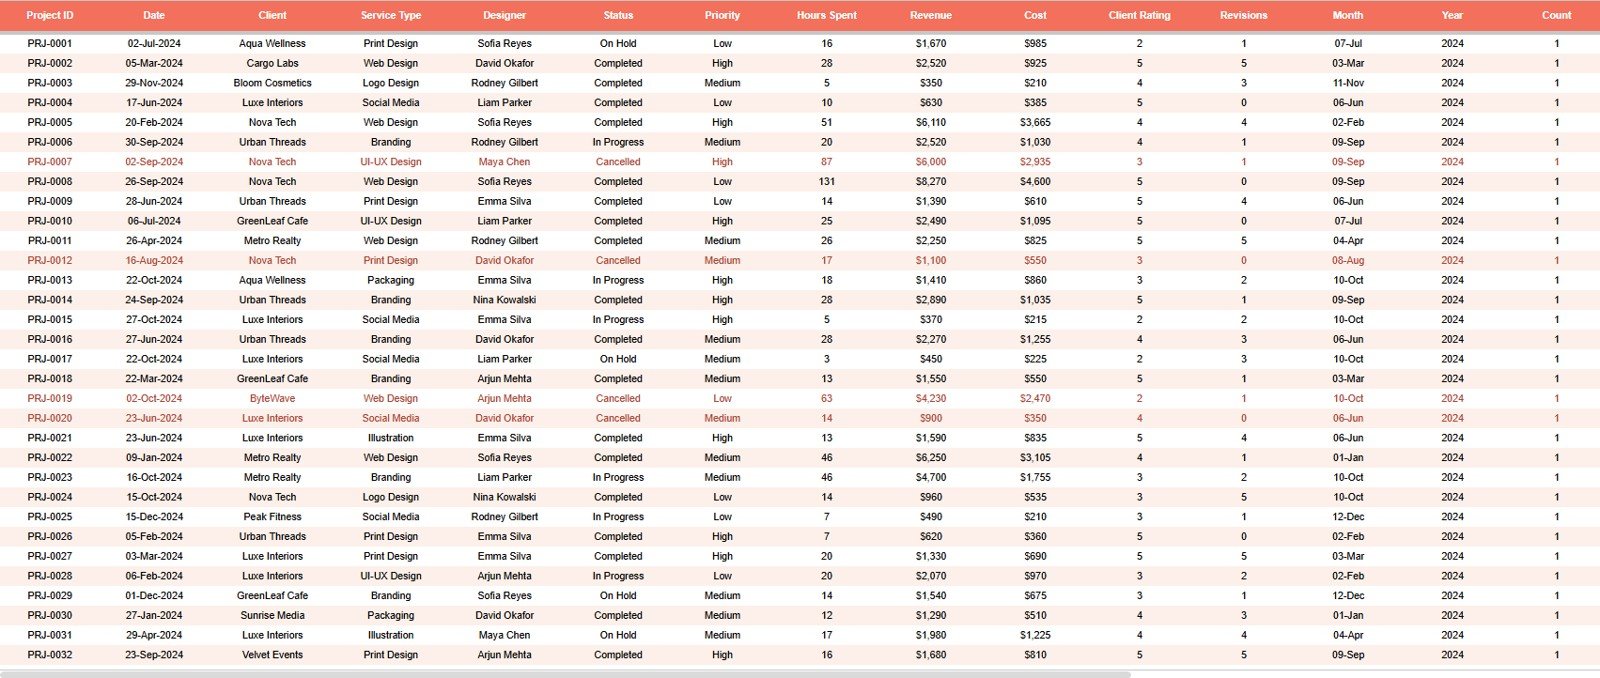
The Data Sheet is where you add your own records in the same format as the sample data. Keeping the columns consistent helps every dashboard page, chart, slicer, and Project ID lookup continue to work correctly.
Graphic Design Studio Dashboard in Google Sheets vs. Microsoft Excel Dashboard vs. Paid CRM/SaaS – Where This Fits
| Feature | This Google Sheets dashboard | Microsoft Excel dashboard | Paid CRM/SaaS |
|---|---|---|---|
| Cost | $9.99 one-time sale price | Template cost plus Microsoft access where needed | Monthly or annual subscription |
| Platform | Google Sheets in Google Drive | Excel desktop or web | Vendor-hosted cloud app |
| Setup time | Copy the file and replace sample rows | Open workbook and adjust data | Account setup, workflows, and permissions |
| Real-time collaboration | Native Google Drive sharing | Best with OneDrive or SharePoint | Usually included by user seat |
| Mobile access | Google Sheets app or browser | Excel app or browser | Usually included |
| Customizable fields | Editable sheet structure, labels, formulas, and charts | Editable workbook structure | Limited by vendor settings |
| Share with link | Yes, with Drive permissions | Yes, with compatible Microsoft sharing | Usually account based |
| Year-1 cost at 5 users | $9.99 template price before any Google Workspace costs | Template plus license costs where applicable | Often hundreds or thousands per year |
| Design studio reporting | Service, designer, client, delivery, search, and data tabs included | Requires a similar workbook design | Often broader project tools, not always studio analytics |
Who This Template Is For – and Who It’s Not For
Best for: graphic design studios, creative agencies, freelance design teams, brand studios, marketing design teams, design operations managers, and studio owners who already track projects in spreadsheets.
Not the right fit for: teams that need automatic time tracking, contract generation, proposal automation, client portals, payment collection, Adobe or Figma integrations, or formal approval workflows inside the same tool. This is a reporting dashboard, not a full creative operations platform.
How to Use the Graphic Design Studio Dashboard in Google Sheets
- Open the included PDF guide after purchase and create your own Google Sheets copy.
- Go to the Data Sheet tab and replace the sample rows with your studio project records.
- Keep the same columns for Project ID, date, client, service type, designer, status, priority, hours, revenue, cost, rating, and revisions.
- Review the Overview page first for cards and studio-wide trends.
- Use Service Studio, Creative Team, Client Portfolio, and Delivery Desk for deeper analysis.
- Use Search Sheet when a single Project ID needs quick review.
Real-World Use Cases
Maya, studio owner: reviews Total Revenue, Avg Deal Size, and Monthly Revenue and Cost before deciding whether to hire another designer.
Jordan, creative project manager: checks Monthly Projects by Status and Most Revised Services before a production meeting so blockers and rework are visible.
Priya, agency operations lead: compares Profit by Client and Revenue by Service Type before updating retainers, project packages, and client account priorities.
Frequently Asked Questions
Does this template work only in Google Sheets?
Yes. This version is designed for Google Sheets and is meant to be copied into your own Google Drive.
What data should I enter in the Data Sheet?
Enter one row per design project using the same format, including project ID, date, client, service type, designer, status, priority, hours, revenue, cost, client rating, and revisions.
Does it include a Search Sheet?
Yes. Select a Project ID and the Search Sheet returns the matching project details in one place.
Can my team collaborate in the file?
Yes. You can share the copied Google Sheet through Google Drive with view, comment, or edit permissions.
Can I customize the charts and labels?
Yes. The file is editable, but preserve source ranges, formulas, and the Data Sheet structure unless you are comfortable updating the dashboard logic.
Is this a replacement for project management software?
No. It is best used as a studio analytics and reporting layer alongside your existing brief, file storage, approval, and invoicing workflows.
About the Author
Built by PK – Microsoft Certified Professional with 15+ years of Excel, Google Sheets, and Power BI experience. Founder of NextGenTemplates, reaching 300K+ subscribers across YouTube channels. Every template is hand-built and tested before release.
Explore Related Templates
- Architecture and Design Dashboard in Google Sheets
- Advertising Dashboard in Google Sheets
- Photography Dashboard in Google Sheets
- Photography Studios Dashboard in Excel
- Browse Google Sheets Dashboard Templates
- Browse Google Sheets Sales and Marketing Templates
Read the detailed blog post for Graphic Design Studio Dashboard in Google Sheets
Watch the step-by-step video Demo:
Download the Graphic Design Studio Dashboard in Google Sheets to track revenue, projects, hours, designers, clients, services, client ratings, deal size, revisions, profit, and delivery quality in one editable workbook.
Last updated: July 30, 2026.