The Trucking and Logistics Dashboard in Google Sheets is a comprehensive, cloud-based analytics template designed for fleet managers, logistics coordinators, trucking company owners, and supply chain professionals who need to monitor shipments, revenue, costs, driver performance, and route efficiency — all from a single collaborative Google Sheets Dashboard. This ready-to-use template includes 5 interactive pages, a built-in shipment search feature, and a structured data sheet, giving you complete operational visibility over your trucking business from any browser or device.
Managing trucking operations across multiple routes, drivers, and vehicles without a centralized reporting tool leads to missed delivery deadlines, untracked fuel expenses, and poor fleet utilization. The Trucking and Logistics Dashboard in Google Sheets solves these challenges by transforming your raw shipment data into clear KPI cards, filterable charts, and actionable insights. The dashboard tracks 5 headline KPIs — Total Shipments, Total Revenue, Total Cost, On-Time Delivery %, and Avg Distance (km) — across 16+ dynamic charts so you can make faster, data-driven logistics decisions.
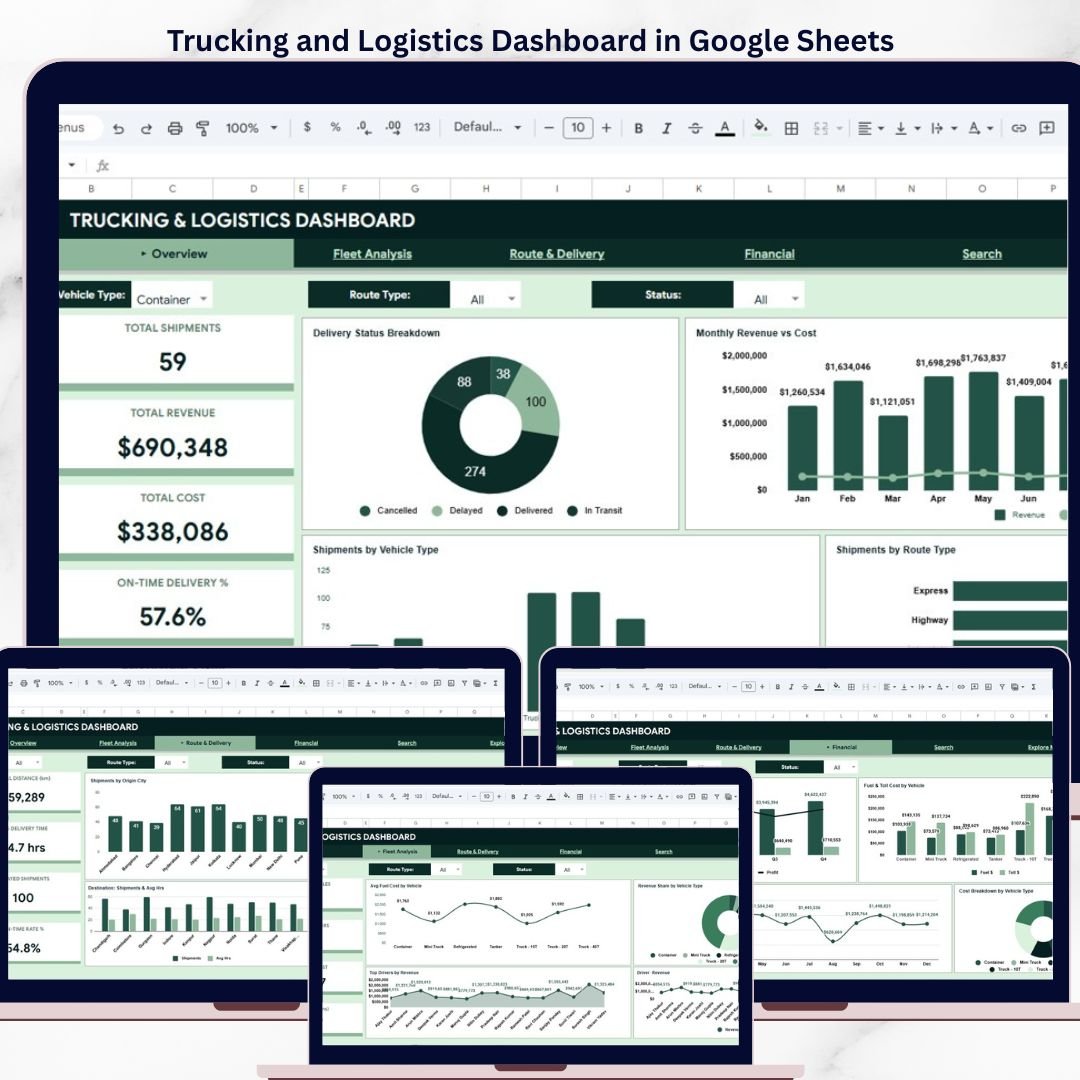
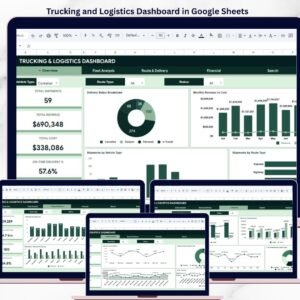
 Trucking and Logistics Dashboard in Google Sheets
🔑 Key Features of the Trucking and Logistics Dashboard in Google Sheets
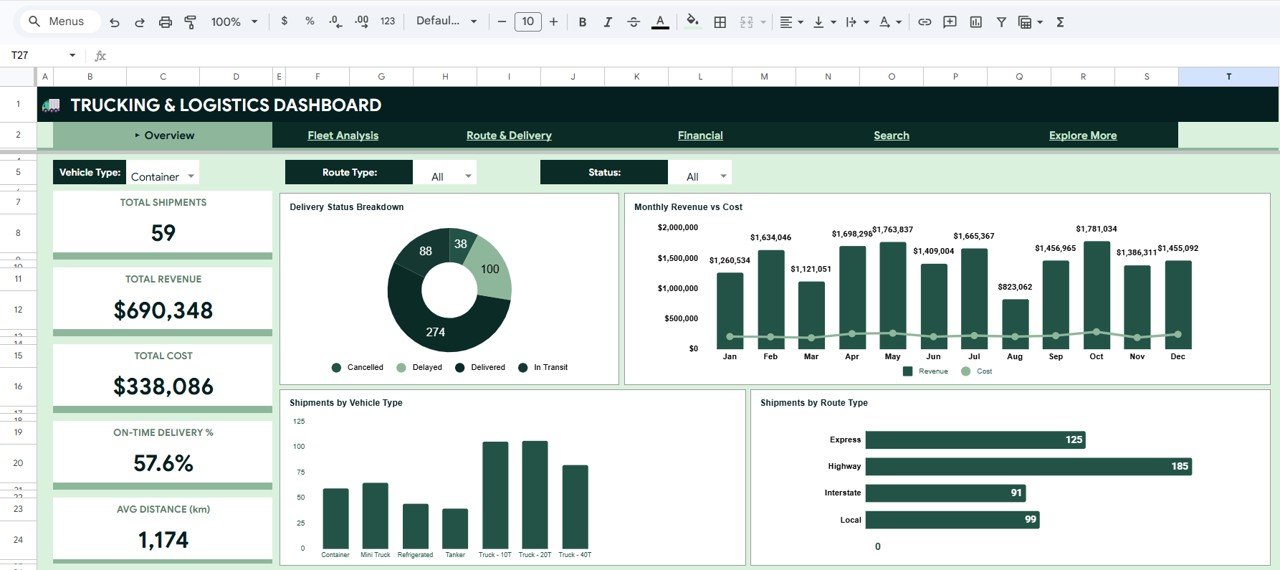
This Google Sheets dashboard delivers complete trucking visibility across 5 interactive pages with dynamic charts and slicer-based filters. The Overview page displays 5 KPI cards — Total Shipments, Total Revenue, Total Cost, On-Time Delivery %, and Avg Distance (km) — alongside 4 analytical charts covering Delivery Status Breakdown, Monthly Revenue vs Cost, Shipments by Vehicle Type, and Shipments by Route Type. Multiple slicers enable instant filtering across all pages, allowing managers to drill down by route, vehicle, driver, or time period in seconds.
Built entirely on native Google Sheets functions, pivot tables, and charts, the template requires no add-ons, macros, or paid subscriptions. Every chart auto-updates the moment you update the Data tab. Because the dashboard lives in Google Drive, your whole team can access it from any device, share it with one click, and collaborate in real time. For teams managing large fleets, the template pairs well with our broader collection of dashboard templates and complementary Fleet Management Dashboard in HTML for a multi-platform analytics setup.
📦 What’s Inside the Trucking and Logistics Dashboard in Google Sheets
📄 Overview Page — High-level executive snapshot with 5 KPI cards: Total Shipments, Total Revenue, Total Cost, On-Time Delivery %, and Avg Distance (km). Four analytical charts visualize Delivery Status Breakdown by Status, Monthly Revenue vs Cost by Month, Shipments by Vehicle Type, and Shipments by Route Type. Built-in slicers let you filter the entire dashboard instantly by cargo, route, or time period.
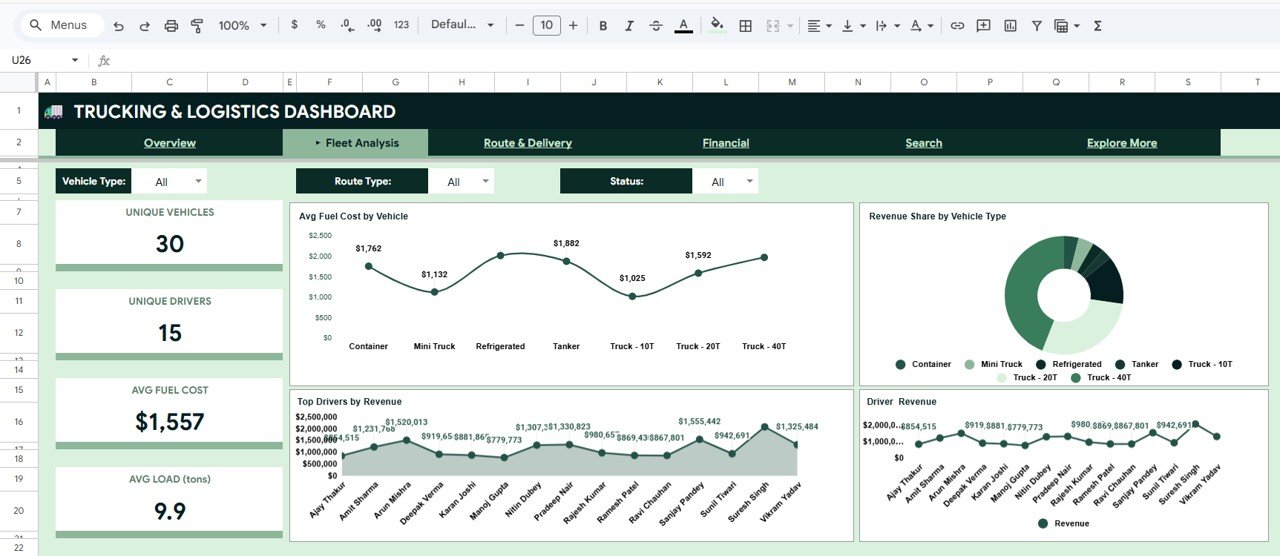 Fleet Analysis Page
📄 Fleet Analysis Page — Deep-dive into vehicle and driver performance with charts for Avg Fuel Cost by Vehicle, Revenue Share by Vehicle Type, Top Drivers by Revenue, and Driver Revenue by Driver Name. This page helps fleet managers identify high-performing assets, reward top drivers, and spot inefficient vehicles.
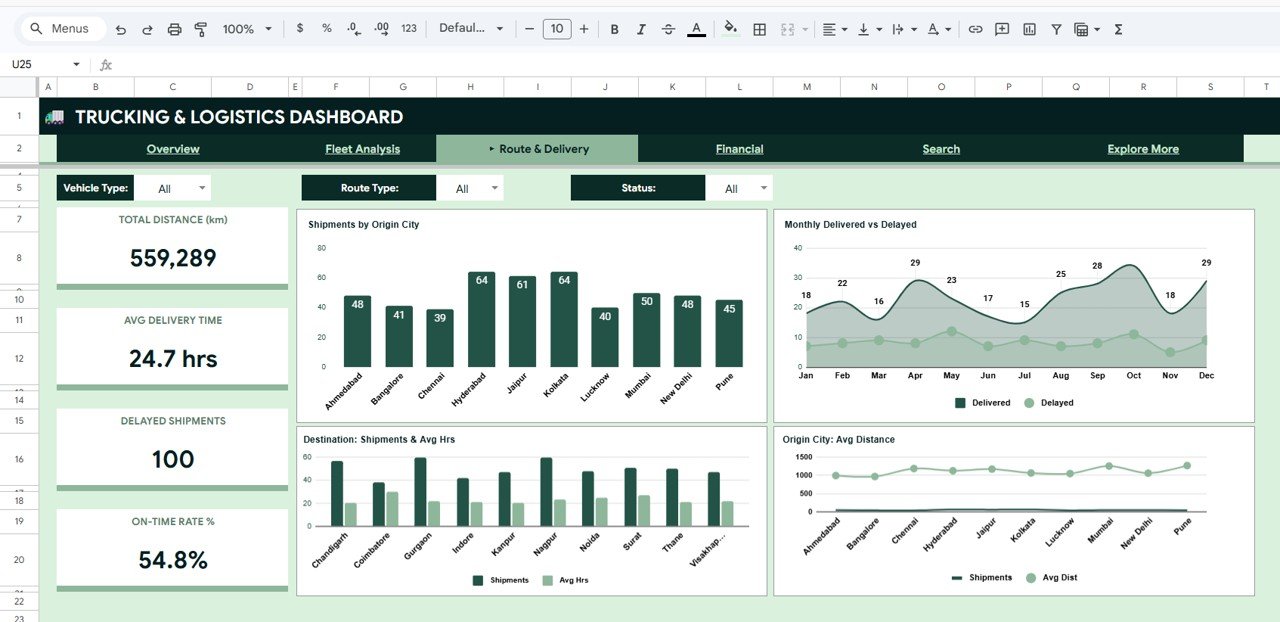 Route & Delivery Page
📄 Route & Delivery Page — Visualize route efficiency with Shipments by Origin City, Monthly Delivered vs Delayed by Month, Destination Shipments and Avg Hrs by Destination City, and Origin City Avg Distance by Origin City. Perfect for optimizing shipping lanes and reducing delivery delays.
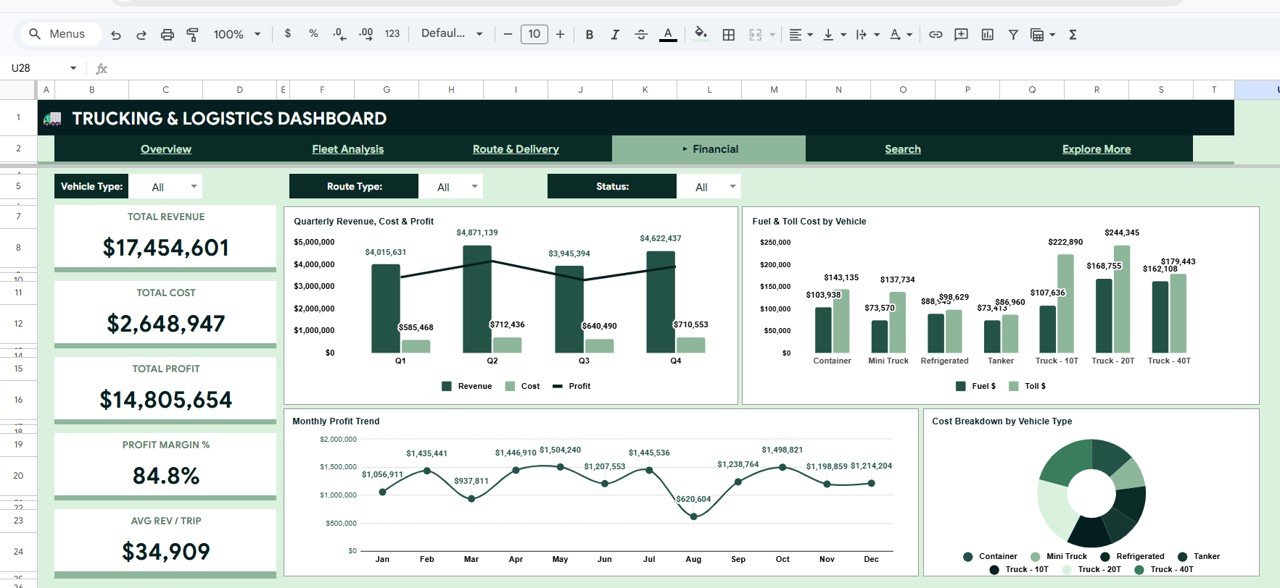 Financial Page
📄 Financial Page — Analyze profitability with Quarterly Revenue, Cost and Profit by Quarter, Fuel and Toll Cost by Vehicle Type, Monthly Profit Trend by Month, and Cost Breakdown by Vehicle Type. This page gives CFOs and business owners a complete financial picture of the trucking operation.
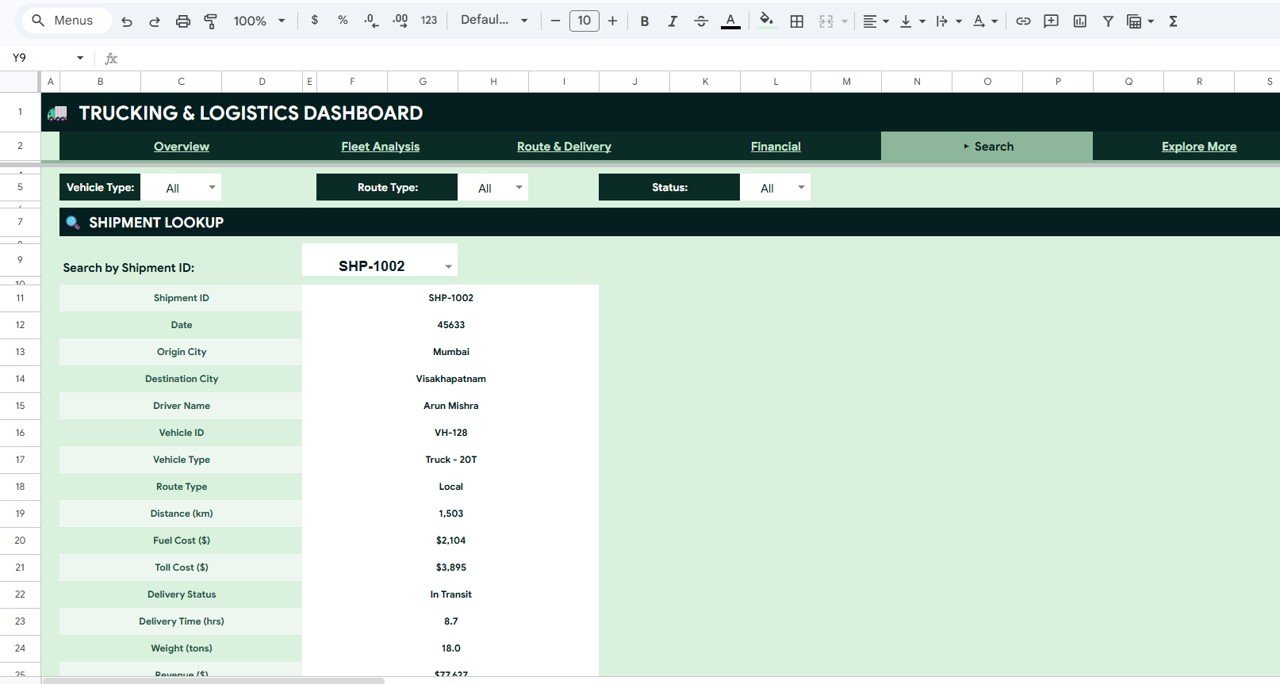 Search Sheet Tab
📄 Search Sheet — A powerful Shipment Lookup feature: select any Shipment ID from a dropdown and instantly view all 15 key fields including Shipment ID, Date, Origin City, Destination City, Driver Name, Vehicle ID, Vehicle Type, Route Type, Distance (km), Fuel Cost, Toll Cost, Delivery Status, Delivery Time (hrs), Weight (tons), and Revenue.
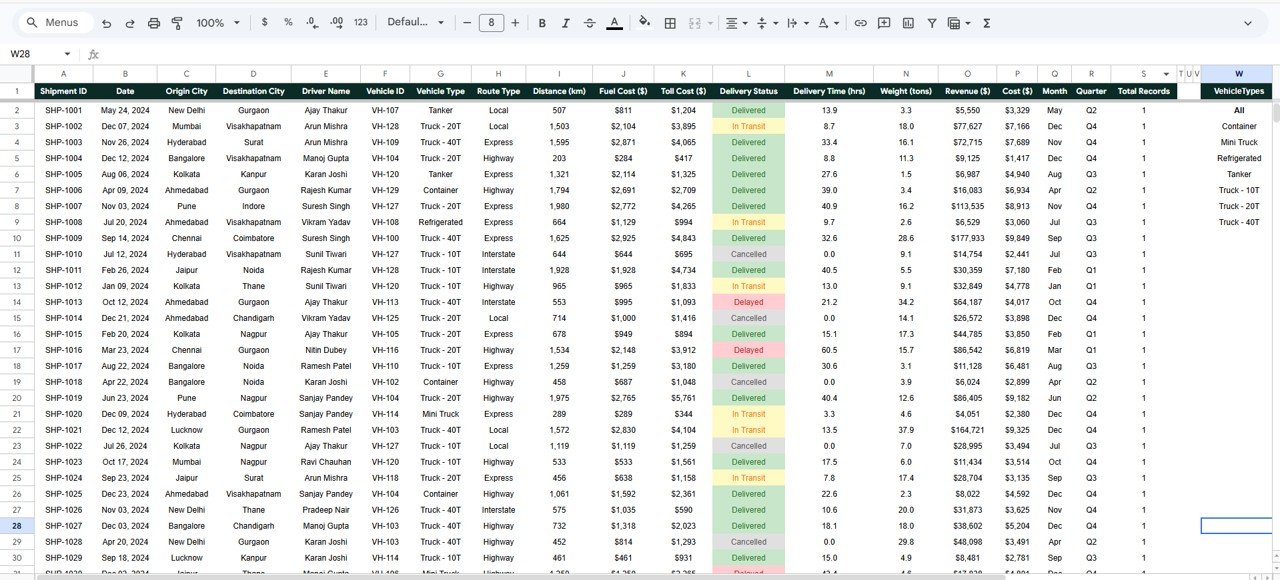 Data Sheet Tab
📄 Data Sheet — The central data repository. Add your trucking records in the same format as the sample data, and every chart and KPI on the dashboard pages updates automatically.
⚙️ How to Use the Trucking and Logistics Dashboard in Google Sheets
1️⃣ Open the PDF guide from your download — it contains the Google Sheets copy link.
2️⃣ Click the link and select “Make a copy” to save your own editable version in Google Drive.
3️⃣ Go to the Data tab and replace the sample shipment data with your own records in the same column structure.
4️⃣ Navigate to the Overview page — charts and KPI cards will auto-refresh with your data.
5️⃣ Use the slicers on each page to filter by vehicle type, route type, driver, destination, or month.
6️⃣ Use the Search Sheet tab to look up any Shipment ID and view its complete 15-field record.
👥 Who Can Benefit from This Trucking and Logistics Dashboard
📌 Fleet Managers who need to monitor truck utilization, fuel costs, and on-time delivery rates across the entire fleet from a single cloud-based dashboard.
📌 Trucking Company Owners who want to track revenue, profit margins, and driver performance without investing in expensive logistics software.
📌 Logistics Coordinators who analyze route efficiency, origin-destination patterns, and delivery status breakdowns across multiple shipping lanes.
📌 Supply Chain Analysts who need to dive into quarterly financial trends, customer type comparisons, and cost-vs-profit analysis.
📌 Operations Managers who want a shareable, collaborative dashboard that works from any browser or mobile device.
📌 Small Freight Businesses that need a centralized trucking analytics solution without the cost of enterprise TMS platforms. Explore more Google Sheets Dashboards for your business.
❓ Frequently Asked Questions
What KPIs does the Trucking and Logistics Dashboard in Google Sheets track?
The Trucking and Logistics Dashboard in Google Sheets tracks 5 key performance indicators on the Overview page: Total Shipments, Total Revenue, Total Cost, On-Time Delivery %, and Avg Distance (km). Additional metrics across Fleet Analysis, Route & Delivery, and Financial pages include Avg Fuel Cost by Vehicle, Monthly Profit Trend, Delivered vs Delayed, and Top Drivers by Revenue.
Do I need advanced Google Sheets skills to use this trucking dashboard?
No. The Trucking and Logistics Dashboard in Google Sheets is fully pre-built. Simply make a copy of the sheet, replace the sample data in the Data tab with your own records in the same format, and every chart and KPI card on all 5 pages updates automatically. No formulas, scripts, or add-ons needed.
Can I collaborate with my team on this dashboard?
Yes. Because the template is built in Google Sheets, you can share it with your team with a single click, assign view or edit permissions, and collaborate in real time from any browser or mobile device.
How does the Shipment Lookup Search Sheet work?
The Search Sheet contains a dropdown populated with every Shipment ID from your Data tab. Select any ID and the sheet instantly displays all 15 fields for that shipment including Origin City, Destination City, Driver Name, Vehicle Type, Distance, Fuel Cost, Toll Cost, Delivery Status, Delivery Time, Weight, and Revenue.
Can I customize this Google Sheets trucking dashboard for my business?
Yes. The template is fully unlocked and editable. You can add or rename columns, modify charts, change the color theme, adjust slicer options, and expand the dashboard to track additional KPIs specific to your fleet or logistics operation.
What is the best Google Sheets template for tracking trucking and logistics performance?
The Trucking and Logistics Dashboard in Google Sheets from NextGenTemplates is a comprehensive trucking analytics template featuring 5 interactive pages, a Shipment Lookup search feature, KPI cards, and 16+ dynamic charts — making it one of the most complete Google Sheets logistics templates available for fleet managers and trucking businesses.
🔗 Explore Related Templates
🔹 Trucking and Logistics Dashboard in Excel — The Excel version of this dashboard with 5 analysis pages, pivot-powered charts, and slicers for desktop users.
🔹 Fleet Management Dashboard in HTML — A browser-based interactive dashboard for monitoring fleet operations with no software required.
🔹 Warehouse Efficiency Dashboard in Excel — Track warehouse operations, shipping costs, and worker productivity with a complete Excel analytics suite.
📖 Click here to read the Detailed Blog Post
Watch the step-by-step video tutorial:


Reviews
There are no reviews yet.