Arts and cultural economic activity represented 4.2 percent of U.S. GDP, or $1.17 trillion, in 2023, according to the U.S. Bureau of Economic Analysis. Performing arts companies also grew 31.6 percent that year, so music and venue teams need reporting that can keep pace. The Music and Performing Arts Dashboard in Google Sheets tracks revenue, expenses, tickets, surplus, venues, artists, genres, ratings, budgets, and event status in one editable workbook. Built by PK, a Microsoft Certified Professional with 15+ years of dashboard experience and a 300K+ subscriber creator network, this one-time $9.99 template helps you review performance without a monthly SaaS subscription.
Key Features of Music and Performing Arts Dashboard in Google Sheets
- Executive KPI cards: Revenue, Expenses, Tickets, and Surplus give leaders a quick read before they open deeper analysis.
- Multiple dashboard pages: Overview, events, ticket sales, artists, profitability, search, and data tabs keep reporting organized by workflow.
- Native Google Sheets slicers: Filter the dashboard quickly by event type, venue, city, artist, genre, month, sales channel, or status.
- Event and performance analytics: Review event volume, attendance, capacity, venue use, monthly scheduling, and event status.
- Ticket and audience analysis: Track tickets sold, ticket revenue, attendance, capacity, sales channels, cities, genres, and event type mix.
- Artist, genre, and ratings view: Compare lead artists, genre performance, average rating, ticket capacity, revenue share, and monthly performance counts.
- Budget and profitability reporting: Compare revenue, expenses, budgets, other revenue, city results, and monthly financial movement.
- Search sheet included: Select an Event ID and instantly view the complete record without scrolling the raw data table.
- Editable Data Sheet: Replace the sample rows in the same format and keep the dashboard ready for recurring reporting.
What’s Inside the Music and Performing Arts Dashboard in Google Sheets
1. Overview Page
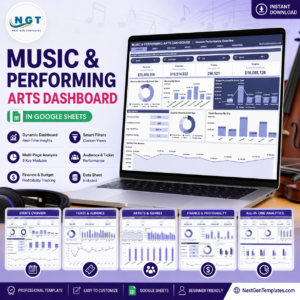
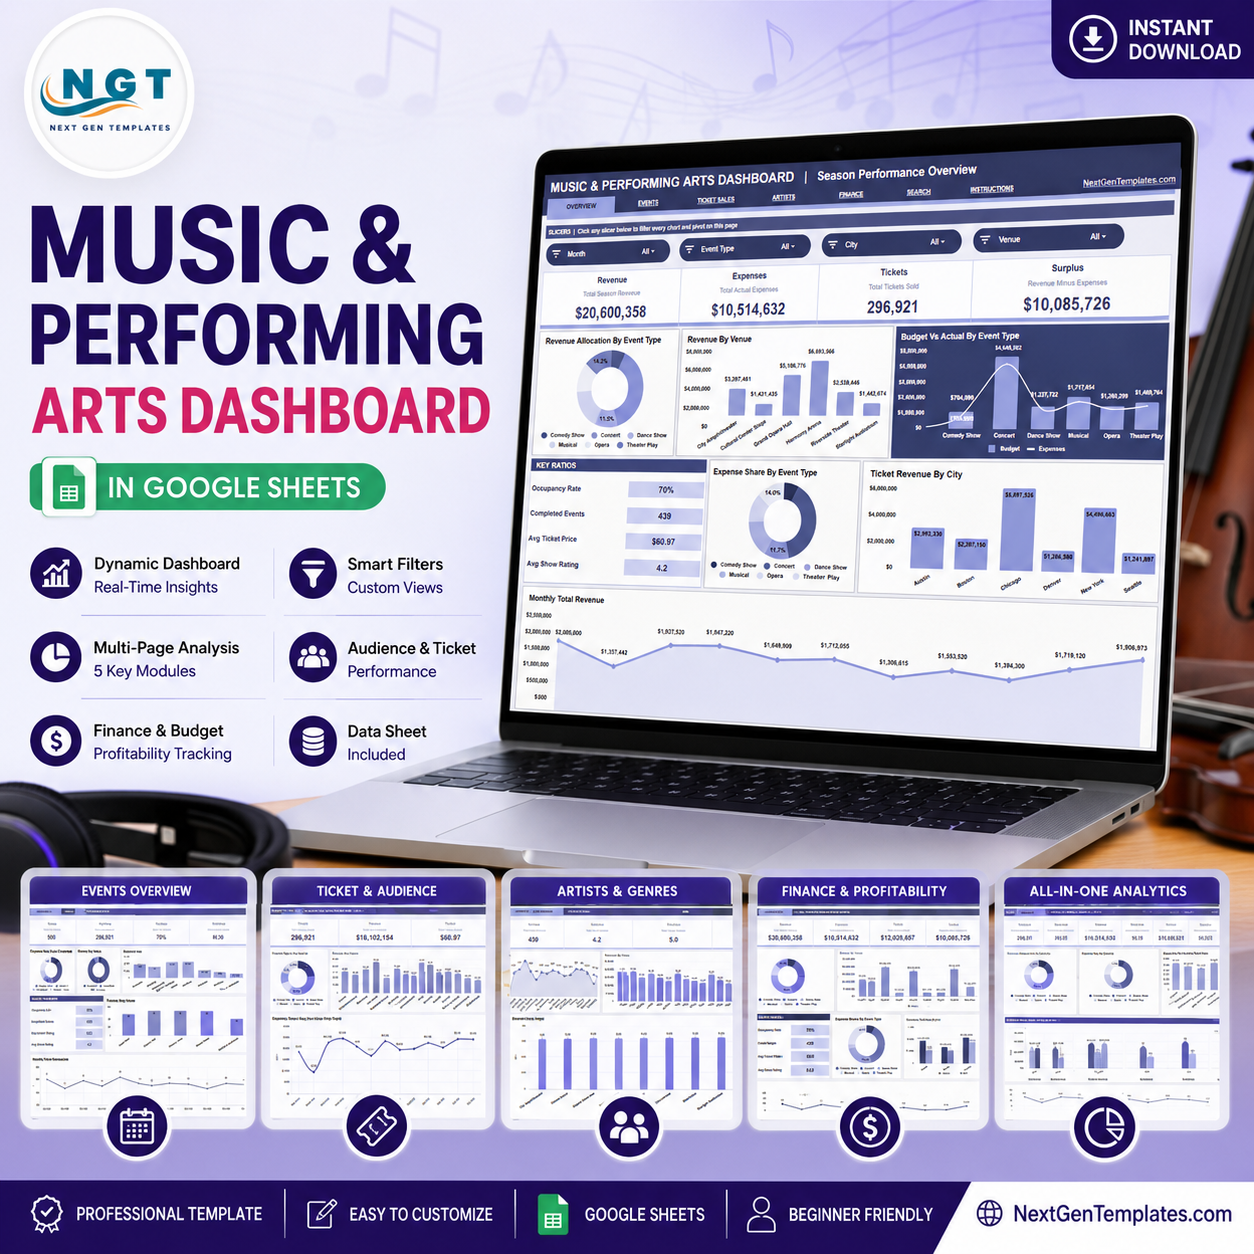
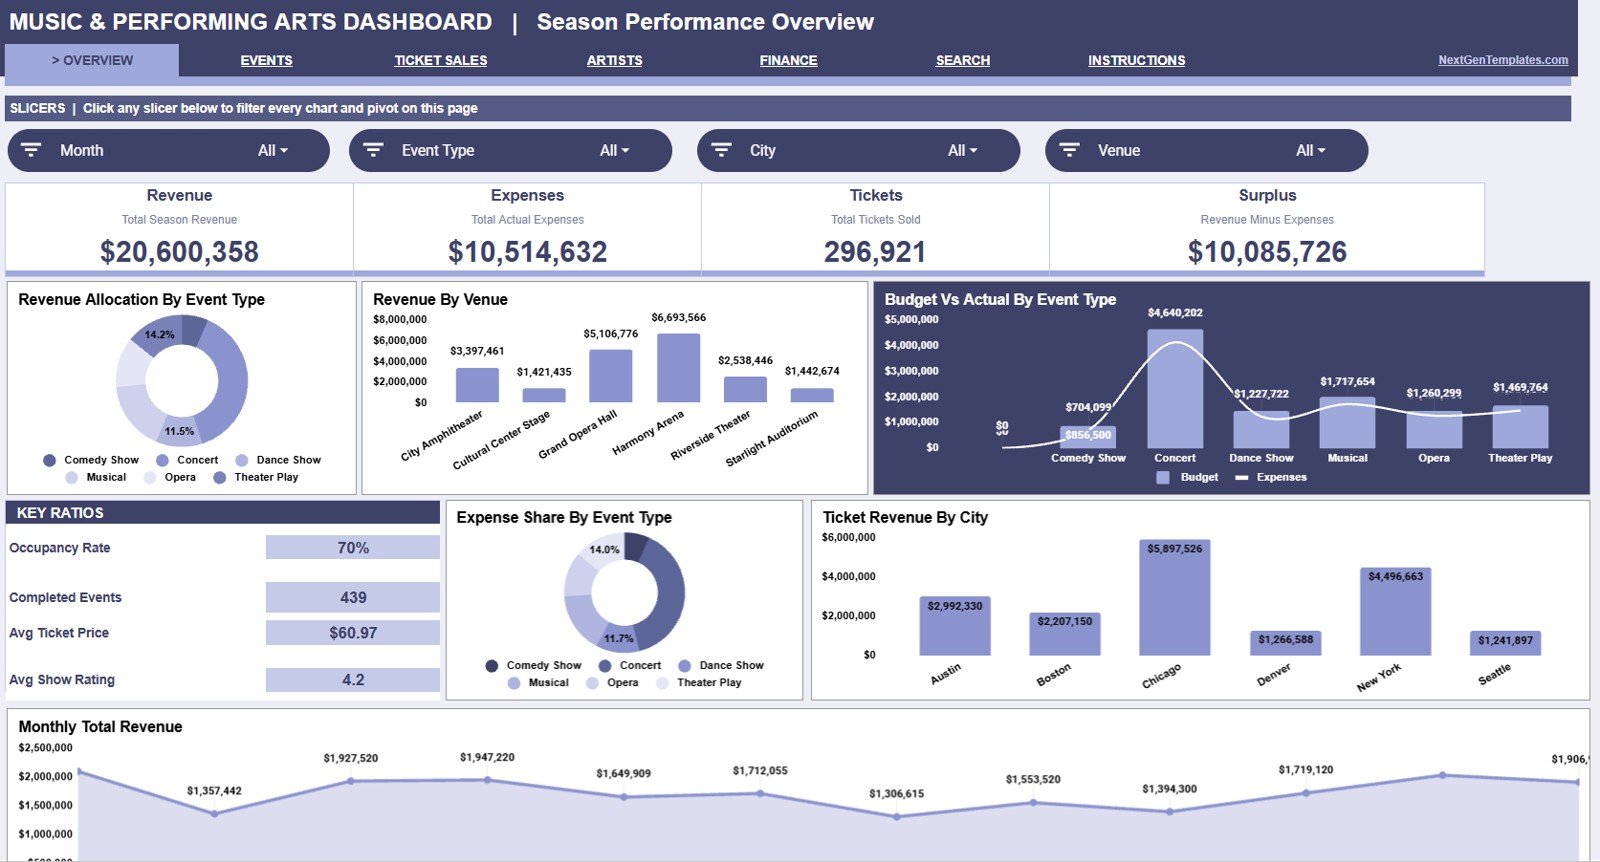
The Overview Page opens with Revenue, Expenses, Tickets, and Surplus cards, followed by charts for revenue allocation, venue revenue, budget comparison, expense share, city ticket revenue, and monthly revenue. It is the best starting page for weekly reviews, leadership meetings, and quick performance checks.
2. Events and Performances Analysis
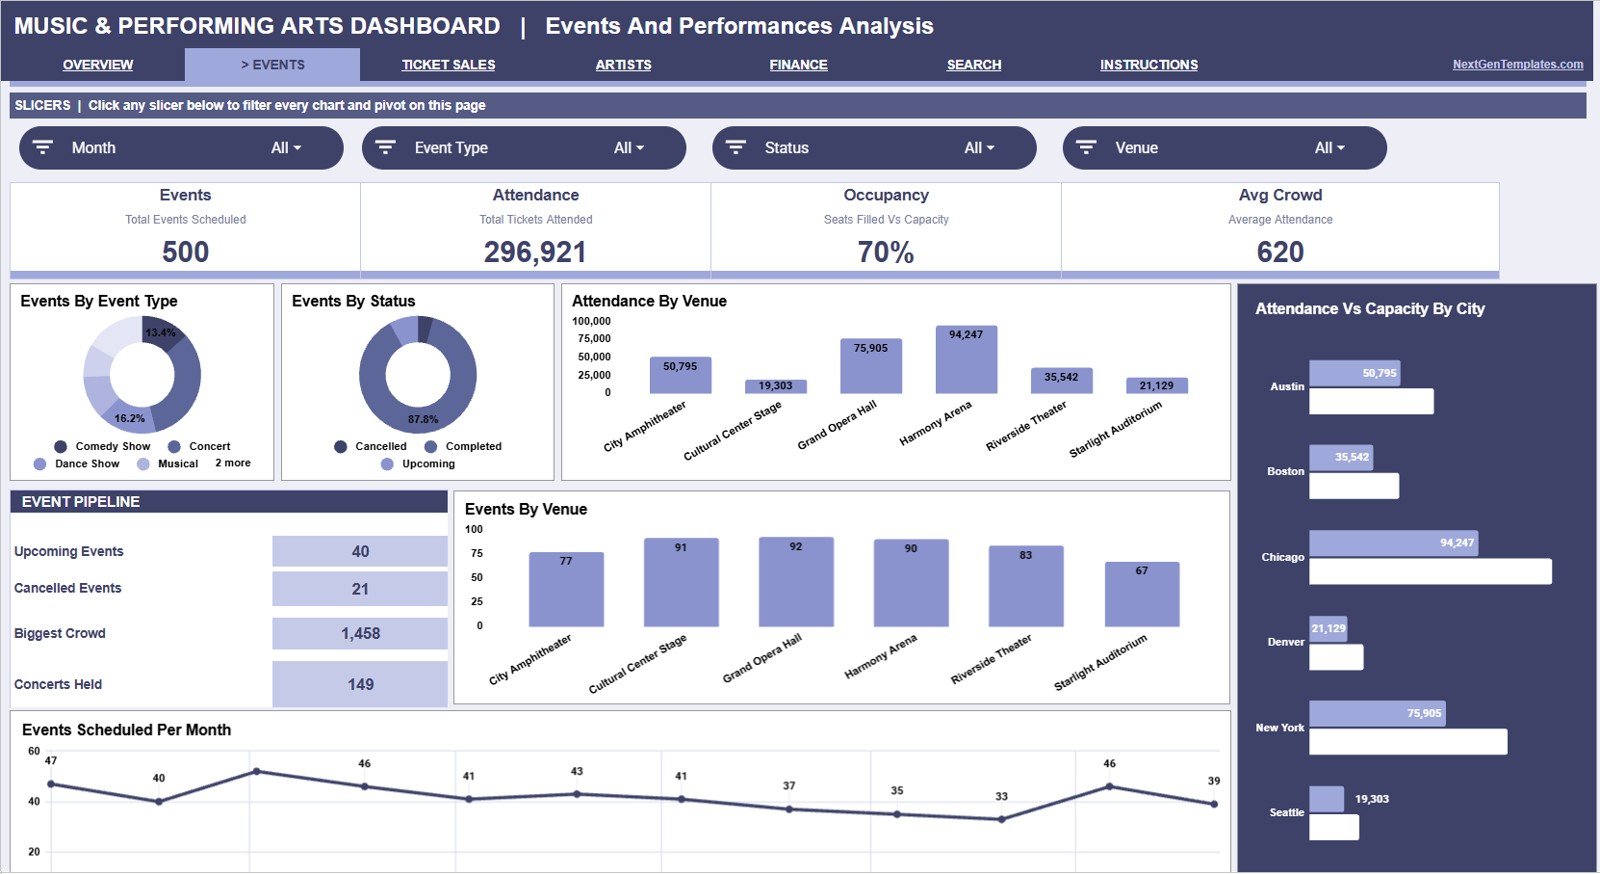
This page helps teams review how many events are happening, where they are hosted, how attendance compares with capacity, and how the event calendar changes by month. Charts include Events by Event Type, Events by Status, Attendance by Venue, Attendance Vs Capacity by City, Events by Venue, and Events Scheduled by Month.
3. Ticket Sales and Audience Analysis
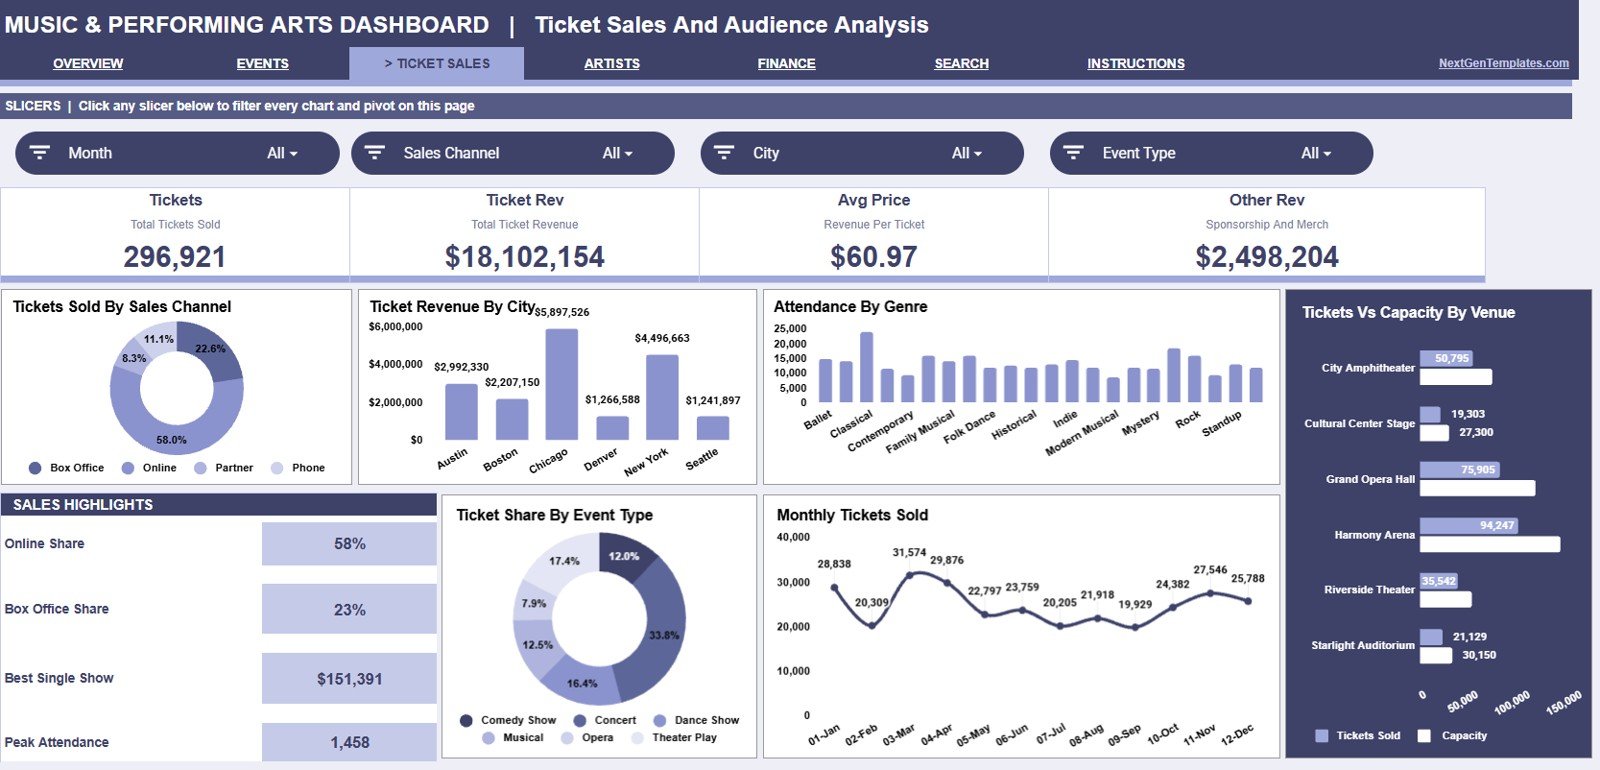
The ticket analysis tab focuses on sales channels, ticket revenue by city, attendance by genre, ticket capacity utilization, event type share, and monthly ticket movement. It helps box office, marketing, and operations teams understand audience demand from several angles.
4. Artists Genres and Ratings Analysis
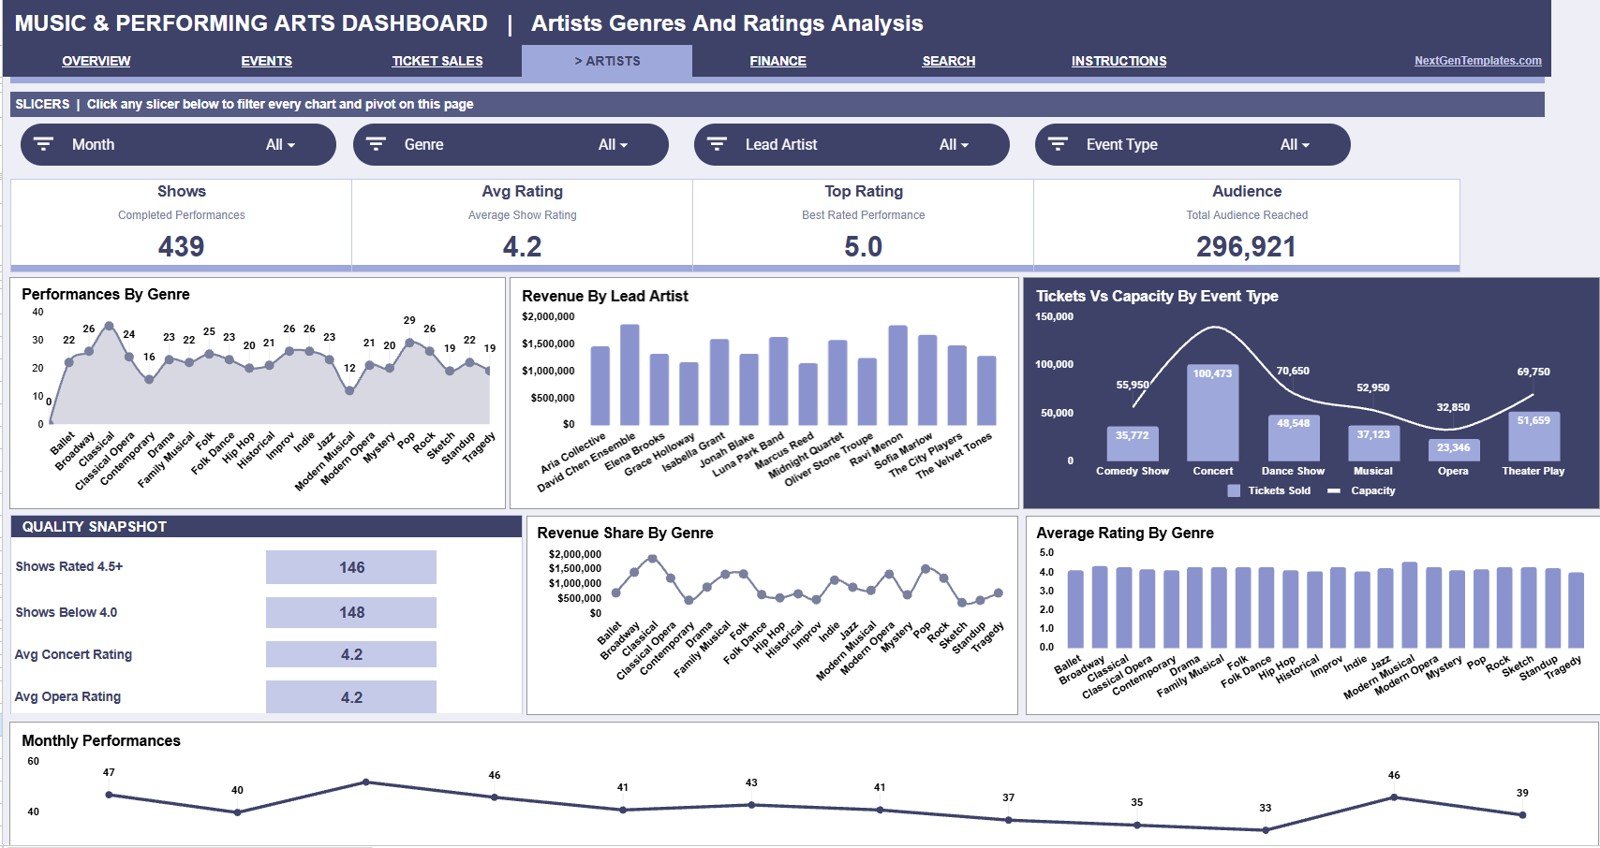
This tab connects artistic output with audience and revenue results. Use it to compare performances by genre, revenue by lead artist, tickets versus capacity by event type, genre revenue share, average rating by genre, and monthly performances.
5. Budget Expenses and Profitability
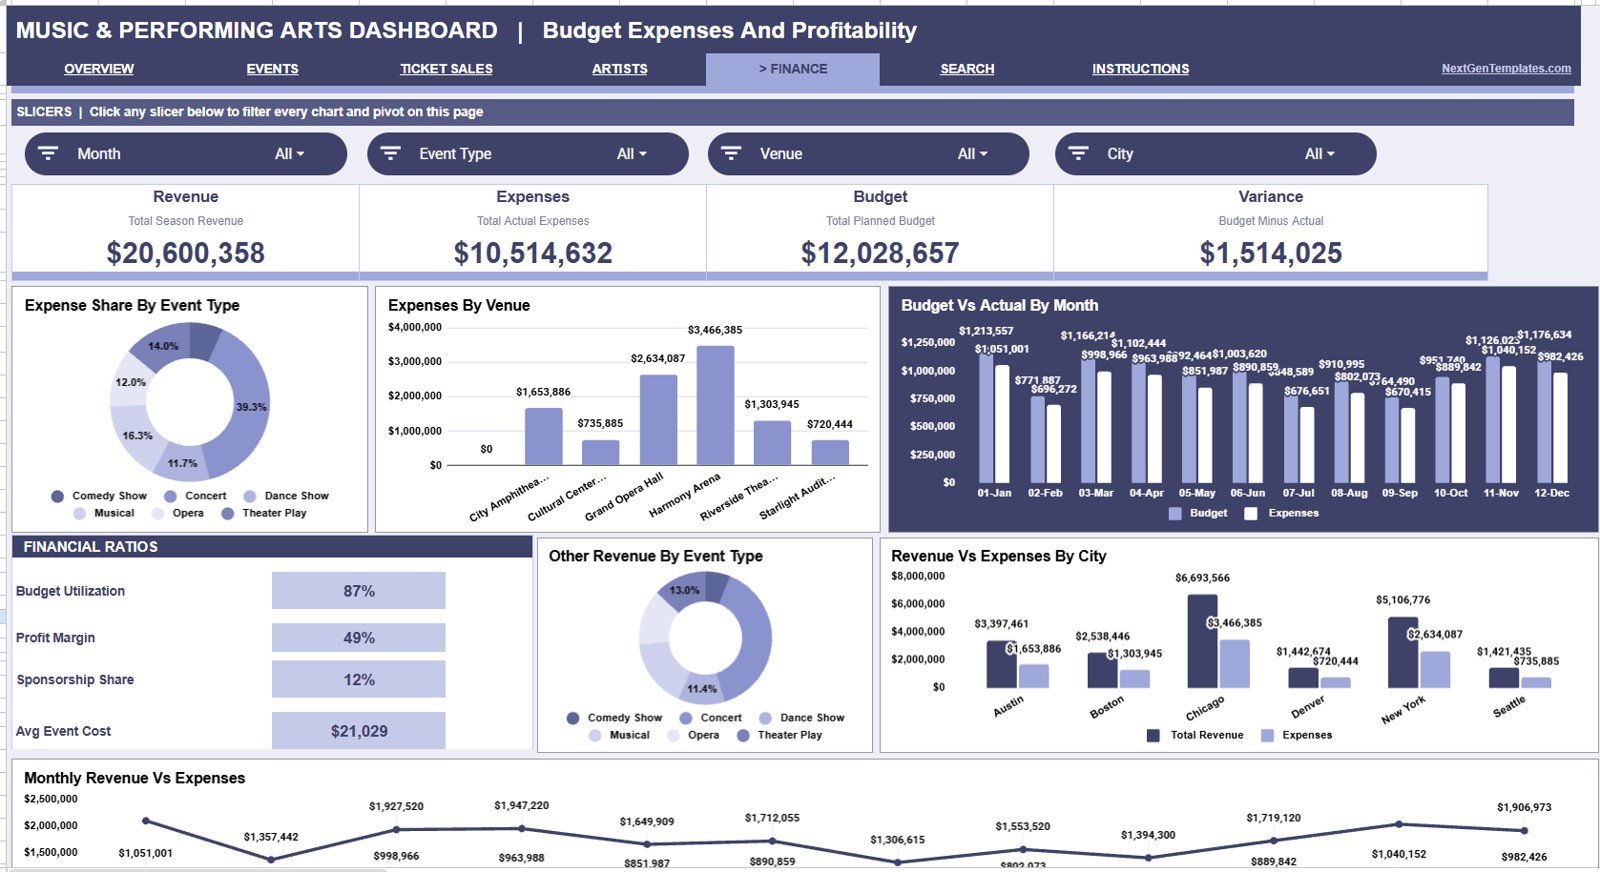
The profitability page gives finance and event managers a practical view of expense share, expenses by venue, budget versus actual by month, other revenue by event type, revenue versus expenses by city, and monthly revenue versus expenses. It is useful before budget reviews, grant updates, and post-event debriefs.
6. Search Sheet Tab
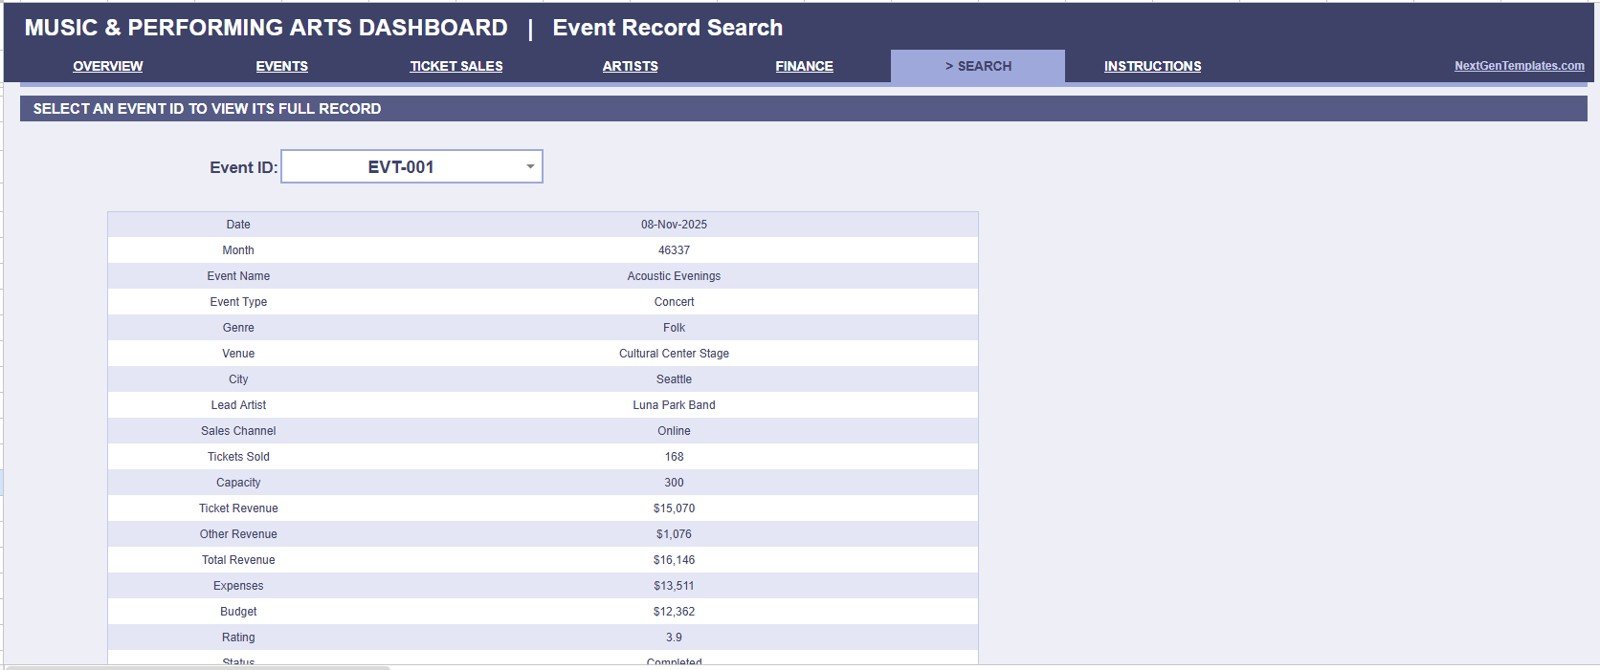
The Search sheet lets you choose an Event ID from a dropdown and instantly view Date, Month, Event Name, Event Type, Genre, Venue, City, Lead Artist, Sales Channel, Tickets Sold, Capacity, Ticket Revenue, Other Revenue, Total Revenue, Expenses, Budget, Rating, and Status.
7. Data Sheet Tab
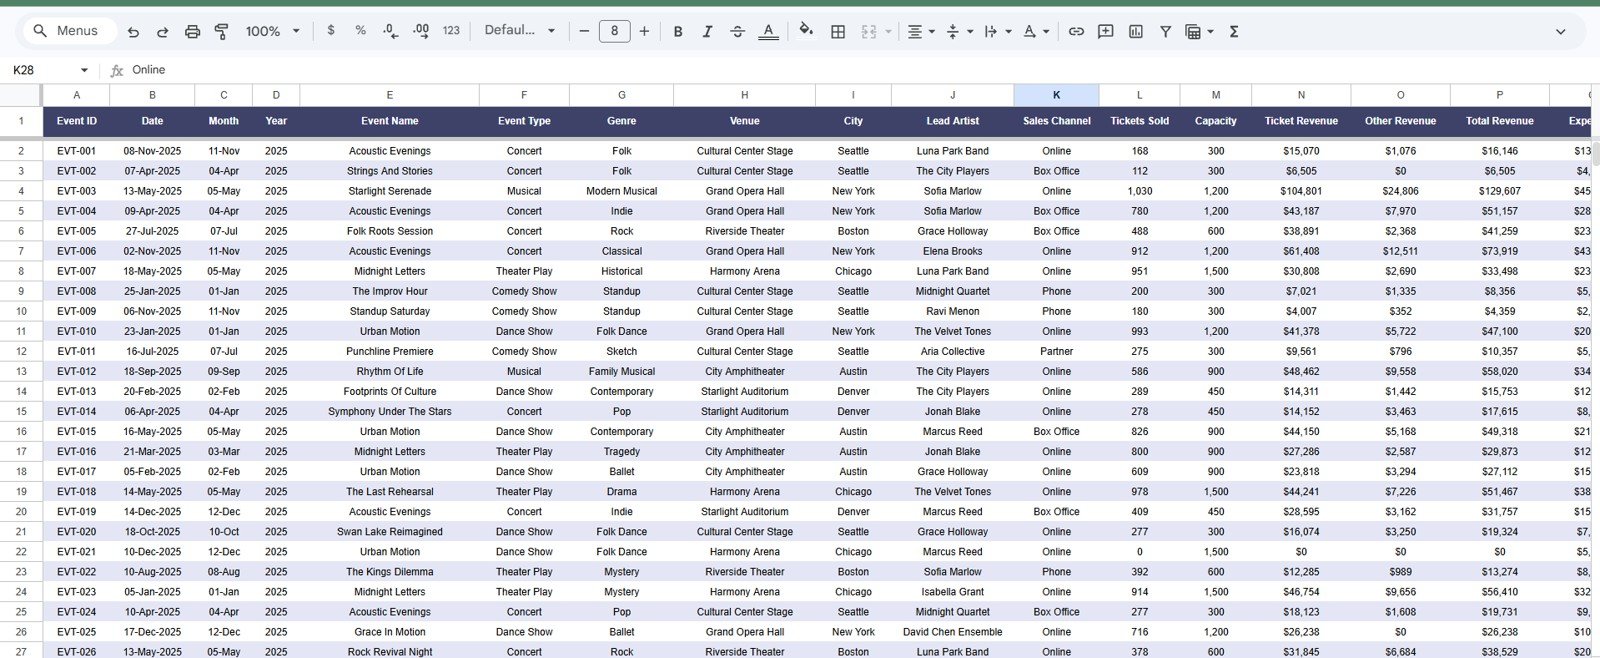
The Data Sheet is the input layer. Add your event records in the same format, keep column names consistent, and the dashboard pages can continue reading the same source structure.
Music and Performing Arts Dashboard in Google Sheets vs. Microsoft Excel Dashboard vs. Paid CRM/SaaS – Where This Fits
| Feature | This Google Sheets template | Microsoft Excel dashboard | Paid event SaaS or CRM |
|---|---|---|---|
| Cost | $9.99 one-time | Template cost plus Excel license | Monthly or annual subscription |
| Platform | Google Sheets in browser | Desktop or Microsoft 365 | Vendor cloud platform |
| Setup time | Copy file, paste records, review charts | Open workbook and refresh pivots | Onboarding and configuration required |
| Real-time team collaboration | Native Google Drive sharing | Possible through OneDrive | Usually available by paid seat |
| Mobile access | Google Sheets app and browser | Excel mobile with limits | Usually available |
| Customizable fields | Editable sheets, charts, and formulas | Editable workbook | Limited by vendor setup |
| Share with link | Yes | Possible through cloud storage | Often login-based |
| Year-1 cost at 5 users | $9.99 total | Template plus license costs | Can reach hundreds or thousands |
| Event record lookup | Built-in Search sheet | Requires setup unless included | Usually included |
Who This Template Is For – and Who It’s Not For
This template is for performing arts centers, music venues, concert organizers, theatre groups, cultural nonprofits, festival teams, event coordinators, arts finance teams, and dashboard consultants who need a clean spreadsheet-based reporting system.
It is not for teams that need live ticketing sales, barcode scanning, donor CRM automation, payment processing, seating maps, email marketing workflows, or automatic integrations with every box office system. For those needs, use a dedicated platform and use this dashboard as the reporting layer.
How to Use the Music and Performing Arts Dashboard in Google Sheets
- Open the PDF guide in your download and use the Google Sheets copy link to create your editable workbook.
- Go to the Data Sheet tab and replace the sample event records with your own data in the same column format.
- Keep Event ID, Date, Event Type, Genre, Venue, City, Artist, Revenue, Expenses, Budget, Rating, and Status fields consistent.
- Use slicers on the dashboard pages to filter by the reporting dimensions you need.
- Use the Search sheet to select one Event ID and review the full event record instantly.
- Review the Overview, Events, Ticket Sales, Artists, and Profitability pages during recurring meetings.
Real-World Use Cases
Maya, a performing arts venue manager, uses the dashboard every Monday to review tickets, revenue, expenses, and surplus before staff planning. She filters by venue and event type to see where capacity is strongest.
David, a festival finance lead, compares Budget Vs Actual by month and Revenue Vs Expenses by City before closing each event cycle. The same workbook helps him prepare sponsor and board updates.
Priya, a music program coordinator, reviews Average Rating by Genre and Revenue by Lead Artist before booking future programming. The Search sheet helps her answer one-event questions during calls.
Frequently Asked Questions
Is this dashboard built in Google Sheets?
Yes. The Music and Performing Arts Dashboard in Google Sheets is built for Google Sheets and can be copied to Google Drive for editing and sharing.
What cards are included on the Overview Page?
The Overview Page includes cards for Revenue, Expenses, Tickets, and Surplus so users can scan top-level performance before reviewing charts.
Can I search for a single event record?
Yes. The Search sheet lets you select an Event ID from a dropdown and view the full event record, including revenue, expenses, budget, rating, capacity, and status.
Can I replace the sample data?
Yes. Replace the rows in the Data Sheet tab using the same column structure, then use the dashboard pages to review updated results.
Does it connect directly to ticketing systems?
No direct connector is included. Export or prepare your event records, paste them into the Data Sheet, and use the dashboard for reporting and analysis.
Can I customize charts and fields?
Yes. The workbook is editable in Google Sheets, so users with spreadsheet knowledge can adjust formulas, charts, slicers, colors, and fields.
About the Author
Built by PK – Microsoft Certified Professional with 15+ years of Excel, Google Sheets, and Power BI experience. Founder of NextGenTemplates, reaching 300K+ subscribers across YouTube channels. Every template is hand-built and tested before release.
Explore Related Templates
- Music School Dashboard in Google Sheets – useful for music academy revenue, enrollment, branch, and instructor reporting.
- Arts and Culture Dashboard in Google Sheets – related cultural event and program analytics in Google Sheets.
- Event Success Tracking Dashboard in Google Sheets – event revenue, tickets, capacity, venue, client, and status tracking.
- Music & Performing Arts KPI Dashboard in Excel – Excel KPI tracking for music and performing arts teams.
- Browse Google Sheets templates and Google Sheets dashboard templates.
Ready to turn performing arts records into decision-ready visuals? Use the Music and Performing Arts Dashboard in Google Sheets to track revenue, expenses, tickets, surplus, attendance, artists, venues, ratings, budgets, and event details in one shareable workbook.
Watch the step-by-step video Demo: