

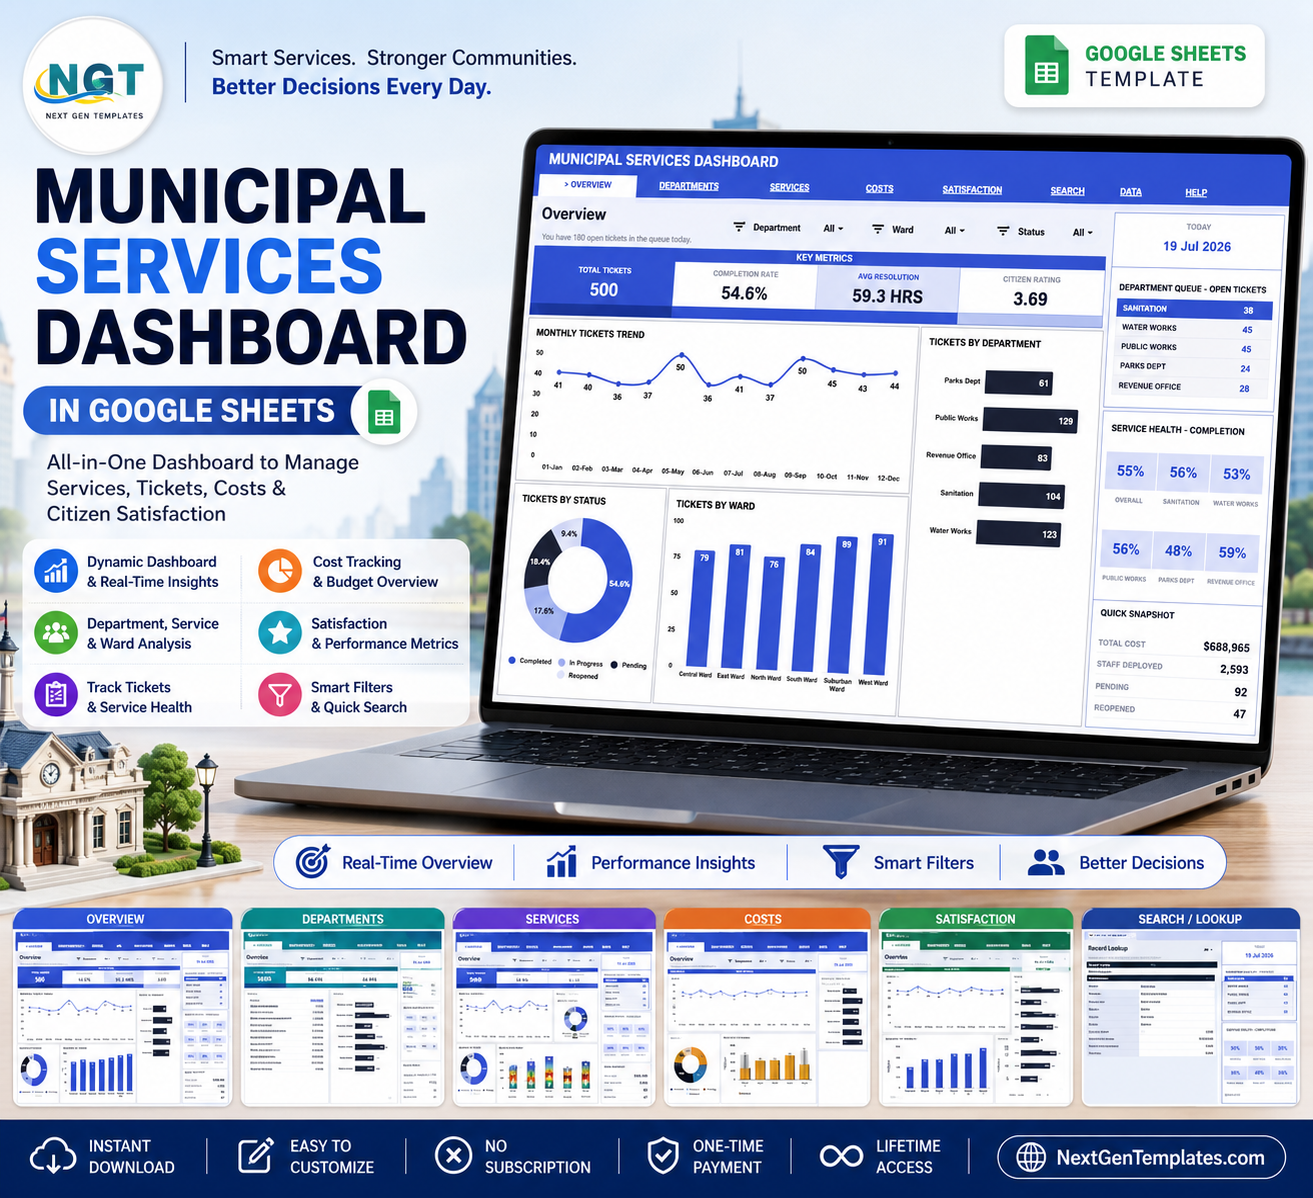

The Municipal Services Dashboard in Google Sheets helps city, township, and local-government teams turn ticket records into clear service reporting. The U.S. Census Bureau reported 90,837 local governments in 2022, including 19,491 municipal governments. Built by PK for a 300K+ subscriber learning audience, this editable dashboard gives teams a one-time $9.99 sale-price option with no monthly software subscription, so they can review tickets, completion, cost, wards, departments, and citizen ratings before committing to a larger civic-service SaaS system.
Key Features of Municipal Services Dashboard in Google Sheets
- Seven Google Sheets tabs: Overview, Departments, Services, Costs, Satisfaction, Search Sheet, and Data Sheet.
- High-level KPI cards: Track Total Tickets, Completion Rate, Avg Resolution, and Citizen Rating.
- Multiple slicers: Filter the dashboard quickly by the available ticket fields during reviews.
- Department analysis: Compare service cost, rating, resolution, ward activity, open tickets, and completion rate by department.
- Service analysis: Review service type, service cost share, ticket channel, priority, open workload, and completion performance.
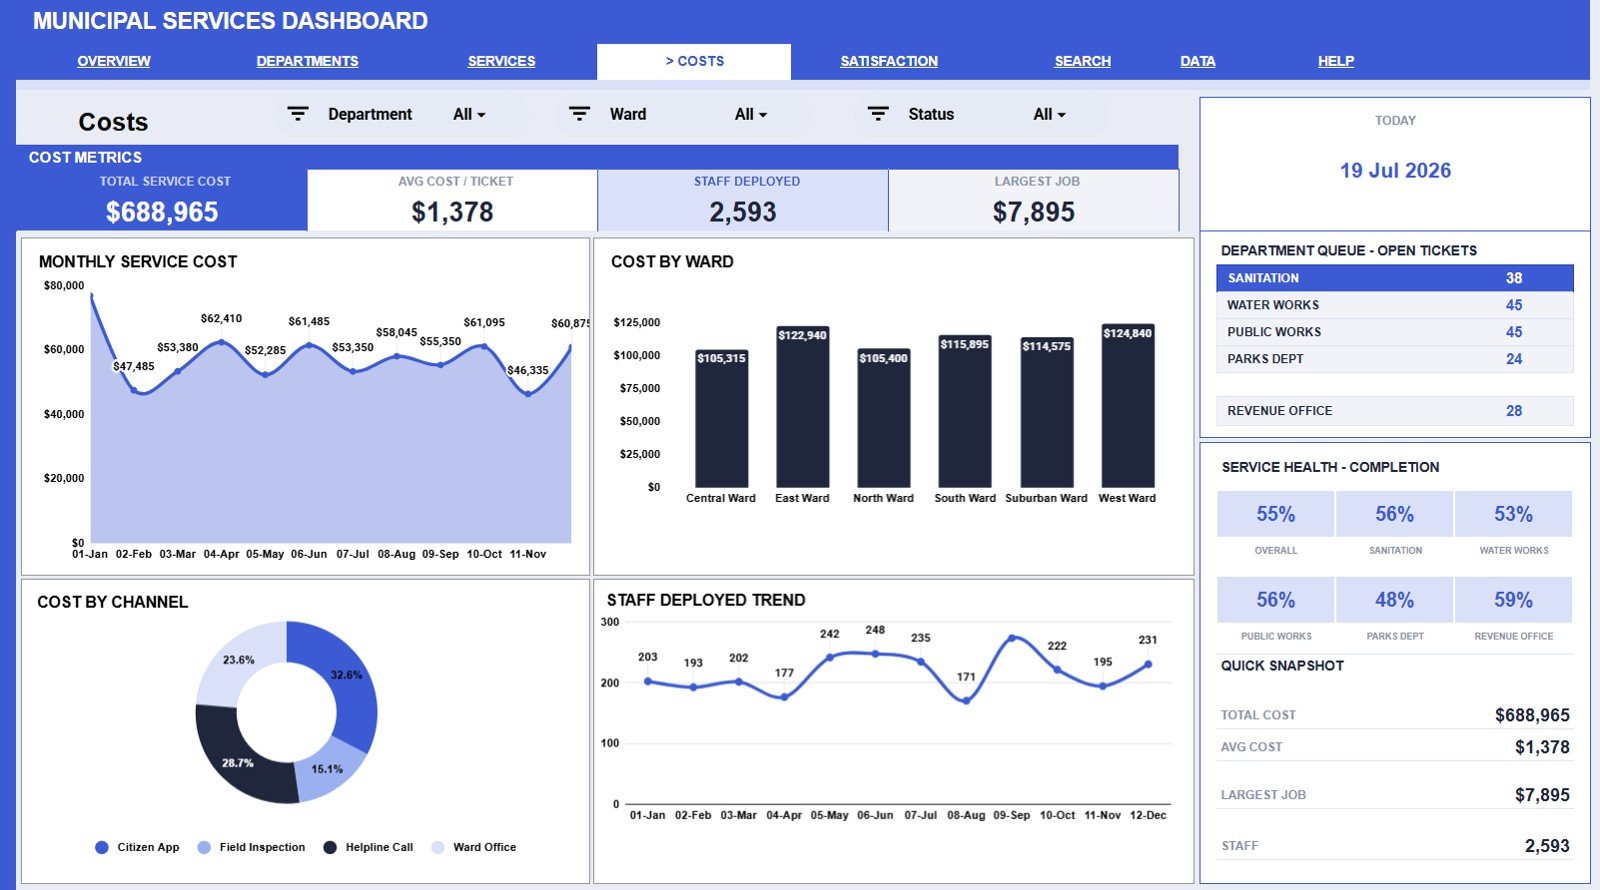
- Cost analysis: Monitor service cost by month, ward, channel, and staffing trends.
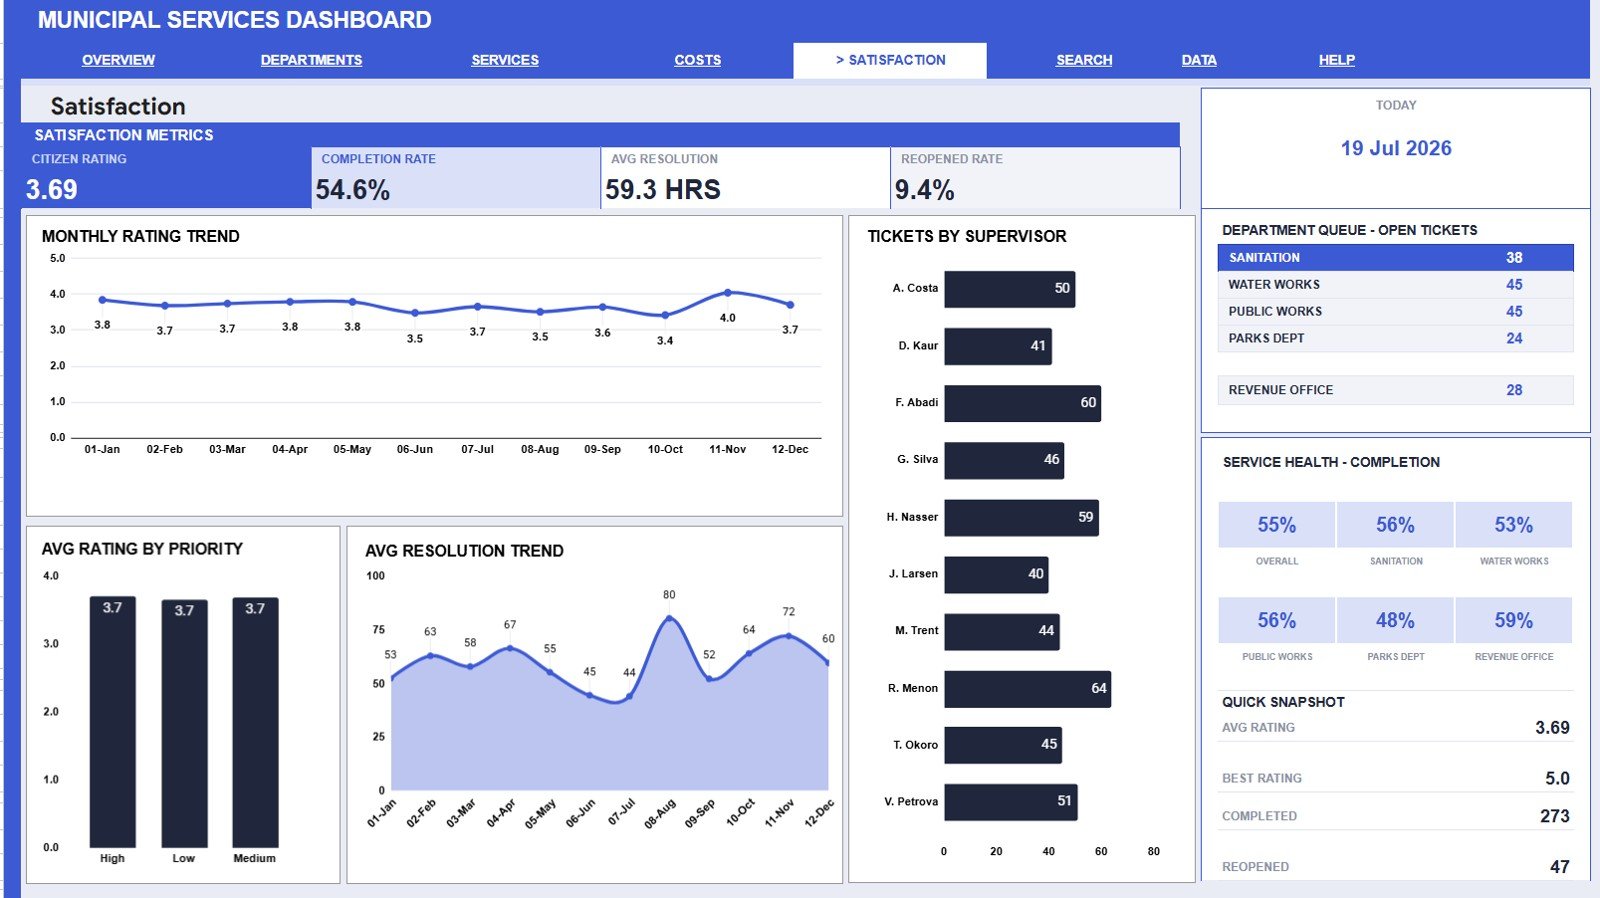
- Satisfaction analysis: Track citizen rating by month, supervisor, priority, and average resolution movement.
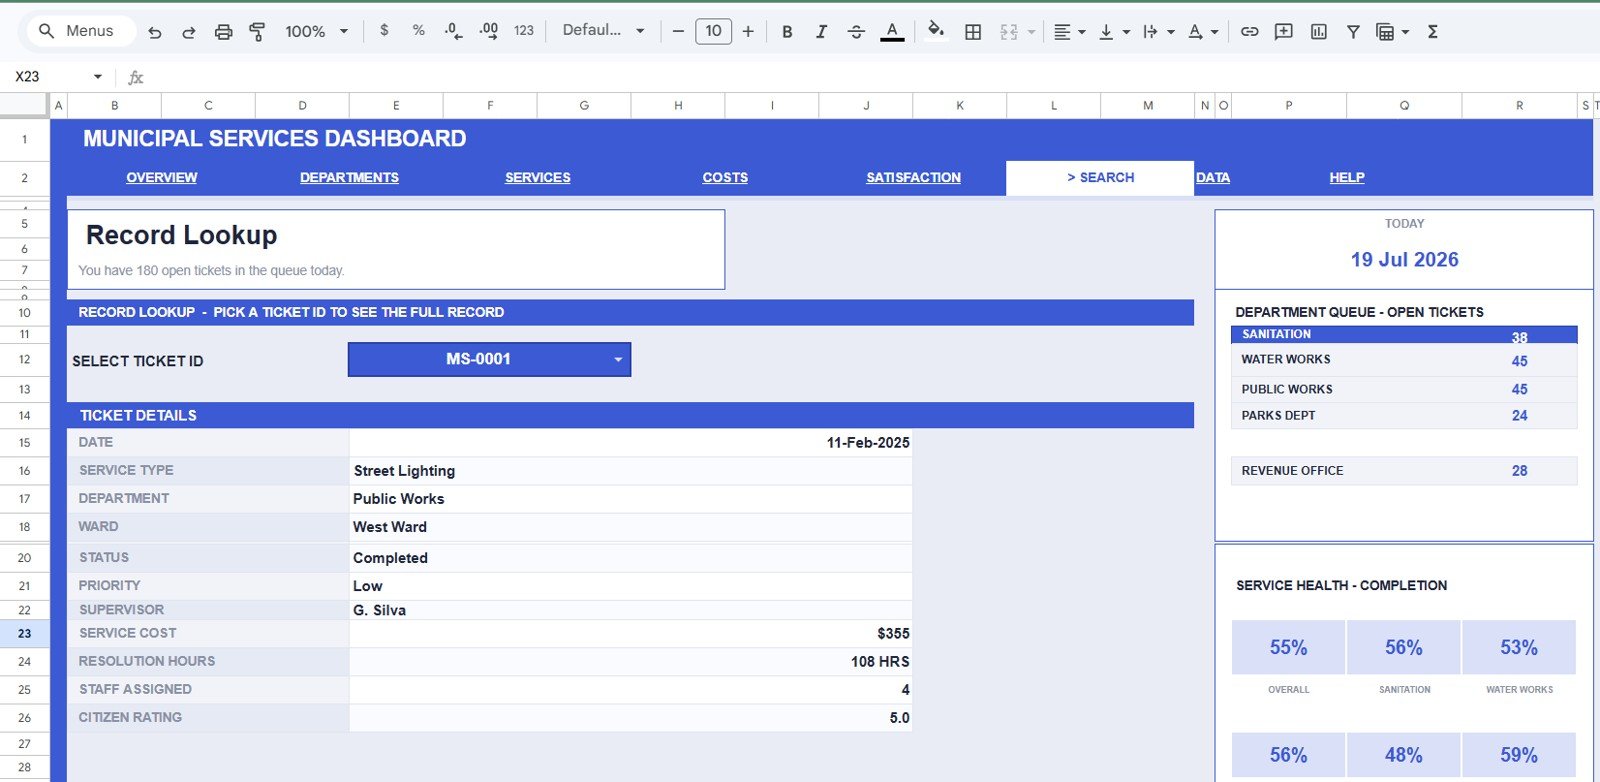
- Ticket lookup: Select a Ticket ID and view the full service record in one search sheet.
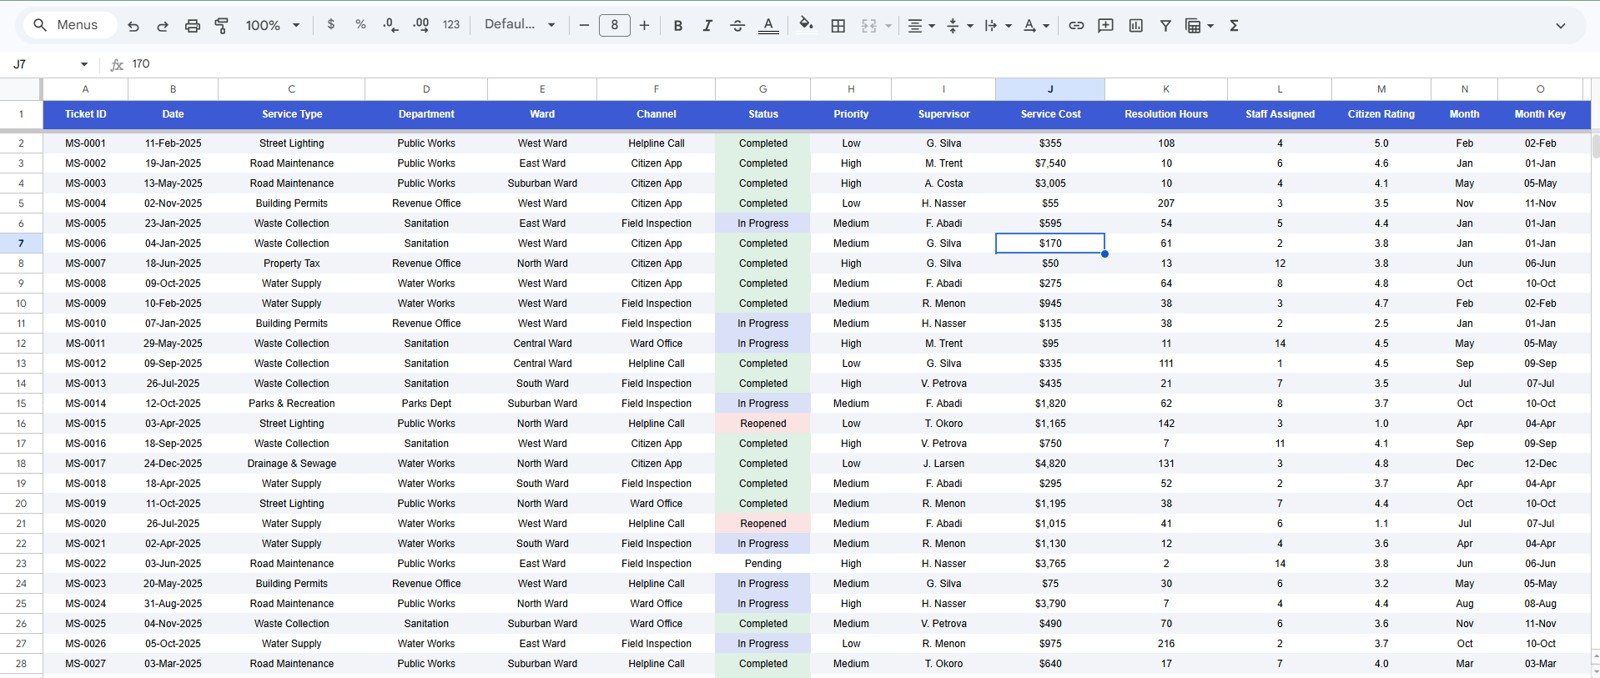
- Editable data sheet: Replace sample records with your own municipal service data in the same column format.
What’s Inside the Municipal Services Dashboard in Google Sheets
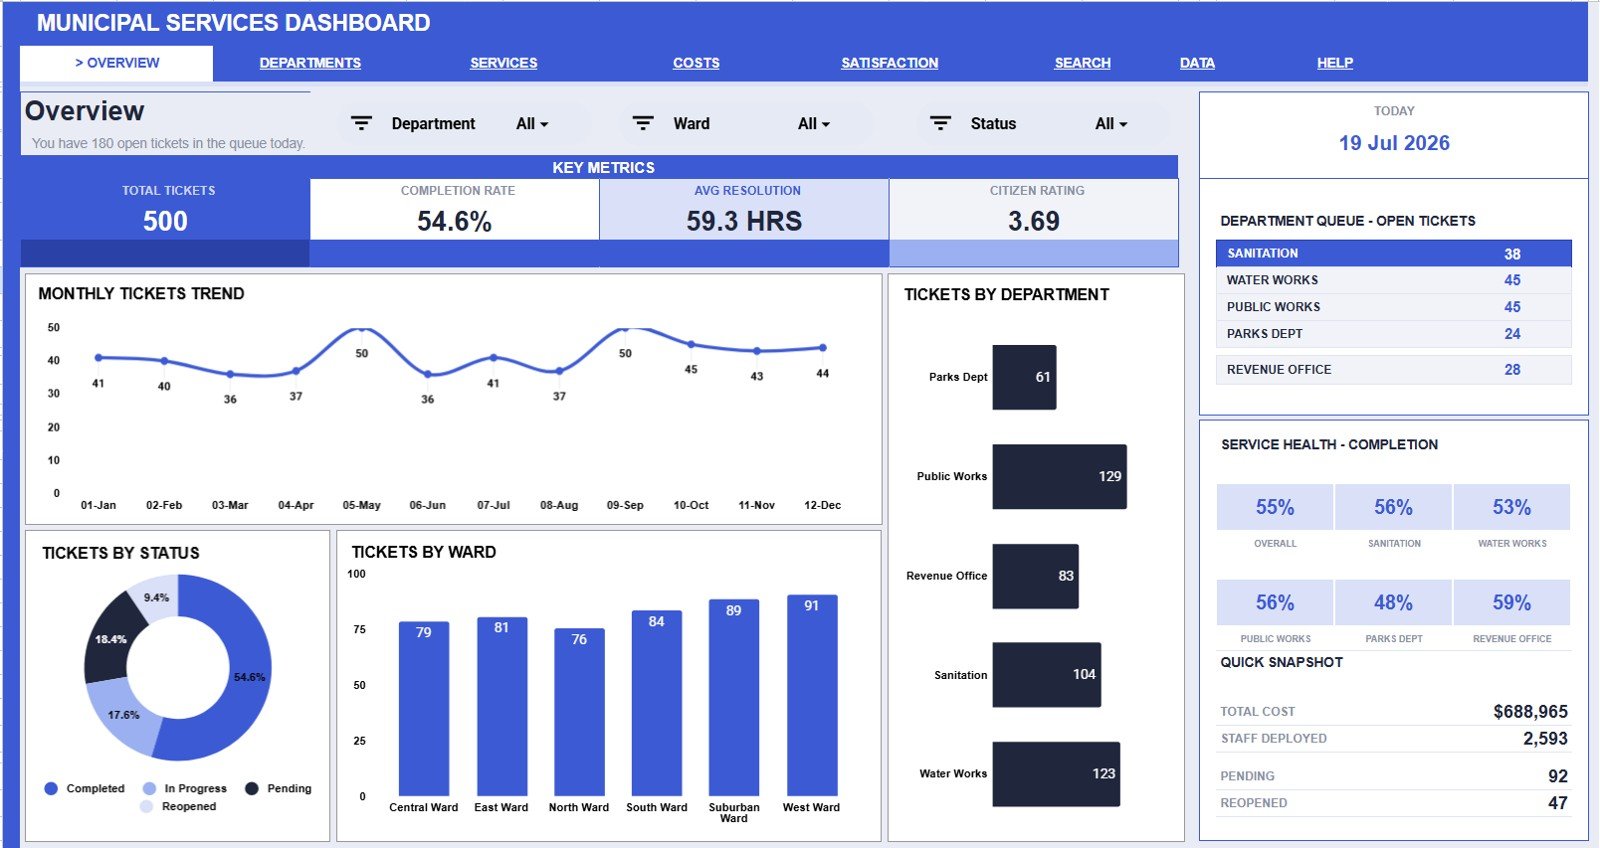
Overview Page
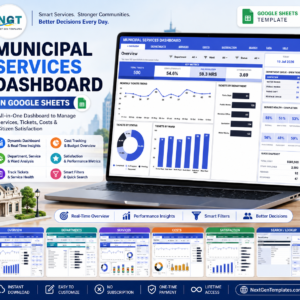
The Overview page shows the four headline cards: Total Tickets, Completion Rate, Avg Resolution, and Citizen Rating. It also includes charts for Tickets by Month, Tickets by Status, Tickets by Ward, Tickets by Department, Open Tickets by Department, and Completion Rate by Department.
Departments
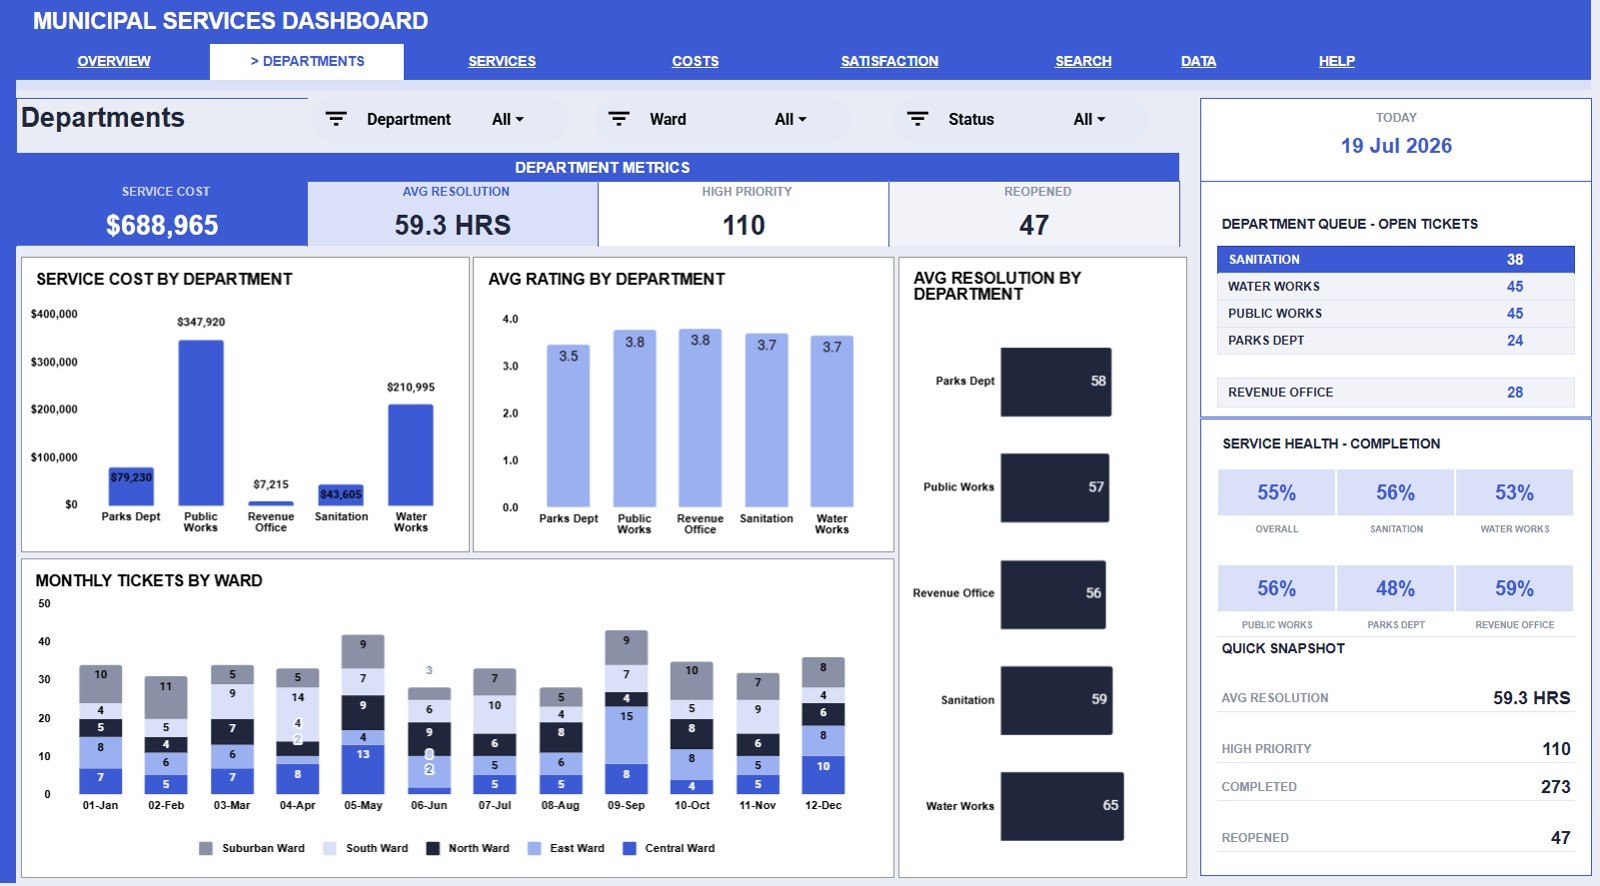
The Departments tab compares Service Cost by Department, Avg Rating by Department, Avg Resolution by Department, Monthly Tickets by Ward, Open Tickets by Department, and Completion Rate by Department.
Services
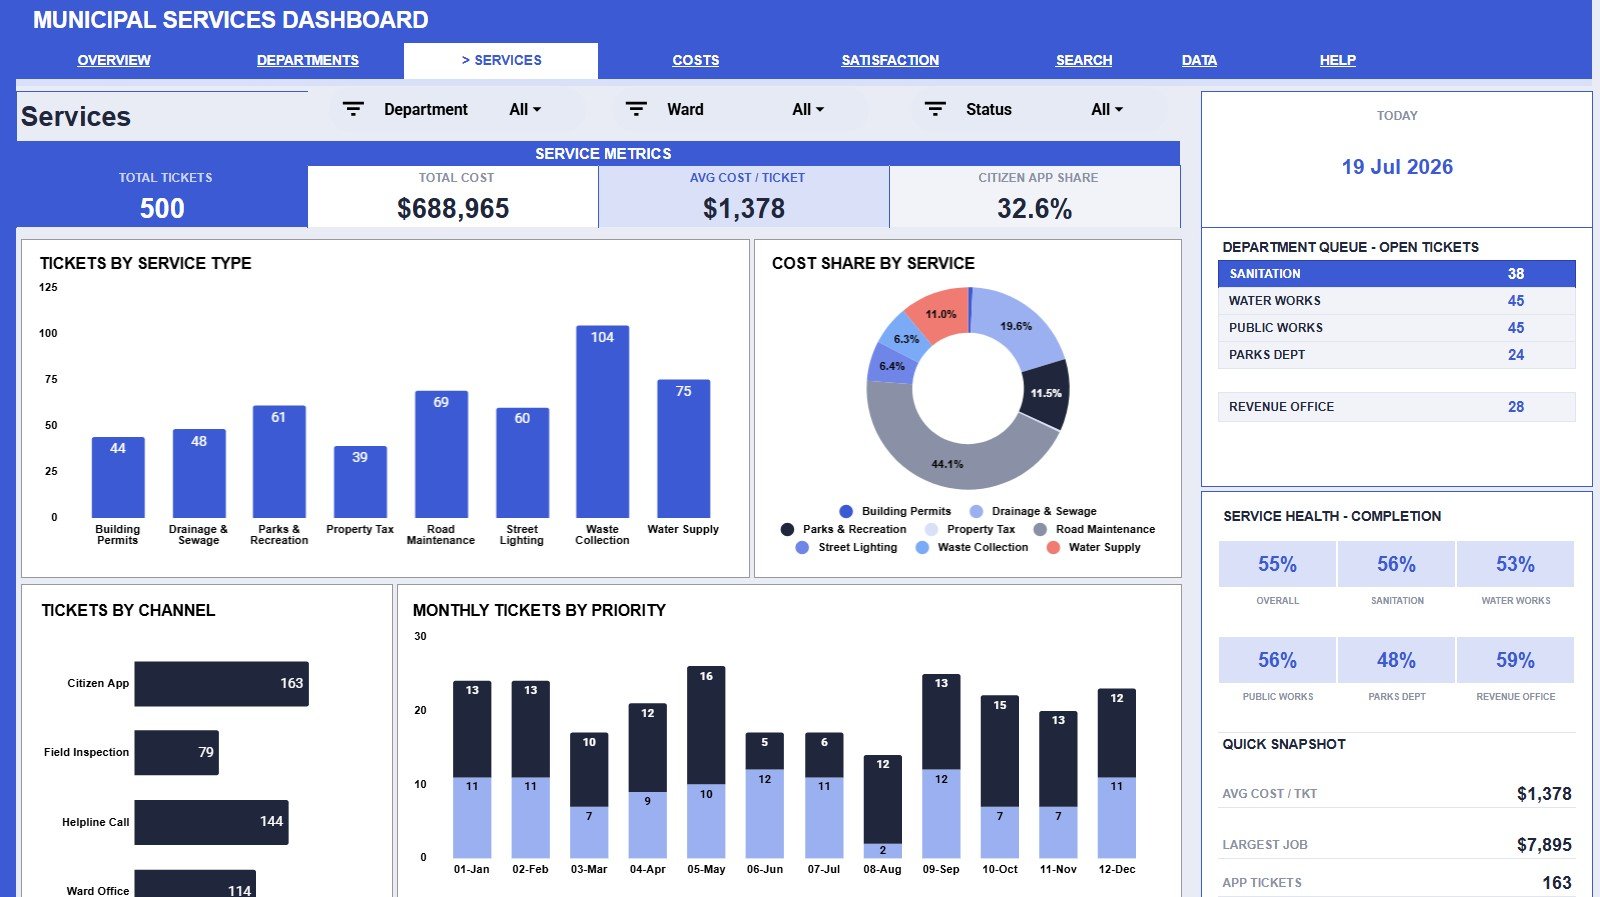
The Services tab breaks down Tickets by Service Type, Cost Share by Service, Tickets by Channel, Monthly Tickets by Priority, Open Tickets by Department, and Completion Rate by Department.
Costs
The Costs tab reviews Service Cost by Month, Cost by Ward, Cost by Channel, Staff Deployed by Month, Open Tickets by Department, and Completion Rate by Department.
Satisfaction
The Satisfaction tab focuses on Citizen Rating by Month, Tickets by Supervisor, Avg Rating by Priority, Avg Resolution by Month, Open Tickets by Department, and Completion Rate by Department.
Search Sheet Tab
The Search Sheet lets users select a Ticket ID and view the matching date, service type, department, ward, status, priority, supervisor, service cost, resolution hours, staff assigned, and citizen rating.
Data Sheet Tab
The Data Sheet is where users add municipal service records in the same format as the sample data. Keeping the Ticket ID, date, service type, department, ward, status, priority, supervisor, cost, resolution, staff, and rating fields consistent keeps the dashboard connected.
Municipal Services Dashboard in Google Sheets vs. Microsoft Excel Dashboard vs. Paid CRM/SaaS – Where This Fits
| Feature | This template | Microsoft Excel dashboard | Paid civic service SaaS |
|---|---|---|---|
| Cost | $9.99 sale price, one-time | Template cost plus Microsoft licensing | Usually monthly, annual, or contract pricing |
| Platform | Google Sheets in Drive | Excel desktop or web | Vendor-hosted system |
| Setup time | Copy file and replace sample records | Open workbook and customize | Often needs onboarding and configuration |
| Real-time collaboration | Built into Google Sheets sharing | Available through OneDrive or SharePoint | Usually role-based by account |
| Ticket ID lookup | Included Search Sheet | Must be built or customized | Usually included |
| Customizable fields | Editable sheet labels, charts, and formulas | Editable workbook structure | Depends on vendor settings |
| Best fit | Spreadsheet-first municipal reporting | Teams standardized on Excel | Teams needing portals, automation, and audit controls |
Who This Template Is For – and Who It’s Not For
This template is for municipal managers, city service desks, public works teams, ward supervisors, citizen-service analysts, local-government administrators, and consultants who already track service tickets and want faster reporting in Google Sheets.
It is not a full 311 platform, citizen portal, work-order dispatch system, payment system, GIS map, legal records archive, or regulated case-management application. If you need automated ticket routing, public submission forms, field-worker mobile workflows, or strict audit controls, use dedicated civic-service software and treat this dashboard as a reporting layer.
How to Use the Municipal Services Dashboard in Google Sheets
- Open the PDF guide from your purchase and copy the Google Sheets template to your Drive.
- Go to the Data Sheet and replace the sample rows with your own municipal service tickets.
- Keep the same column format so cards, charts, slicers, and lookup formulas work correctly.
- Use slicers on the dashboard pages to filter by department, ward, status, priority, channel, supervisor, or month.
- Use the Search Sheet to select one Ticket ID and inspect the full service record quickly.
Real-World Use Cases
Priya, a city service desk manager: uses the Overview page before weekly leadership meetings to report ticket volume, completion rate, average resolution hours, and citizen rating.
Marcus, a public works supervisor: opens the Costs and Departments pages to compare staffing, service cost, and open tickets by department and ward.
Leah, a municipal performance analyst: uses the Satisfaction tab to review citizen rating trends by priority, supervisor, and month.
Frequently Asked Questions
What does this dashboard track?
It tracks tickets, departments, wards, service types, channels, statuses, priorities, supervisors, service cost, resolution hours, staff assigned, and citizen rating.
Does it work in Google Sheets?
Yes. It is built for Google Sheets, so users can copy it to Google Drive and share it with normal Google permissions.
Can I customize departments and wards?
Yes. The file is editable. Keep the data columns consistent if you want the cards, charts, slicers, and Search Sheet to keep updating correctly.
Does it include a search function?
Yes. The Search Sheet lets users select a Ticket ID and view the full municipal service record in one place.
Is this a replacement for a 311 system?
No. It is a reporting dashboard, not a citizen intake portal, dispatch tool, or formal case-management platform.
About the Author
Built by PK – Microsoft Certified Professional with 15+ years of Excel, Google Sheets, and Power BI experience. Founder of NextGenTemplates, reaching 300K+ subscribers across YouTube channels. Every template is hand-built and tested before release.
Explore Related Templates
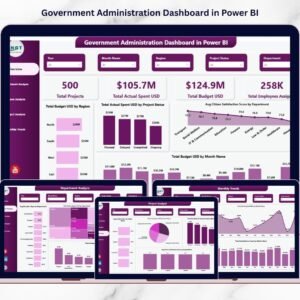
- Government Administration Dashboard in Google Sheets for broader public-sector request reporting.
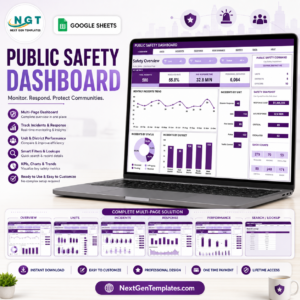
- Public Safety Dashboard in Google Sheets for incident, response, and safety reporting.
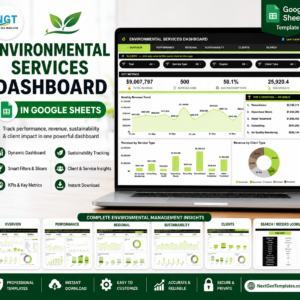
- Environmental Services Dashboard in Google Sheets for environmental service operations.
- Municipal Services KPI Scorecard in Google Sheets for KPI-style scorecard tracking.
- Browse more Google Sheets templates and Google Sheets dashboard templates.
Get the Municipal Services Dashboard in Google Sheets to turn municipal service tickets into a clear, filterable dashboard for department, ward, cost, completion, and citizen satisfaction reviews.
Watch the step-by-step video Demo:
Last updated: July 19, 2026.
Compatibility and Requirements
- Works in Google Sheets. You need a free Google account and a web browser.
- You filter the dashboard with slicers and pick a Ticket ID on the Search Sheet. Google explains in-cell dropdown lists in Create an in-cell dropdown list.






























Reviews
There are no reviews yet.