

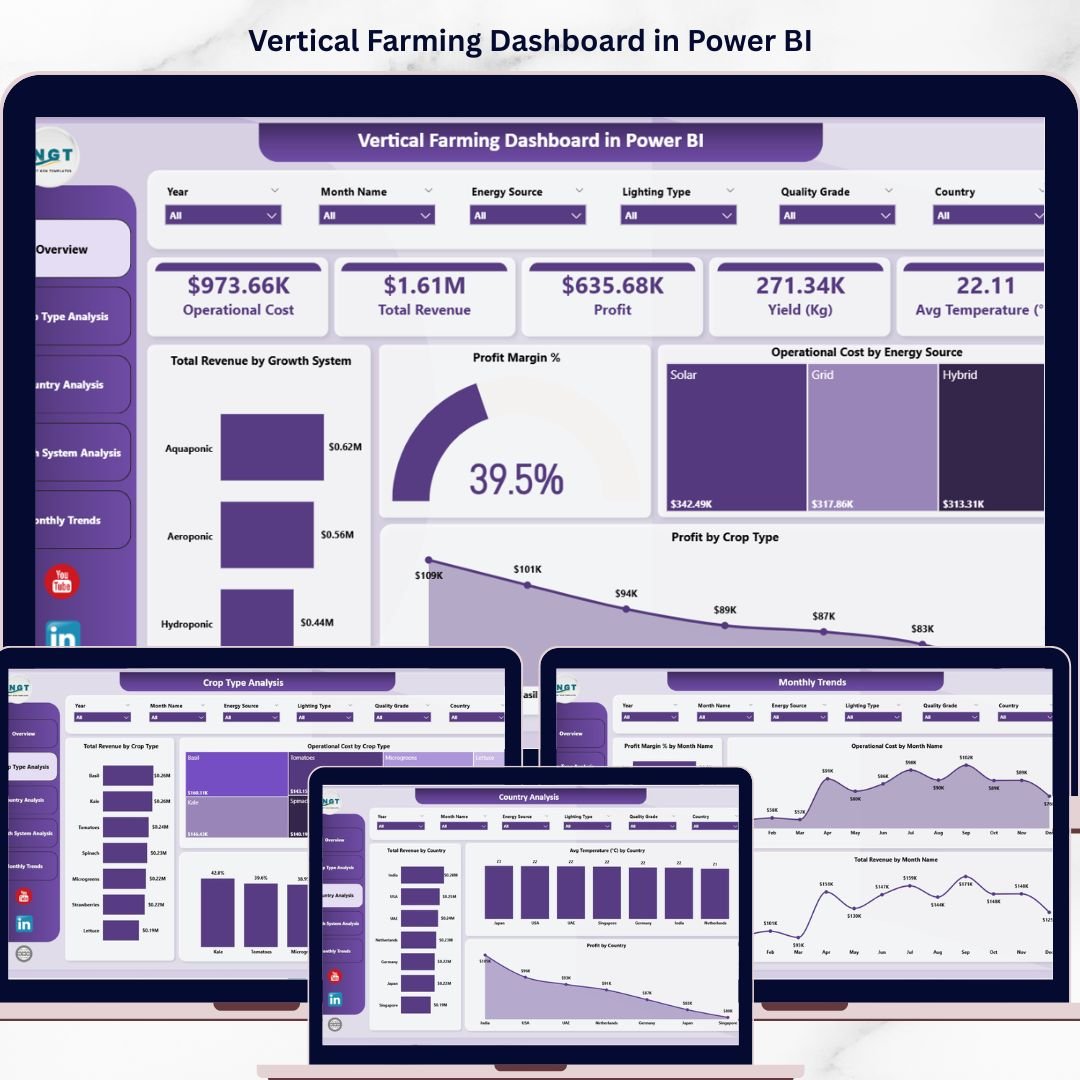

Vertical Farming Dashboard in Power BI is a powerful, ready-to-use analytical solution designed for modern indoor farming businesses that want to track operational costs, revenue, profit, yield, and temperature metrics in one centralized interactive report. Managing vertical farming operations can quickly become complex when you need to monitor crop performance across multiple growth systems, energy sources, countries, and time periods simultaneously. Instead of relying on scattered spreadsheets, this dashboard in Power BI brings all your critical metrics together in beautifully designed visual pages that update dynamically with your data.
🔑 Key Features of Vertical Farming Dashboard in Power BI
🌱 5 Interactive Dashboard Pages – This product includes five fully designed analytical pages covering Overview, Crop Type Analysis, Country Analysis, Growth System Analysis, and Monthly Trends to give you a complete picture of your vertical farming operations.
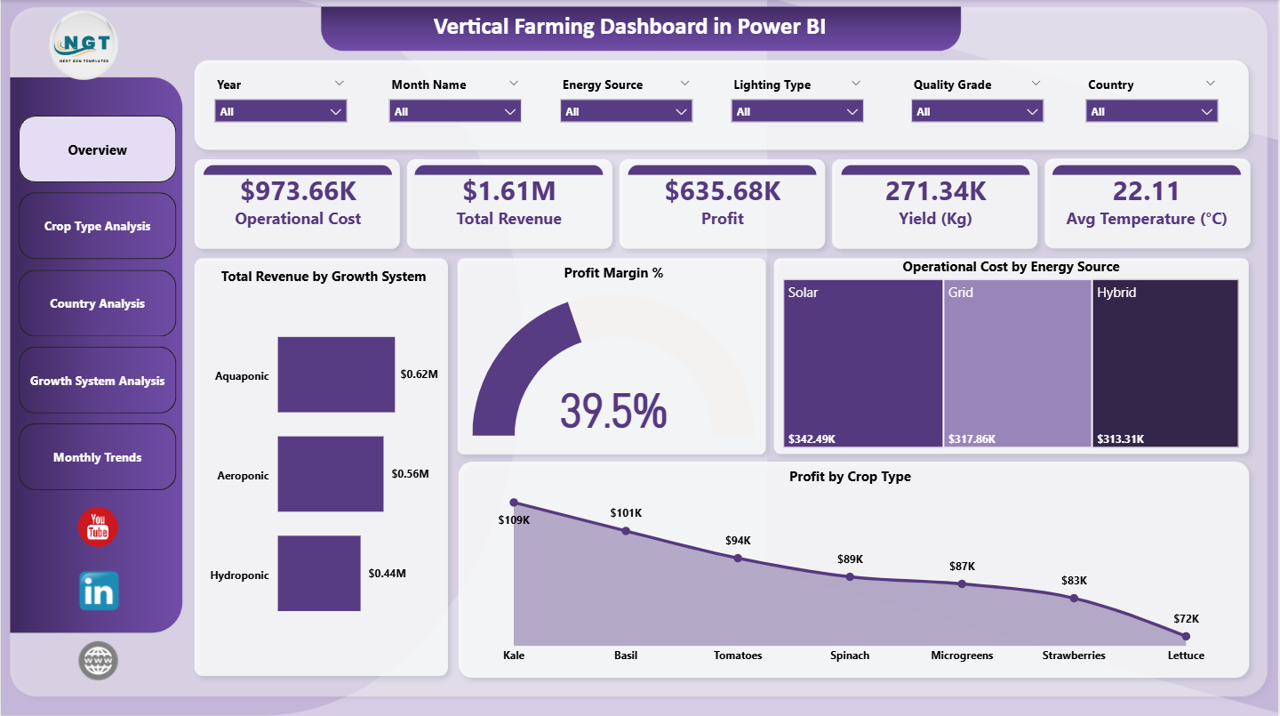
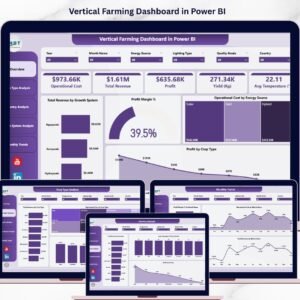
📊 High-Level KPI Cards – Instantly monitor top-line metrics including Operational Cost, Total Revenue, Profit, Yield in Kg, and Average Temperature in Celsius right from the overview page.
📈 Advanced Visual Analytics – Explore your farming data through powerful charts that show Total Revenue by Growth System, Profit Margin Percentage, Operational Cost by Energy Source, and Profit by Crop Type.
🎛️ Dynamic Slicers and Filters – Apply filters instantly to explore specific data segments such as crop type, country, growth system, energy source, and month for focused decision-making.
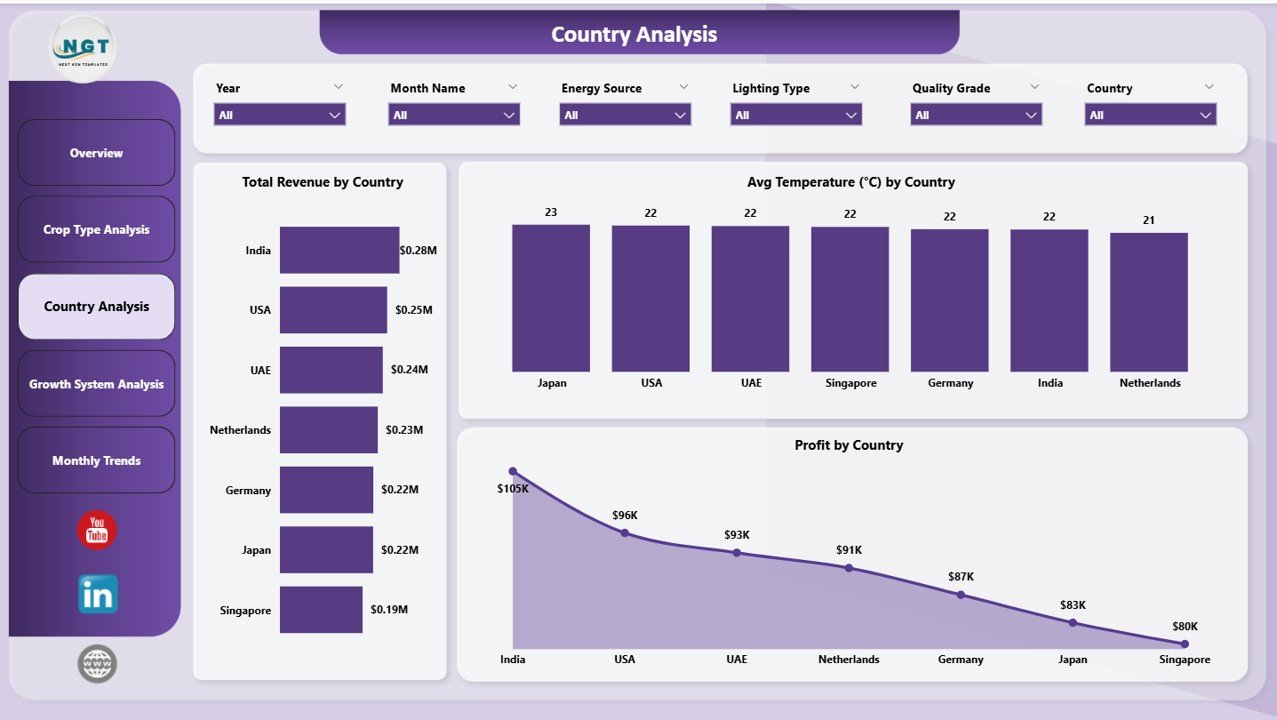
🌍 Country-Level Performance Insights – Compare Total Revenue by Country, Average Temperature by Country, and Profit by Country to identify top-performing geographic regions for your operations.
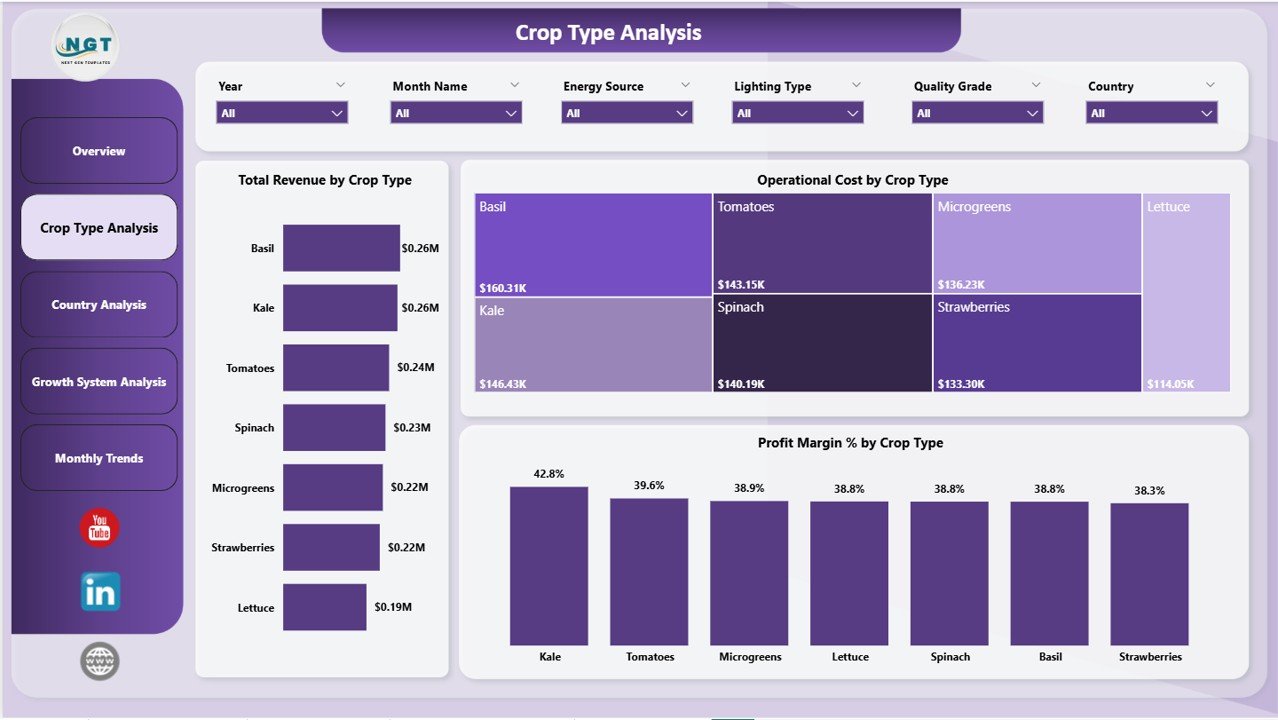
🌿 Crop Type Deep Dive – Analyze Total Revenue by Crop Type, Operational Cost by Crop Type, and Profit Margin Percentage by Crop Type to determine which crops deliver the best return on investment.
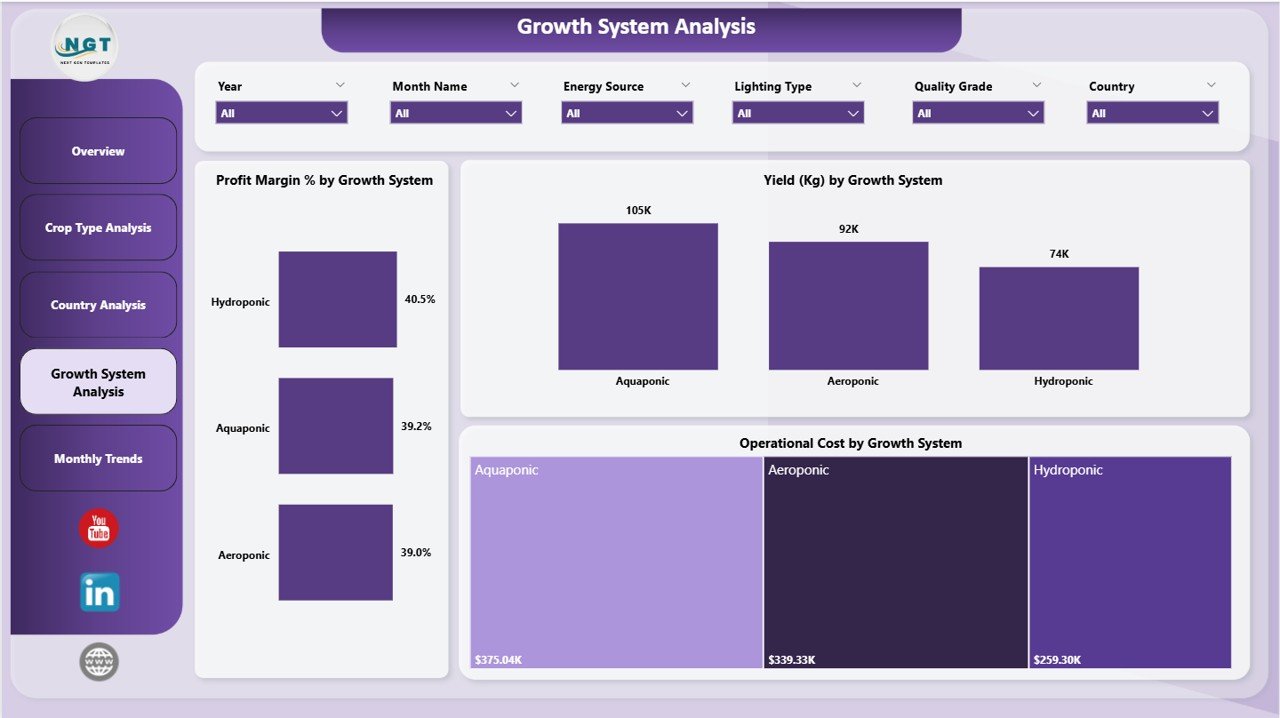
⚙️ Growth System Evaluation – Compare Profit Margin Percentage by Growth System, Yield by Growth System, and Operational Cost by Growth System to optimize your farming production strategy.
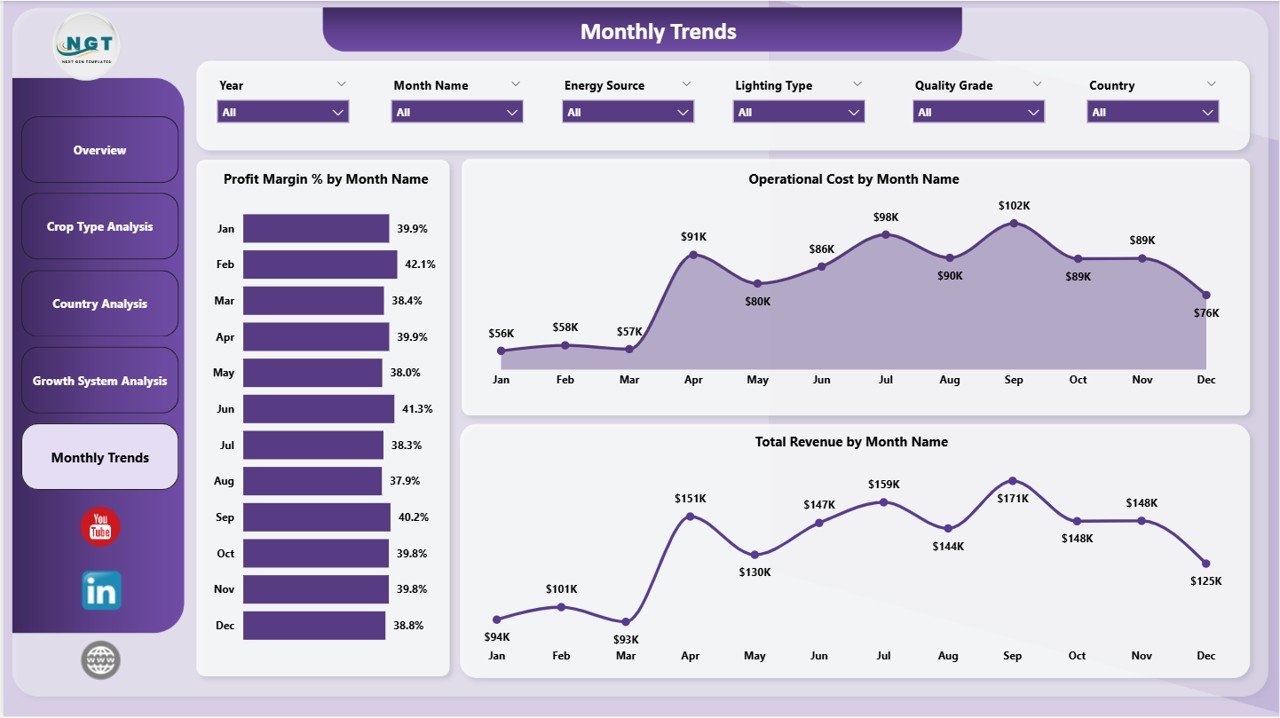
📅 Monthly Trend Monitoring – Track Profit Margin by Month, Operational Cost by Month, and Total Revenue by Month to identify seasonal patterns and plan ahead with confidence.
🚀 Professional and Ready-to-Use – Simply connect or import your vertical farming data and the dashboard updates automatically with clear insights for better planning, reporting, and decision-making.
📦 What’s Inside the Vertical Farming Dashboard in Power BI
Inside this digital product, you get a professionally structured Power BI dashboard with five interactive analysis pages designed to help vertical farming businesses monitor and optimize their operations.
The Overview Page gives you a quick summary of farm performance with KPI cards showing Operational Cost, Total Revenue, Profit, Yield in Kg, and Avg Temperature. It also includes visual charts for Revenue by Growth System, Profit Margin Percentage, Cost by Energy Source, and Profit by Crop Type.
The Crop Type Analysis Page helps you compare revenue, operational costs, and profit margins across different crop categories, making it easier to identify the most profitable crops in your vertical farm.
The Country Analysis Page provides geographic insights by comparing revenue, temperature conditions, and profit performance across different countries where your farming operations are active.
The Growth System Analysis Page evaluates different growth technologies by comparing profit margins, yield output, and operational costs so you can make informed decisions about which systems to scale.
The Monthly Trends Page tracks time-based performance, helping you understand seasonal fluctuations in revenue, costs, and profitability to support better planning and forecasting.
As a result, this dashboard gives you a centralized, interactive, and professional-grade reporting tool designed specifically for vertical farming management and optimization.
⚙️ How to Use the Vertical Farming Dashboard in Power BI
🚀 Step 1: Connect or import your vertical farming operational data into the Power BI file. Include data related to crop types, growth systems, energy sources, countries, revenue, costs, yield, and temperature.
📊 Step 2: Refresh the dashboard to automatically update all KPI cards, charts, and visual reports with your latest data.
🎛️ Step 3: Use the interactive slicers and filters on each page to focus on specific crops, countries, growth systems, or time periods that matter most to your analysis.
🌍 Step 4: Review the Country Analysis and Growth System Analysis pages to identify your strongest performing regions and farming technologies.
📅 Step 5: Check the Monthly Trends page regularly to monitor seasonal patterns, revenue changes, and cost fluctuations for smarter planning.
💡 Step 6: Use insights from the dashboard in team meetings, investor presentations, budgeting sessions, and strategy reviews to drive better business decisions with data.
👥 Who Can Benefit from This Vertical Farming Dashboard in Power BI
🌱 Vertical Farm Owners who want better control over production, revenue, and profitability
🏢 Indoor Farming Companies that need centralized dashboards for operational performance tracking
📊 Farm Operations Managers who monitor daily metrics, cost control, and yield performance
🌿 Agricultural Consultants who advise clients on improving vertical farming efficiency
💰 Financial Planning Teams who need clear reporting on farm revenue and operational expenses
🌍 Multi-Location Farm Operators who compare country-level and system-level performance
📈 Data-Driven Agriculture Professionals who want smarter decision-making tools
🚜 AgriTech Startups looking for affordable and professional dashboard solutions for vertical farming
This dashboard is more than just a report. It is a valuable management tool that helps you simplify vertical farming reporting, improve crop productivity, and increase profitability with confidence. If you want to stop relying on scattered files and start making smarter farming decisions, this dashboard is an excellent investment.
📖 Click here to read the Detailed Blog Post
🎥 Visit our YouTube channel to learn step-by-step video tutorials
👉 YouTube.com/@NextGenTemplates
Watch the step-by-step video tutorial:
Compatibility and Requirements
- Works in Power BI Desktop, which is free to download. Microsoft explains the download in Get Power BI Desktop.
- You connect or import your own vertical farming data: crop types, growth systems, energy sources, countries, revenue, costs, yield and temperature.
Frequently Asked Questions
How many pages does the dashboard have?
Five pages: Overview, Crop Type Analysis, Country Analysis, Growth System Analysis and Monthly Trends.
Which KPIs show on the Overview page?
Operational Cost, Total Revenue, Profit, Yield in Kg and Avg Temperature. The page also has charts for revenue by growth system, profit margin percentage, cost by energy source and profit by crop type.
Can I compare crops and countries?
Yes. The Crop Type Analysis page compares revenue, operational cost and profit margin by crop. The Country Analysis page compares revenue, average temperature and profit by country.
How do I filter the data?
Use the slicers on each page to focus on a crop type, country, growth system, energy source or month.
Is there an Excel version?
Yes. See the Vertical Farming Dashboard in Excel.
Related Farming Dashboards
- Vertical Farming Dashboard in Excel: the same topic in Excel
- Indoor Farming Systems Dashboard in Power BI: indoor growing systems in Power BI
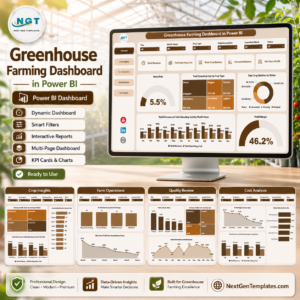
- Greenhouse Farming Dashboard in Power BI: greenhouse operations in Power BI
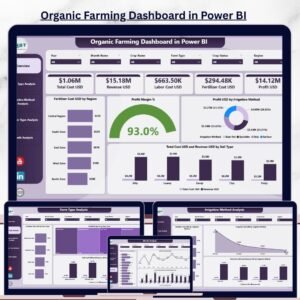
- Organic Farming Dashboard in Power BI: organic farm performance in Power BI
- Drone Farming Startups Dashboard in Power BI: a farming analytics dashboard for startups
Browse all Power BI dashboards.




























Reviews
There are no reviews yet.