

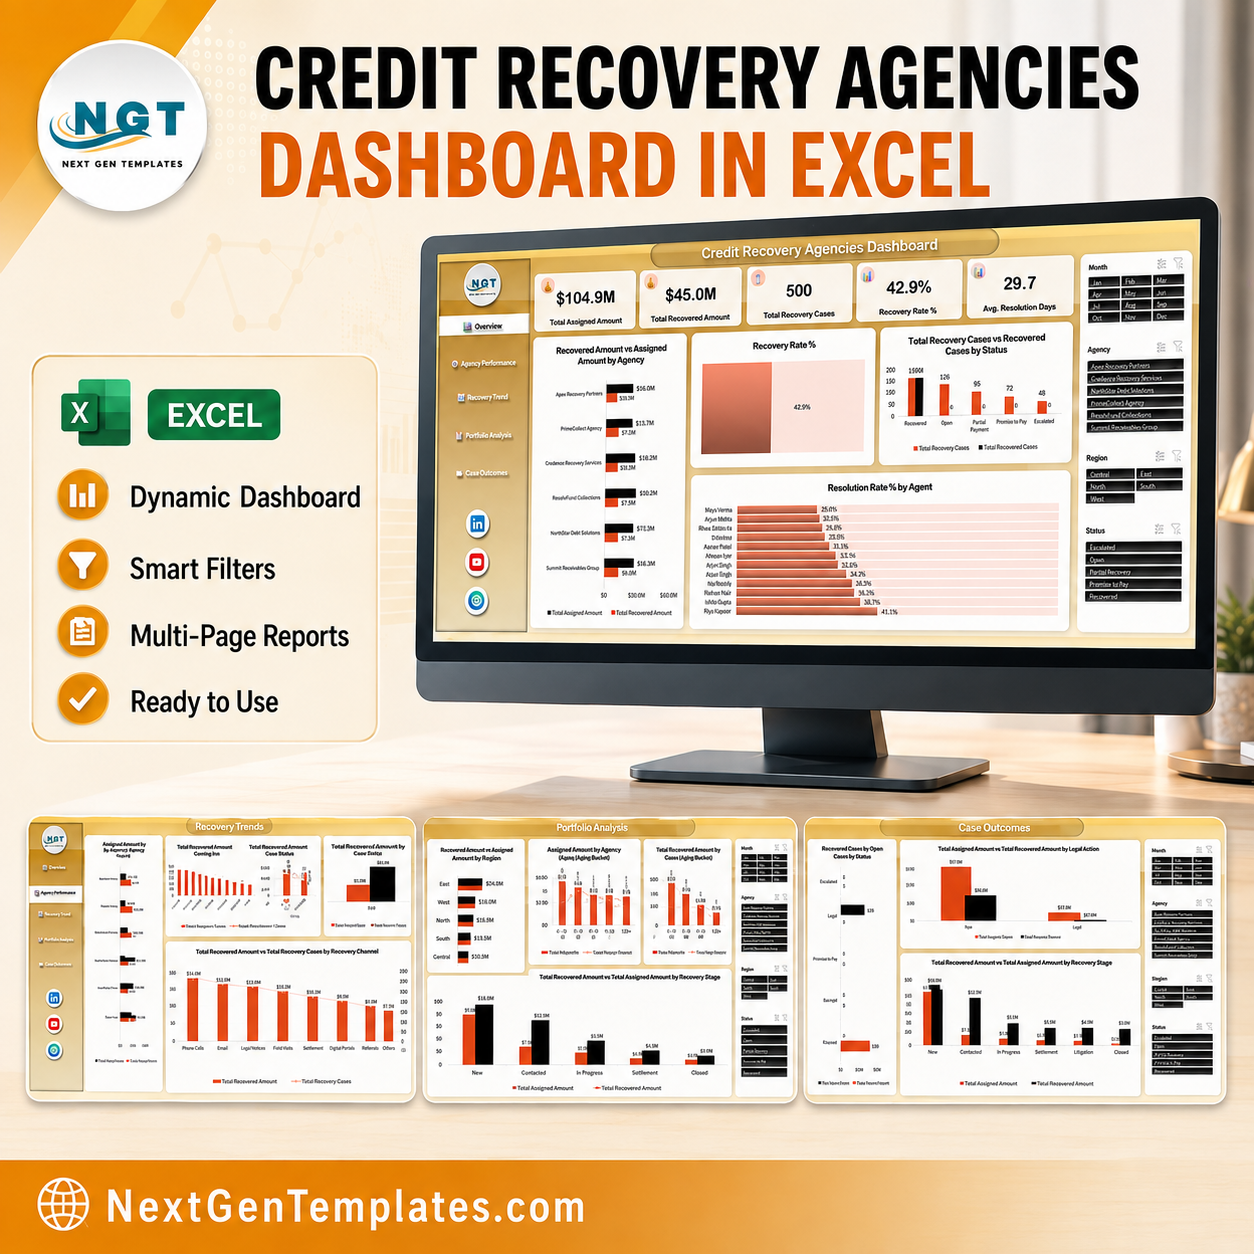

The Credit Recovery Agencies Dashboard in Power BI takes a 500-case recovery book worth ₹104.89M of assigned debt and shows you, in five clicks, which of your six agencies, twelve agents, six portfolios and four risk bands are actually turning that paper into cash. The sample book recovers ₹45.03M at a 42.9% recovery rate, with ₹59.86M still outstanding and an average of 226 days past due — and every one of those numbers is a live DAX measure that recalculates the moment you swap in your own data. Built and tested by a Microsoft Certified Professional, delivered as a plain .pbix you own outright. One payment, lifetime access, instant download, and a user manual PDF in the same zip. Credit Recovery Agencies Dashboard in Power BI
Key Features of the Credit Recovery Agencies Dashboard in Power BI
- 5 report pages plus a navigation rail — Overview, Recovery Trends, Agency Performance, Legal & Risk and Debtor Segments, with a left-hand rail that jumps between them in one click.
- 25 KPI cards with month-on-month deltas — five per page, each carrying its own sparkline and a coloured MoM arrow (Dec 2025 against Nov 2025 in the sample).
- 5 synced slicers on every page — Date Range, Region, Agency and Portfolio are constant, and the fifth changes with the page: Case Status, Recovery Channel, Agent, Risk Band or Debtor Segment.
- 19 charts and tables — combo charts, stacked columns, donuts, a bubble scatter of recovered value against recovery rate, plus two matrix scorecards.
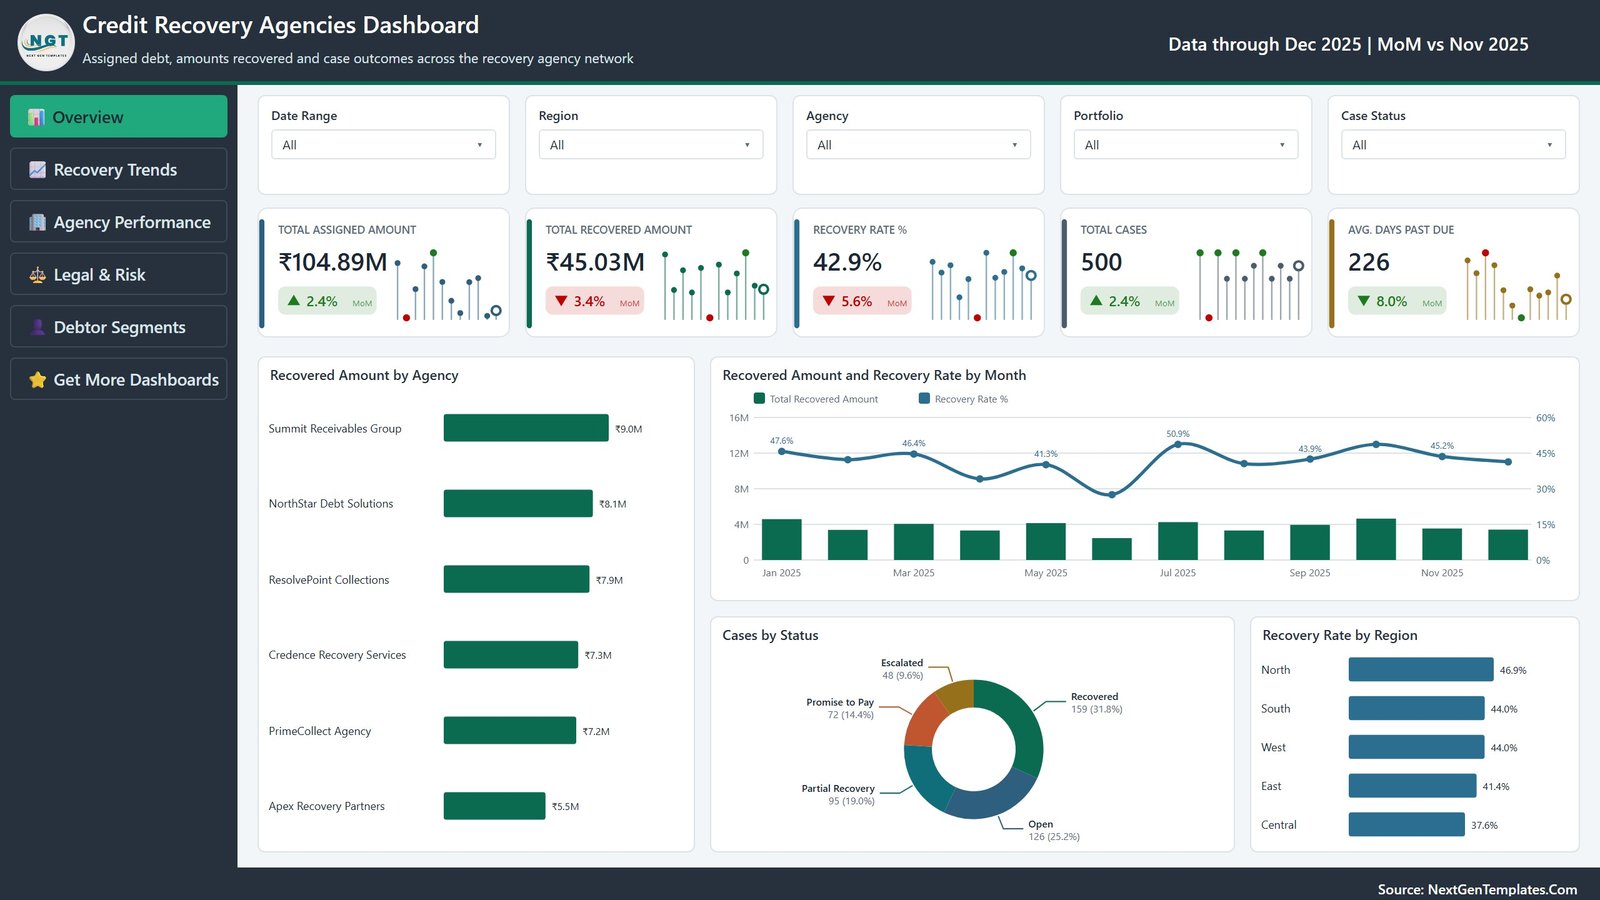
- Agency and agent league tables — rank six agencies from Summit Receivables Group (₹9.0M) down to Apex Recovery Partners (₹5.5M), and twelve agents from ₹5.5M to ₹2.1M.
- Risk Band Scorecard — cases, assigned amount, recovered amount and recovery rate side by side for Low (48.5%), Moderate (42.5%), High (42.0%) and Severe (39.2%).
- DPD ageing that tells the truth — 67.7% of the assigned book (₹71.0M) sits in the 180+ bucket, so you can see how much of your recovery target is genuinely collectable.
- Legal escalation economics — escalation rate 9.6%, legal action rate 14.0%, and recovered value by recovery stage from Closed (₹31.5M) down to Legal Review (₹0.4M).
- A 22-column, 500-row data model — one flat
Datatable plus a generated Date table, so replacing the sample data is a Power Query source change, not a rebuild. - No subscription, no gateway, no add-ins — opens in the free Power BI Desktop and publishes to your own workspace if you have one.
What’s Inside the Credit Recovery Agencies Dashboard in Power BI
Page 1 — Overview. Assigned debt, amounts recovered and case outcomes across the whole agency network. Five cards carry Total Assigned Amount ₹104.89M, Total Recovered Amount ₹45.03M, Recovery Rate % 42.9%, Total Cases 500 and Avg. Days Past Due 226. Below them sit Recovered Amount by Agency, Recovered Amount and Recovery Rate by Month for all twelve months of 2025, Cases by Status (Recovered 159, Open 126, Partial Recovery 95, Promise to Pay 72, Escalated 48) and Recovery Rate by Region, where North leads at 46.9% and Central trails at 37.6%.
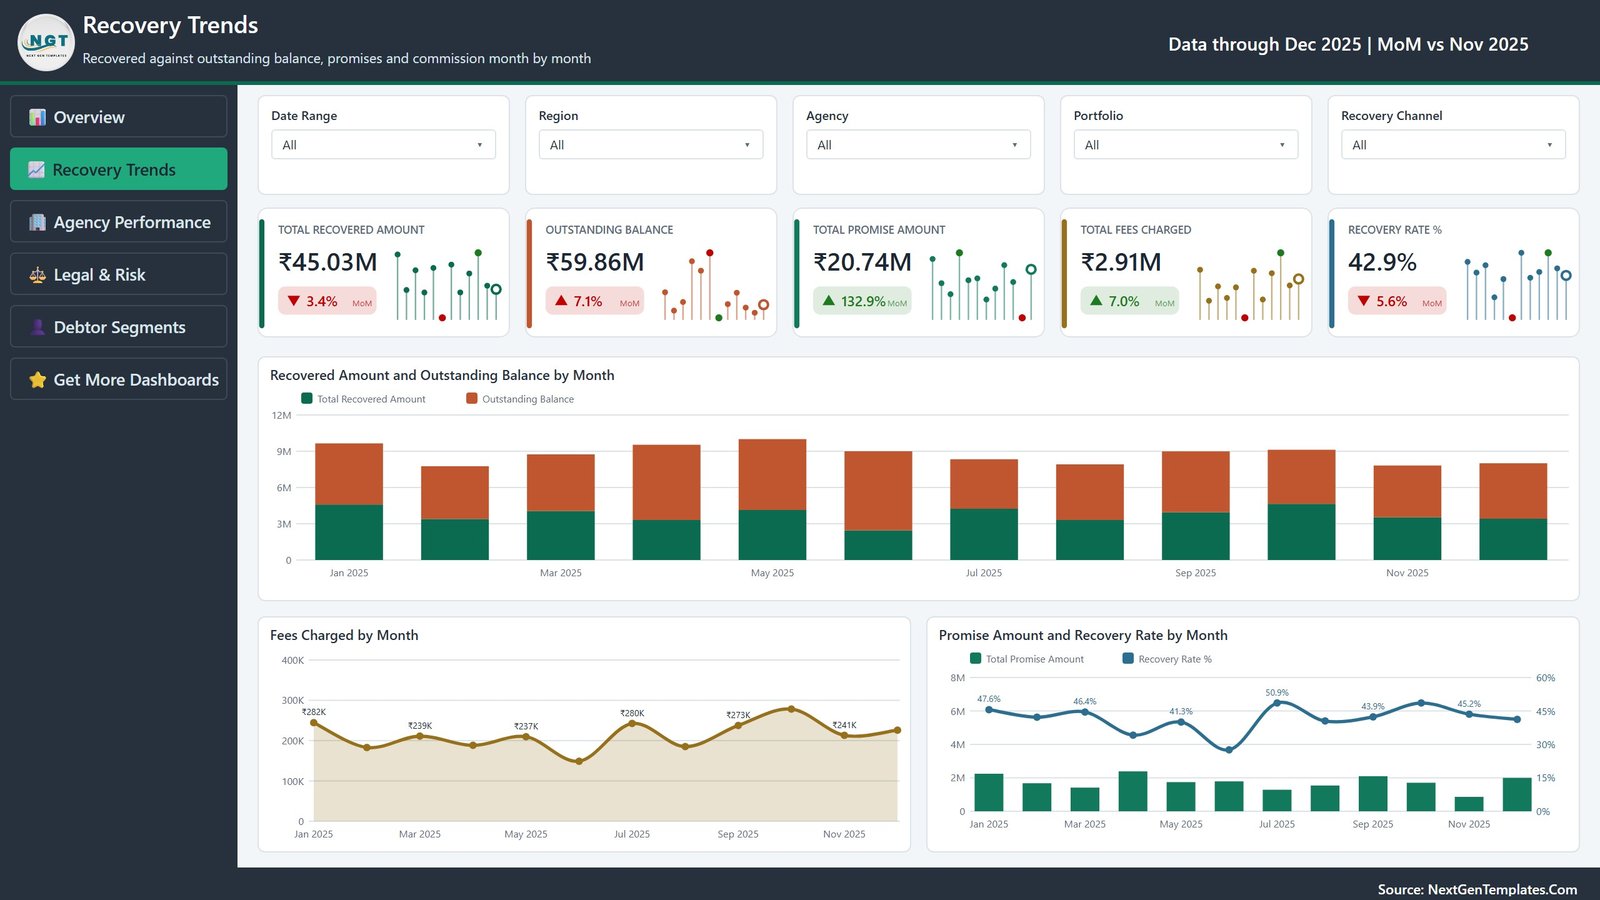
Page 2 — Recovery Trends. Recovered value against outstanding balance, promises and commission, month by month. Cards: Total Recovered Amount ₹45.03M, Outstanding Balance ₹59.86M, Total Promise Amount ₹20.74M, Total Fees Charged ₹2.91M and Recovery Rate % 42.9%. Recovered Amount and Outstanding Balance by Month stacks the two so the gap is visible at a glance, Fees Charged by Month runs from ₹282K in January to ₹241K in November, and Promise Amount and Recovery Rate by Month shows whether promises to pay are actually converting.
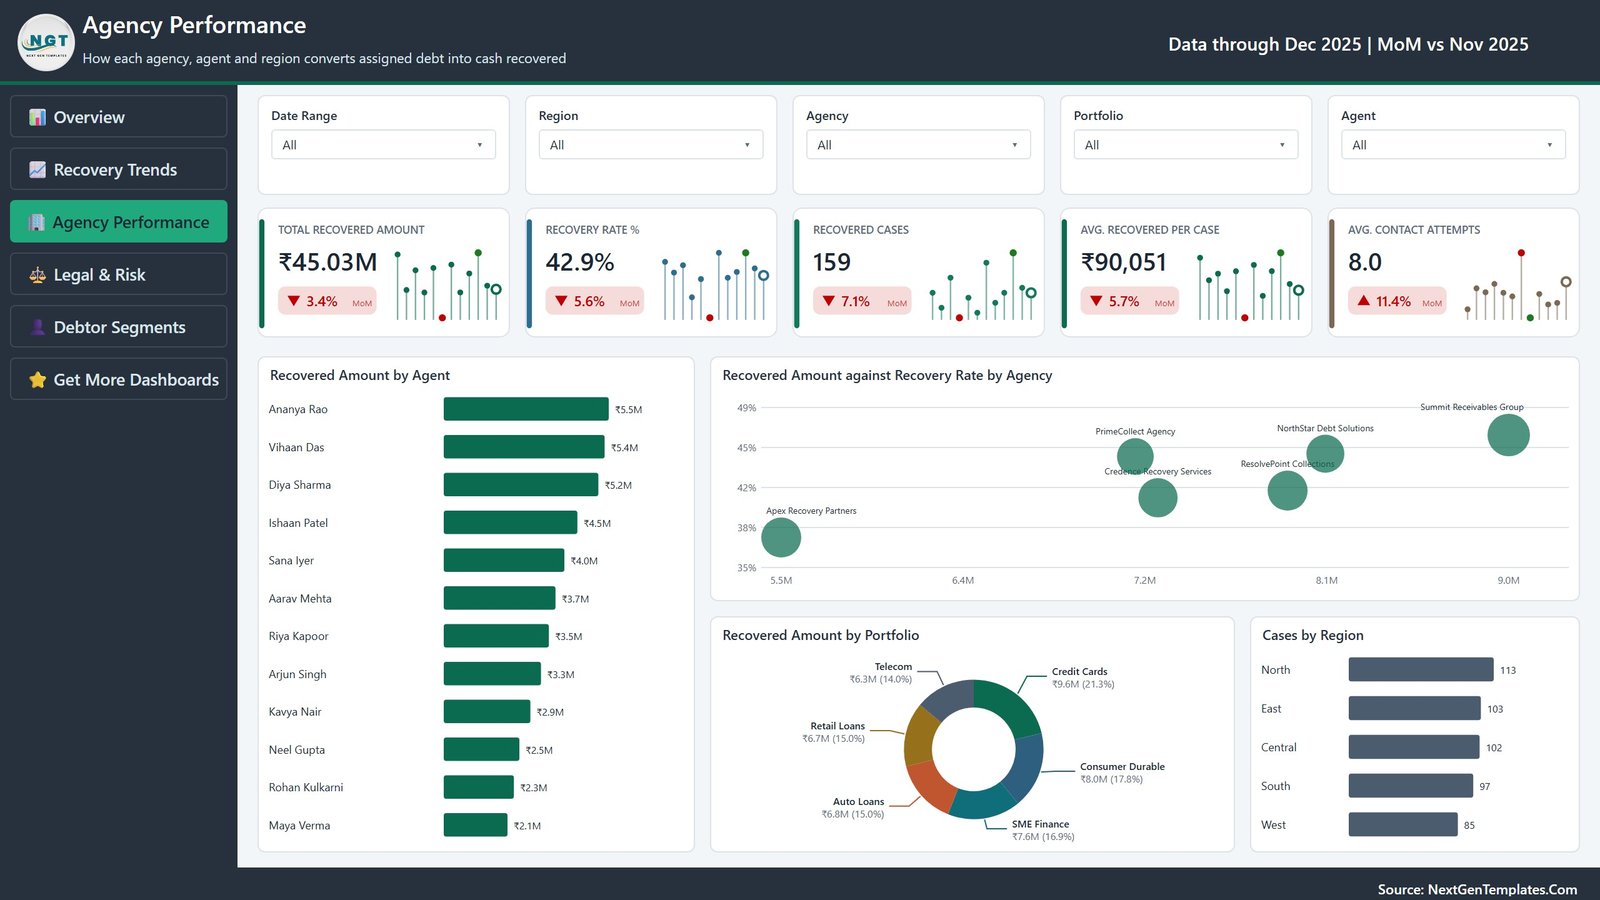
Page 3 — Agency Performance. How each agency, agent and region converts assigned debt into cash. Cards: Total Recovered Amount ₹45.03M, Recovery Rate % 42.9%, Recovered Cases 159, Avg. Recovered per Case ₹90,051 and Avg. Contact Attempts 8.0. Recovered Amount by Agent ranks all twelve agents, Recovered Amount against Recovery Rate by Agency plots volume against efficiency as a bubble chart, Recovered Amount by Portfolio splits Credit Cards (₹9.6M), Consumer Durable (₹8.0M), SME Finance (₹7.6M), Auto Loans (₹6.8M), Retail Loans (₹6.7M) and Telecom (₹6.3M), and Cases by Region shows the caseload split from North (113) to West (85).
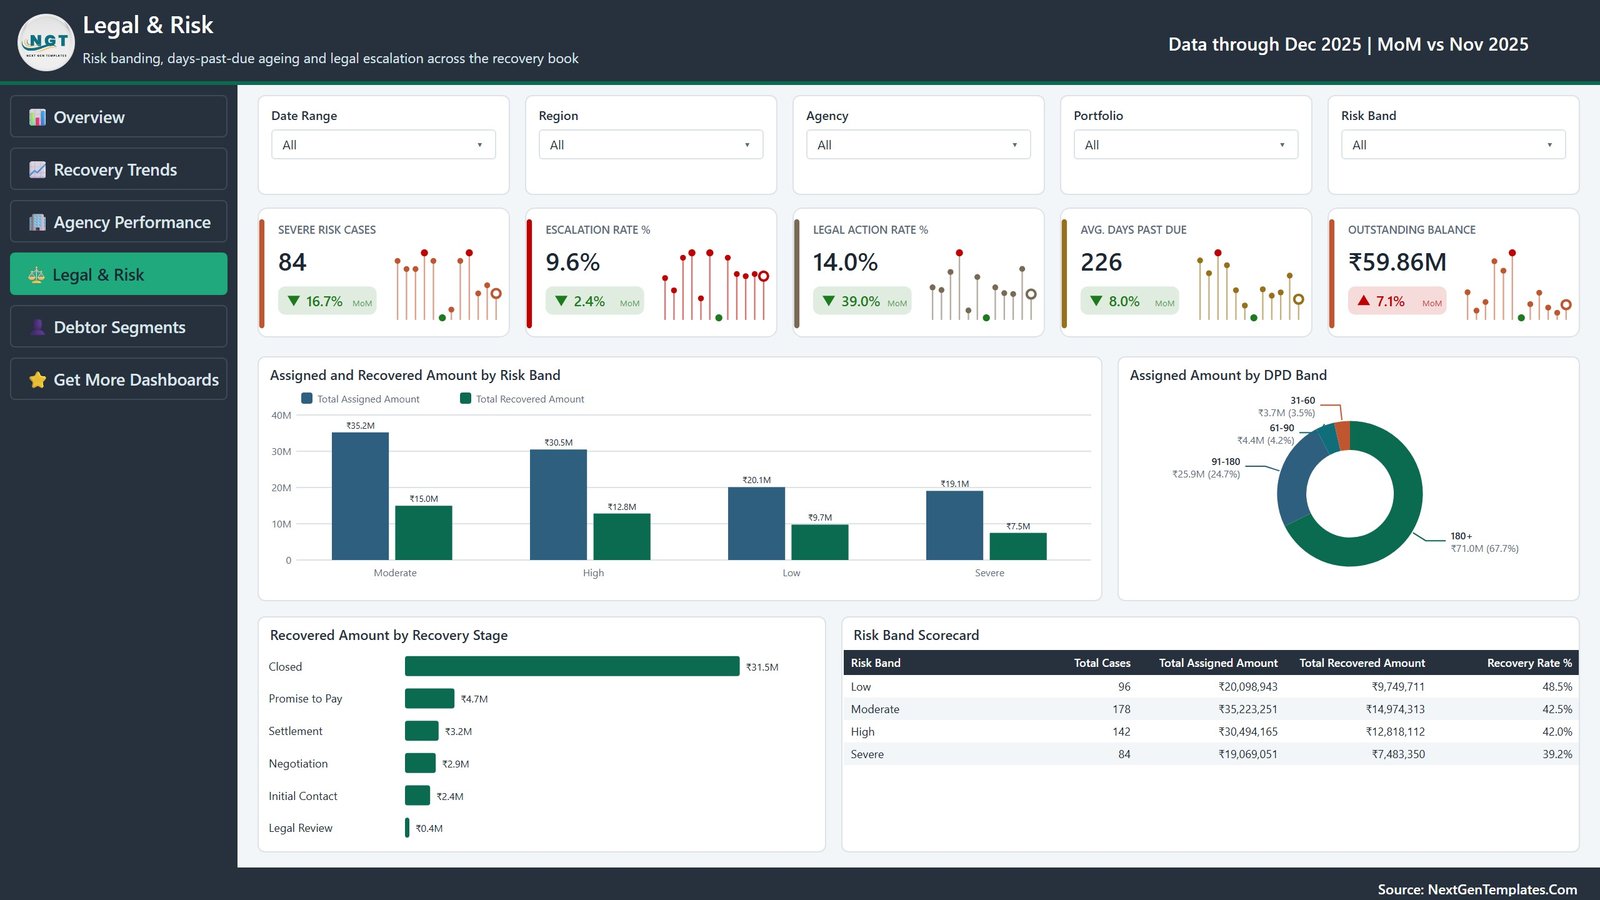
Page 4 — Legal & Risk. Risk banding, days-past-due ageing and legal escalation. Cards: Severe Risk Cases 84, Escalation Rate % 9.6%, Legal Action Rate % 14.0%, Avg. Days Past Due 226 and Outstanding Balance ₹59.86M. Assigned and Recovered Amount by Risk Band pairs the two bars for Moderate, High, Low and Severe; Assigned Amount by DPD Band exposes the 180+ concentration; Recovered Amount by Recovery Stage ranks Closed, Promise to Pay, Settlement, Negotiation, Initial Contact and Legal Review; and the Risk Band Scorecard matrix puts cases, assigned value, recovered value and recovery rate in one table.
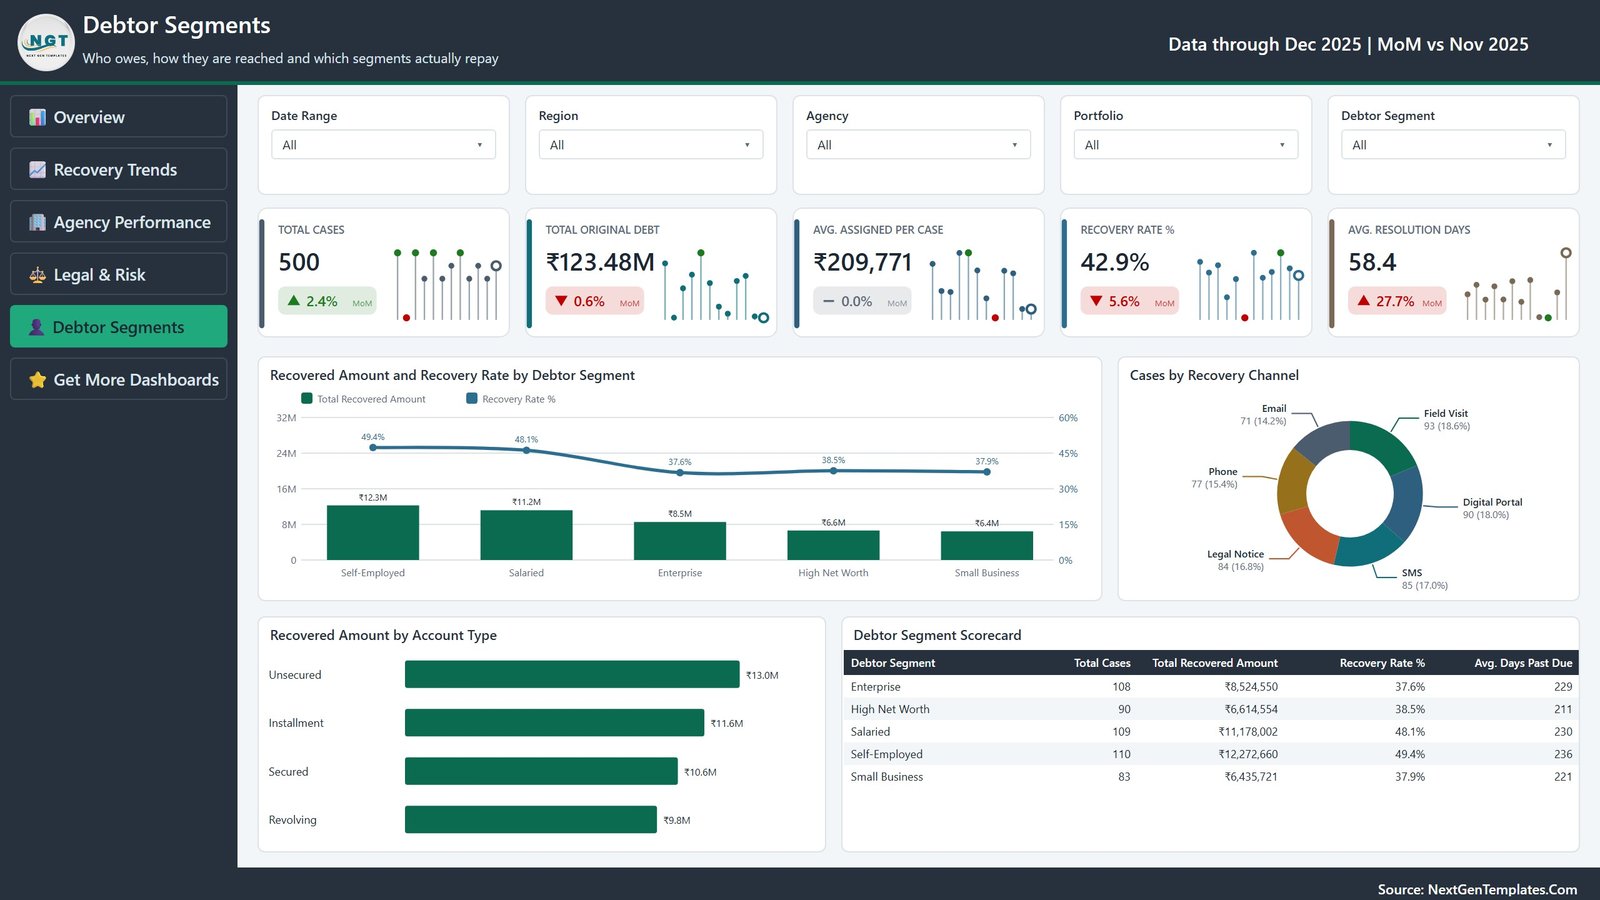
Page 5 — Debtor Segments. Who owes, how they are reached and which segments actually repay. Cards: Total Cases 500, Total Original Debt ₹123.48M, Avg. Assigned per Case ₹209,771, Recovery Rate % 42.9% and Avg. Resolution Days 58.4. Recovered Amount and Recovery Rate by Debtor Segment shows Self-Employed and Salaried repaying at 49.4% and 48.1% while Enterprise sits at 37.6%; Cases by Recovery Channel splits Field Visit, Digital Portal, SMS, Legal Notice, Phone and Email; Recovered Amount by Account Type ranks Unsecured, Installment, Secured and Revolving; and the Debtor Segment Scorecard adds average days past due per segment. Credit Recovery Agencies Dashboard in Power BI
The sixth navigation item, Get More Dashboards, is a linked page back to the wider NextGenTemplates library. The download is a single zip containing the .pbix, the Data.xlsx source workbook and a Power BI Dashboard user manual PDF. Credit Recovery Agencies Dashboard in Power BI
Credit Recovery Agencies Dashboard in Power BI vs. Excel vs. Paid Collections SaaS — Where This Fits
| This Power BI Dashboard | Excel Dashboard | Paid Collections SaaS (e.g. TrueAccord, Katabat) | |
|---|---|---|---|
| Cost | $17.99 one time | $17.99 one time | $300–$1,500 per month, often per seat |
| Platform | Power BI Desktop (free) + optional Power BI Service | Excel 2016+, Microsoft 365, Excel for Mac | Vendor cloud only |
| Setup time | 10–20 minutes to repoint the data source | 10 minutes to paste and refresh | 4–12 weeks implementation |
| Real-time team collaboration | Yes, when published to a Power BI workspace | Via OneDrive / SharePoint co-authoring | Yes, built in |
| Mobile access | Power BI mobile app | Excel mobile, limited interactivity | Native apps |
| Customisable fields | Full — edit the model, measures and visuals | Full — edit sheets and pivots | Limited to vendor configuration |
| Share with link | Yes, via Power BI Service | File share only | Yes |
| Year-1 cost at 5 users | $17.99 (add $14/user/month only if you publish to Pro) | $17.99 | $18,000–$90,000 |
| DPD and risk-band ageing | Built in — four bands, four DPD buckets | Built in | Usually yes |
| Agent-level league table | 12 agents ranked out of the box | Yes | Yes, with dialler integration |
| Dialler / payment gateway integration | No | No | Yes |
Read the plain-English version of this comparison in the Credit Recovery Agencies Dashboard in Power BI walkthrough on our blog.
Who This Template Is For — and Who It’s Not For
It is for collections managers who place accounts with two or more external agencies and need one view of who is performing; in-house recovery teams reporting agent productivity to a credit committee; ARC and NBFC analysts who already export a case-level extract and want it visualised; and Power BI consultants who need a credible collections model to adapt for a client rather than start from an empty canvas. Credit Recovery Agencies Dashboard in Power BI
It is not for anyone wanting an operational case-management system — there is no dialler, no payment link, no letter generator and no debtor contact log you can write back to. It is not a compliance archive: nothing here evidences FDCPA, RBI or Ofcom call conduct. And it is not a good fit if your case extract has fewer than the core fields listed below, because several measures will return blank. This is a reporting layer that sits on top of your collections system, not a replacement for it.
How to Use the Credit Recovery Agencies Dashboard in Power BI
- Install Power BI Desktop if you do not already have it — it is free from Microsoft and runs on Windows.
- Unzip the download and open
Credit Recovery Agencies Dashboard in Power BI.pbix. Read the included user manual PDF first if this is your first NGT Power BI file. - Open
Data.xlsxand look at theDatasheet. It has 22 columns: Case ID, Activity Date, Agency, Region, Portfolio, Recovery Channel, Account Type, Debtor Segment, Agent, Original Debt, Assigned Amount, Recovered Amount, Fees Charged, Days Past Due, Contact Attempts, Promise Amount, Resolution Days, Recovery Stage, Status, Risk Band, Legal Action and DPD Band. - Replace the 500 sample rows with your own extract, keeping the column headers exactly as they are. Any number of rows works.
- Point the model at your file — in Power BI, Transform data → Data source settings → Change Source, then Close & Apply. Every card, chart and scorecard repopulates.
- Change the currency if you do not report in rupees: select each measure in the Data pane and set its format string to your currency. The sample ships formatted in ₹.
- Filter and read. Start on Overview with all slicers on All, then narrow by Agency to see which firm is dragging the blended recovery rate down, and by Risk Band on page 4 to see whether that gap is genuine underperformance or just a worse book.
Real-World Use Cases
Priya, collections manager at a mid-size NBFC. She places files with six agencies and is asked every quarter which contracts to renew. On Agency Performance she plots recovered value against recovery rate: Summit Receivables Group recovers the most in absolute terms, but the bubble chart shows Apex Recovery Partners sitting at the bottom on both axes. She takes that one screen to the vendor review instead of a 40-tab workbook.
Daniel, head of credit risk at a consumer lender. His board wants to know why recovery rate fell 5.6% month on month. Legal & Risk shows him the answer in two visuals: the 180+ DPD bucket now holds 67.7% of assigned value, and Severe-band cases recover at 39.2% against 48.5% for Low. The mix shifted; the agencies did not get worse.
Meera, a freelance Power BI consultant. A debt purchaser briefs her on a collections report with a two-week deadline. She opens this file, swaps the source, renames Portfolio to Tranche, and delivers a working model on day three — then spends the rest of the fortnight on the client’s actual reconciliation problem.
Frequently Asked Questions
Do I need a paid Power BI licence to use this?
No. Power BI Desktop is free and opens, edits and refreshes the file completely. A Power BI Pro licence is only needed if you want to publish the report to a workspace and share it with colleagues through the Power BI Service.
Does it work on a Mac?
Power BI Desktop is Windows-only, so you would need Windows, a virtual machine or a cloud desktop. If you work on a Mac, the Credit Recovery Agencies Dashboard in Excel is the same subject built for Excel, which runs natively on macOS.
Can I change the currency from rupees?
Yes. The sample data is formatted in ₹ because it was generated from an Indian recovery book. Select any measure in the Data pane, open the Measure tools ribbon and change the format string to $, £, € or anything else. No formulas change.
How many rows can I load?
The sample has 500 cases, but the model is a straightforward import table — Power BI Desktop handles millions of rows. Practically, a case-level extract of a few hundred thousand rows refreshes in seconds on a normal laptop.
What if my extract does not have all 22 columns?
Add the missing columns as empty ones so the model loads, then delete or hide the visuals that depend on them. The core columns you genuinely cannot do without are Activity Date, Agency, Assigned Amount, Recovered Amount, Days Past Due and Status — those drive most of the KPI cards.
Is this the same as the KPI dashboard version?
No. Credit Recovery Agencies KPI Dashboard in Excel is a month-picker scorecard with traffic lights and target-versus-actual variance. This one is an analytical dashboard: five pages of slicer-driven charts over a case-level book. Many teams keep both — the scorecard for the monthly pack, this for the drill-down.
Can I resell or reuse it in client work?
You may use and adapt it for your own organisation or for client deliverables. You may not resell or redistribute the template itself as a template.
About the Author
Built by PK – Microsoft Certified Professional with 15+ years of Excel, Google Sheets, and Power BI experience. Founder of NextGenTemplates, reaching 300K+ subscribers across YouTube channels. Every template is hand-built and tested before release.
Explore Related Templates
- Credit Recovery Agencies Dashboard in Excel — the same five-topic analysis built as an Excel pivot dashboard.
- Credit Recovery Agencies KPI Dashboard in Excel — the month-picker scorecard companion.
- Loan Recovery Services KPI Dashboard in Excel — recovery KPIs for an in-house loan book.
- Loan Portfolio KPI Dashboard in Power BI — the origination side of the same story.
- Debt Payoff Calculator Template in Excel — for modelling a single settlement plan.
- Browse every Power BI Dashboard template or the wider Power BI category.
Download the Credit Recovery Agencies Dashboard in Power BI today for $17.99 instead of $29.99, open it in the free Power BI Desktop, point it at your own case extract and take a real answer to your next agency review. One-time payment, instant download, lifetime access, user manual included.
Last updated: 27 August 2026.

































Reviews
There are no reviews yet.