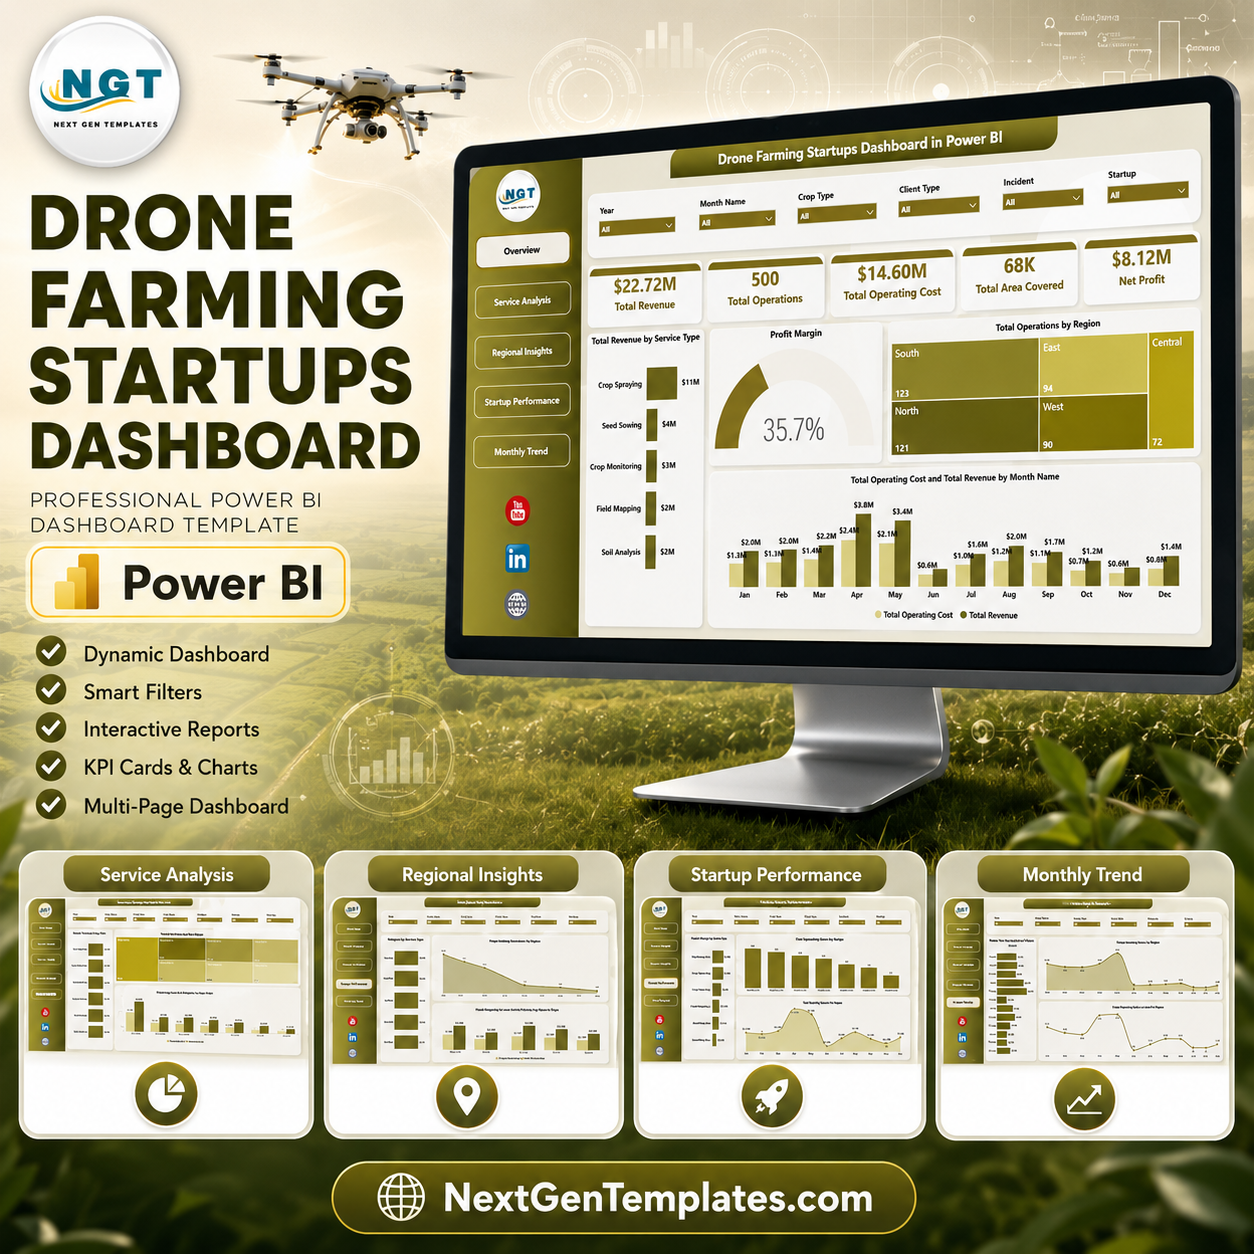
Drone Farming Startups Dashboard in Power BI gives agritech founders, farm-service operators, and analysts a ready PBIX dashboard for reviewing revenue, operations, operating cost, area covered, and net profit across drone farming services. Many drone service teams track 100+ field jobs across regions, months, startups, and service categories, but still need a clear reporting layer for investors, operations reviews, and customer delivery analysis. This template includes 5 Power BI report pages, interactive slicers, KPI cards, and focused charts. Instant download. One-time payment. Editable Power BI file. No monthly analytics subscription.
Drone Farming Startups Dashboard in Power BI
Key Features of Drone Farming Startups Dashboard in Power BI
- 5 Power BI pages covering Overview, Service Analysis, Regional Insights, Startup Performance, and Monthly Trend.
- Executive KPI cards for Total Revenue, Total Operations, Total Operating Cost, Total Area Covered, and Net Profit.
- Service profitability analysis for revenue, operating cost, operations, and profit margin by service type.
- Regional insights to compare profit margin, satisfaction, revenue, and operating cost by region.
- Startup benchmarking for net profit, completed operations, and month-level profit movement.
- Monthly trend tracking for area covered, total operations, and completed operations over time.
- Interactive slicers for quickly filtering the dashboard by available business fields.
- Editable PBIX file for Power BI Desktop customization, publishing, and data-source replacement.
What’s Inside the Drone Farming Startups Dashboard in Power BI
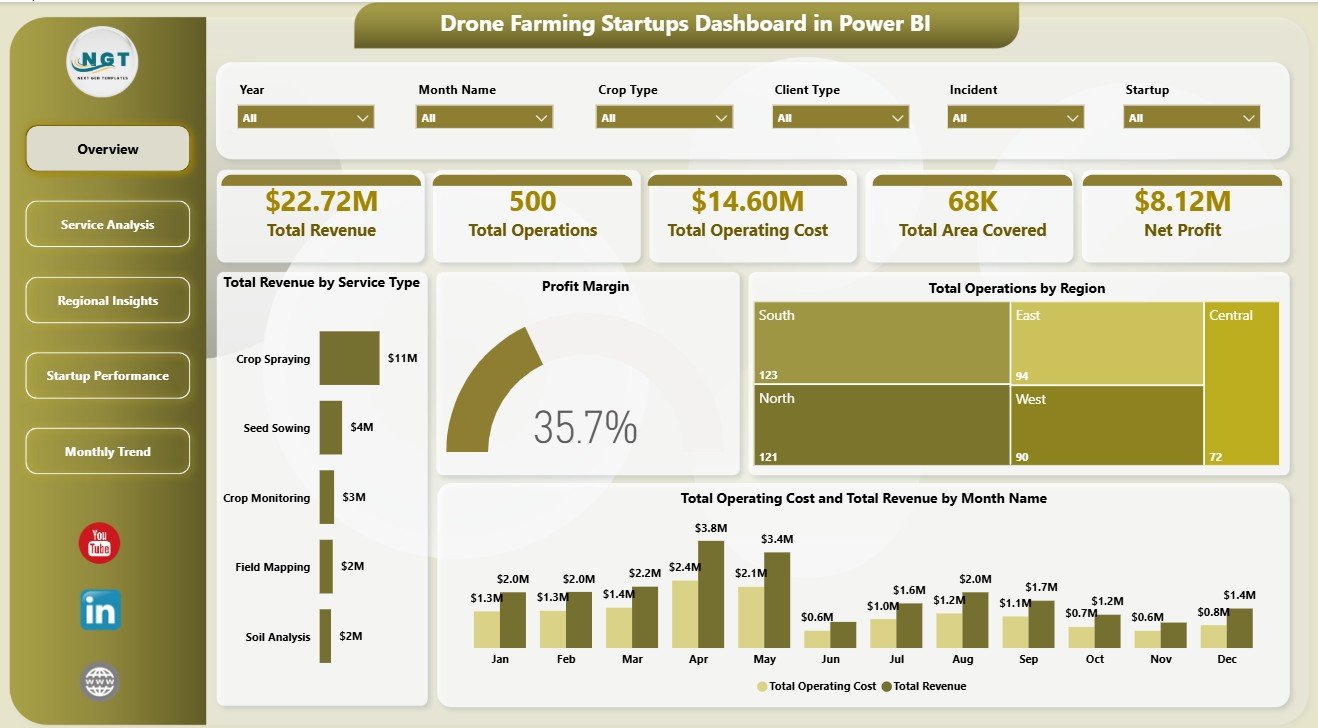
1. Overview Page
The Overview page gives a high-level view of the drone farming startup operation. KPI cards show Total Revenue, Total Operations, Total Operating Cost, Total Area Covered, and Net Profit so leaders can quickly understand financial scale, workload, field coverage, and profitability.
Total Revenue by Service Type: This chart compares how each drone farming service contributes to revenue. It helps teams identify whether spraying, crop monitoring, mapping, seeding, or scouting services are driving the strongest commercial results.
Profit Margin: This visual summarizes profitability after operating cost. It helps founders see whether service growth is producing enough margin to support equipment, pilots, travel, and maintenance.
Total Operations by Region: This chart shows where the highest number of drone farming jobs are being delivered. It supports region-level planning for crews, sales coverage, and drone fleet allocation.
Total Operating Cost and Total Revenue by Month Name: This chart compares monthly revenue against delivery cost. It helps users spot months where activity rises but margin pressure also increases.
2. Service Analysis
The Service Analysis page focuses on service categories. Profit Margin by Service Type shows which offerings protect margin, Total Operations by Service Type shows delivery volume, and Total Operating Cost and Total Revenue by Service Type compares cost-to-revenue performance for each service.
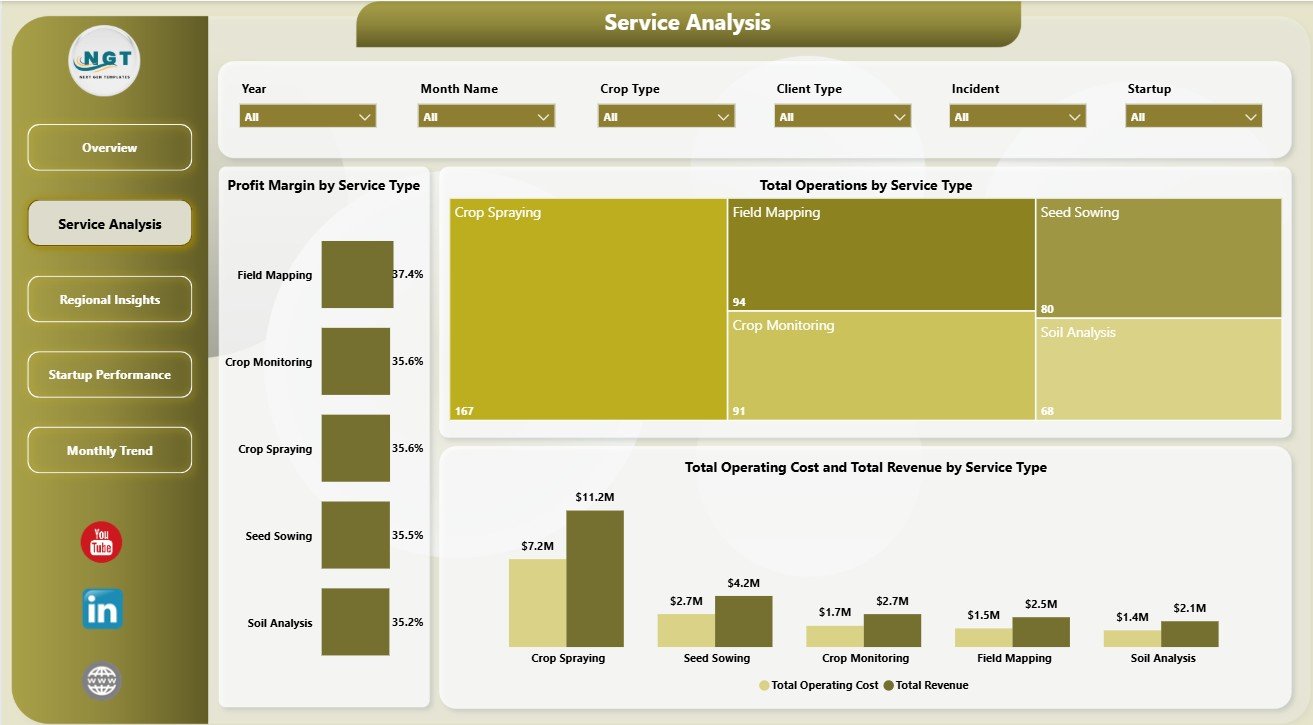
Service Analysis
3. Regional Insights
The Regional Insights page compares performance across territories. Profit Margin by Region shows where operations are most profitable, Avg Satisfaction Score by Region tracks customer experience, and Total Operating Cost and Total Revenue by Region explains regional cost pressure.
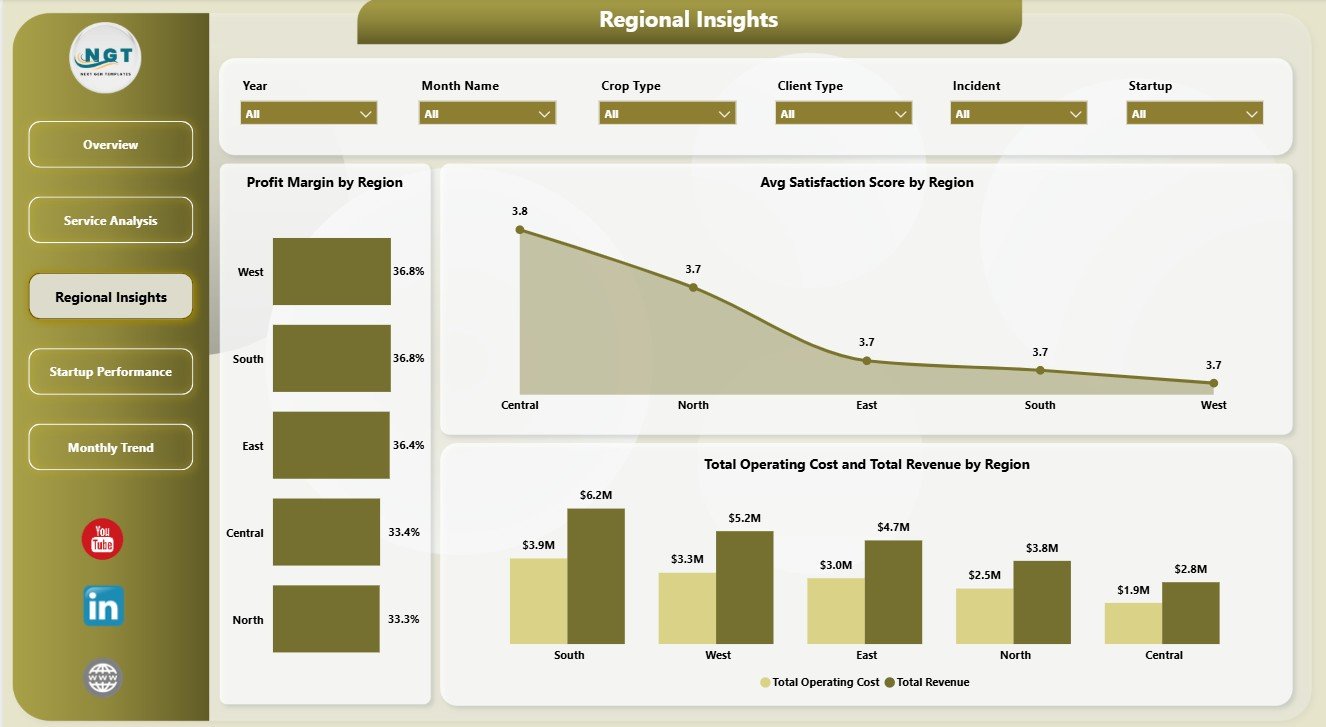
Regional Insights
4. Startup Performance
The Startup Performance page helps compare drone farming startups or internal business units. Net Profit by Startup shows financial contribution, Completed Operations by Startup tracks execution, and Net Profit by Month Name shows whether profitability is improving over time.
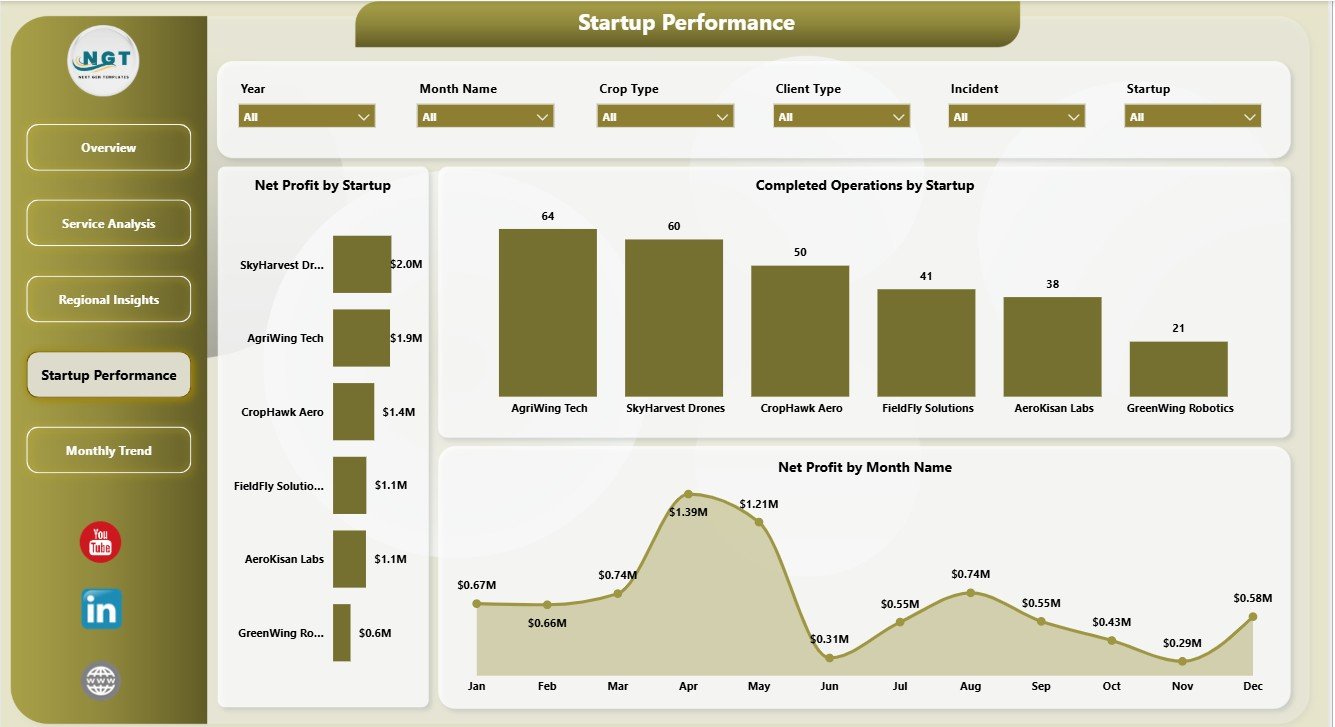
Startup Performance
5. Monthly Trend
The Monthly Trend page helps users read operational seasonality. Total Area Covered by Month Name shows field scale, Total Operations by Month Name shows workload volume, and Completed Operations by Month Name shows delivery throughput.
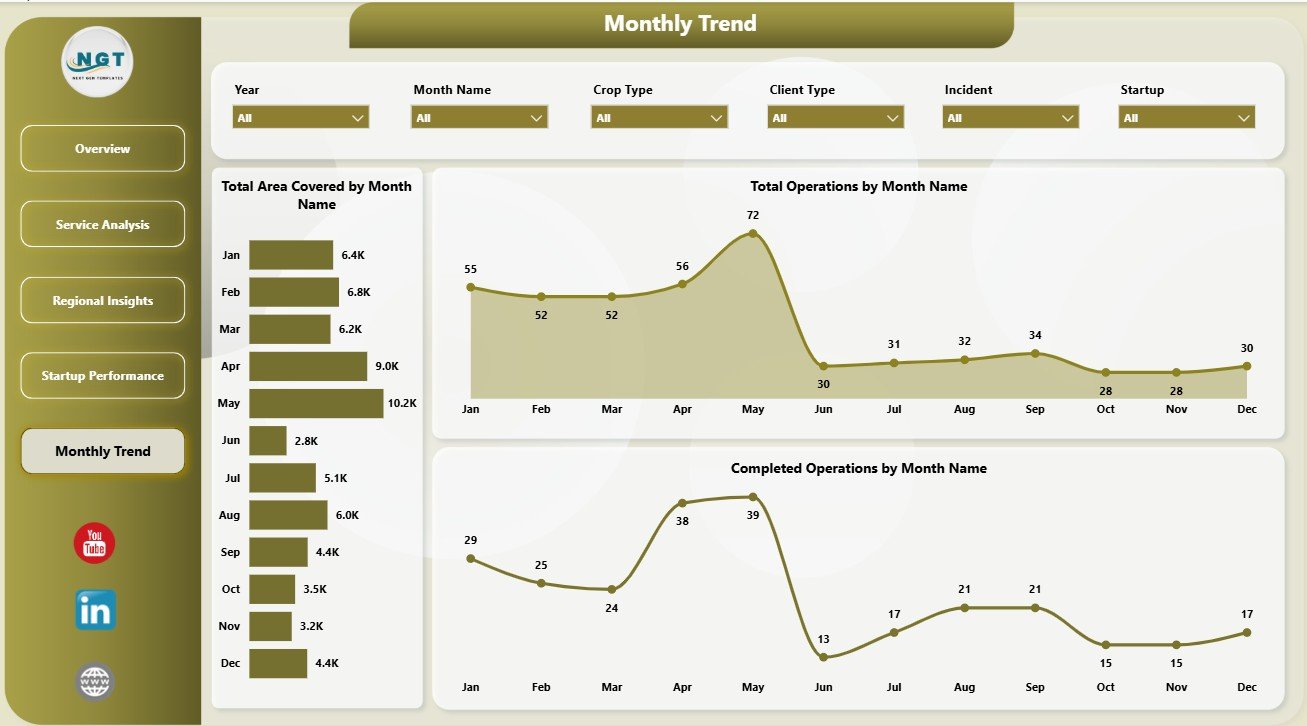
Monthly Trend
Drone Farming Startups Dashboard in Power BI vs. Tableau vs. Paid Farm SaaS – Where This Fits
| Feature | This Power BI Dashboard | Tableau Alternative | Paid Farm SaaS |
|---|---|---|---|
| Cost | $17.99 one-time | Requires Tableau licensing | Monthly or annual subscription |
| Platform | Power BI Desktop and Power BI Service | Tableau Desktop or Cloud | Vendor cloud platform |
| Setup time | Open PBIX, connect data, refresh | Dashboard must be rebuilt | Requires onboarding and configuration |
| Real-time team collaboration | Available through Power BI Service | Available through Tableau Cloud | Usually included |
| Mobile access | Available through Power BI apps after publishing | Available through Tableau mobile | Usually included |
| Customizable fields | Editable model, measures, and visuals | Editable if rebuilt or licensed | Limited by vendor settings |
| Share with link | Possible through Power BI Service | Possible through Tableau Cloud | Usually included |
| Year-1 cost at 5 users | $17.99 plus Microsoft licensing you use | Often much higher licensing cost | Often hundreds or thousands |
| Drone farming analytics | Pre-built across 5 report pages | Manual build required | Depends on vendor plan |
Who This Template Is For – and Who It’s Not For
Best for: drone farming startups, agri-tech founders, farm-service operators, agriculture consultants, rural operations managers, and Power BI users who need a ready reporting layer for structured service data.
Not for: teams that need live drone flight control, GIS mapping, compliance automation, maintenance ticketing, telemetry streaming, or a fully custom operational database.
How to Use the Drone Farming Startups Dashboard in Power BI
- Download and unzip the file.
- Open the PBIX file in Power BI Desktop.
- Review the sample data structure and dashboard pages.
- Replace or connect your own drone farming service data.
- Refresh the report and use slicers to filter by service, region, startup, and month.
- Customize visuals, measures, fields, and theme settings if required.
- Publish to Power BI Service if your team needs browser or mobile access.
Real-World Use Cases
Aarav, agritech founder: Aarav reviews Total Revenue, Total Operating Cost, and Net Profit before investor updates, then filters the dashboard by service type to explain which drone services are scaling fastest.
Meera, operations manager: Meera compares completed operations by startup and total operations by region to plan crews, equipment availability, and delivery capacity for the next month.
Daniel, agriculture consultant: Daniel uses regional profit margin and satisfaction views to recommend which territories should receive more sales attention and field support.
Frequently Asked Questions
What does this Power BI dashboard track?
It tracks revenue, operations, operating cost, area covered, net profit, profit margin, service type, region, satisfaction score, startup performance, completed operations, and monthly trends.
Do I need Power BI Desktop?
Yes. Open and edit the PBIX file in Power BI Desktop, which is available from Microsoft.
Can I use my own drone farming data?
Yes. Replace or connect the sample data with your own structured drone farming service records, then refresh the report.
Can I customize the report?
Yes. You can edit visuals, measures, slicers, colors, fields, and page layouts inside Power BI Desktop.
Is this a drone flight management system?
No. This is an analytics dashboard for operational and financial reporting. It does not control drones, manage live flights, or replace GIS and compliance systems.
Is this a subscription?
No. It is a one-time downloadable Power BI template purchase.
About the Author
Built by PK – Microsoft Certified Professional with 15+ years of Excel, Google Sheets, and Power BI experience. Founder of NextGenTemplates, reaching 300K+ subscribers across YouTube channels. Every template is hand-built and tested before release.
Explore Related Templates
Pair this template with Drone Farming Startups Dashboard in Excel, Vertical Farming Dashboard in Power BI, and Garden Center Dashboard in Excel. Browse more Power BI Dashboard templates and Power BI templates.
Download the Drone Farming Startups Dashboard in Power BI today and start reviewing drone farming revenue, operations, cost, area coverage, profitability, service performance, regional performance, startup execution, and monthly trends from one editable PBIX file.
Last updated: June 6, 2026
Watch the step-by-step video tutorial:


Reviews
There are no reviews yet.