

Port procurement operations involve high-value purchasing, multiple vendors, strict delivery timelines, and continuous cost pressure. Ports must procure equipment, spare parts, fuel, infrastructure materials, and services while ensuring operational continuity and financial discipline. However, when procurement data is scattered across spreadsheets and manual reports, visibility drops, delays increase, and cost overruns go unnoticed.
That is exactly where the Port Procurement Dashboard in Power BI becomes a game-changing solution.
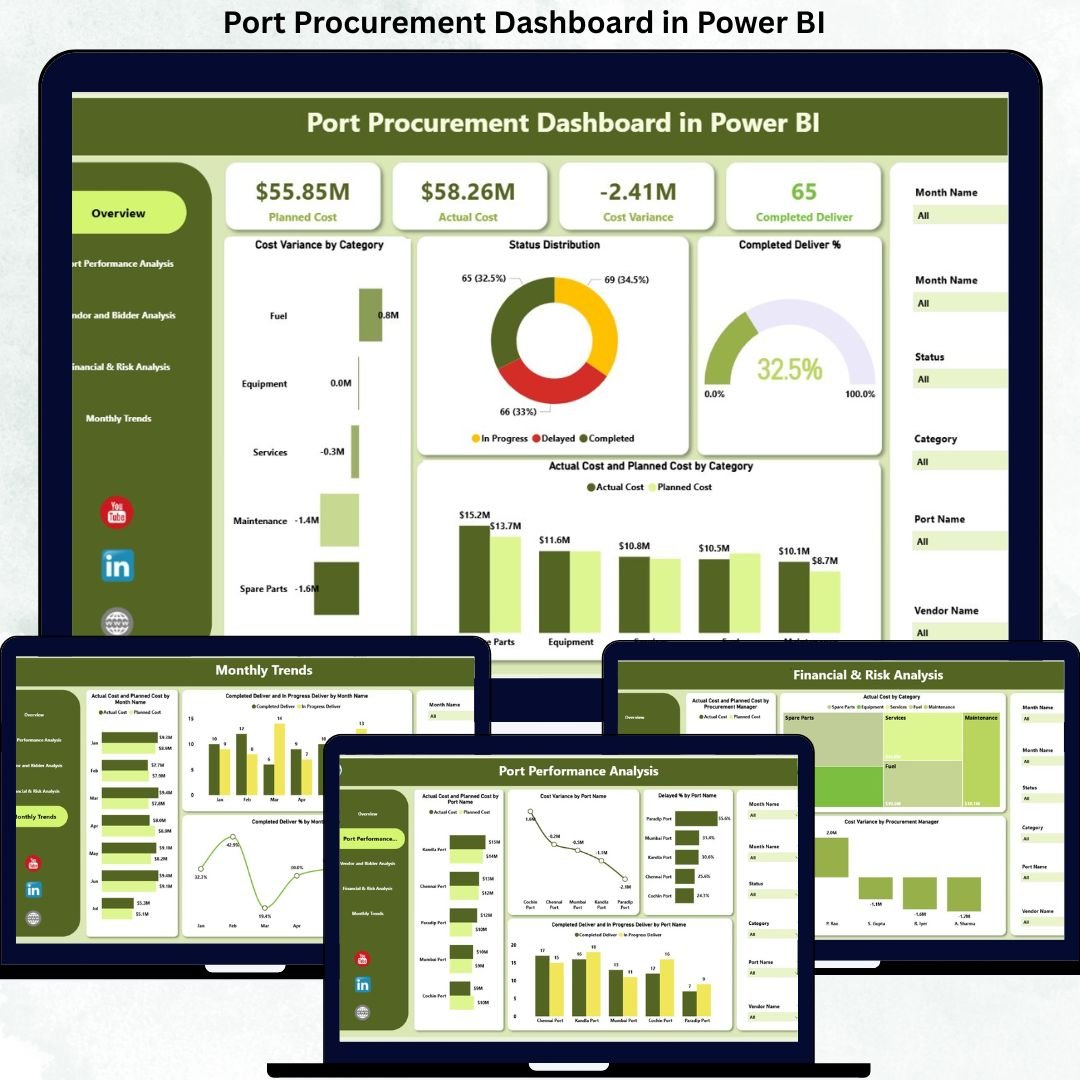
This professionally designed Power BI dashboard converts raw procurement data into clear, interactive, and decision-ready insights. Instead of spending hours consolidating purchase orders and delivery reports, procurement teams gain instant visibility into planned cost, actual cost, cost variance, delivery performance, vendor efficiency, and monthly trends—all in one centralized dashboard.
Built on Power BI, this dashboard offers enterprise-grade analytics without complexity. It empowers port authorities, procurement managers, and finance teams to control procurement risks, improve delivery reliability, and make confident, data-driven decisions.
⚙️ Key Features of the Port Procurement Dashboard in Power BI
📊 Centralized Procurement Monitoring
Track all procurement KPIs from a single interactive dashboard instead of managing multiple files.
💰 Planned vs Actual Cost Control
Identify overspending, savings, and cost leakage early through clear variance analysis.
🚚 Delivery Status & Completion Tracking
Monitor completed, in-progress, and delayed deliveries in real time.
🧑🤝🧑 Vendor Performance Evaluation
Analyze supplier efficiency, delivery reliability, and cost discipline.
📈 Monthly Trend Analysis
Understand seasonal patterns and recurring procurement issues.
📦 What’s Inside the Port Procurement Dashboard in Power BI
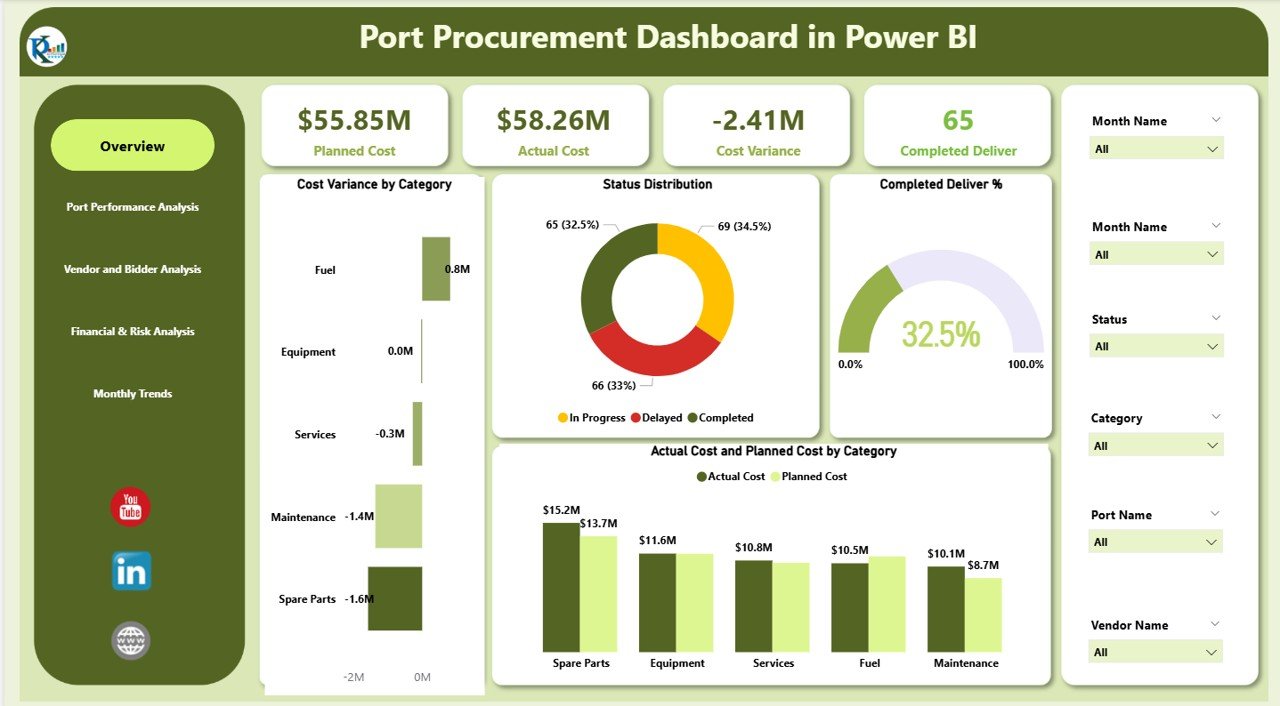
🖥️ Overview Section – Executive Procurement Snapshot
The Overview section gives leadership an instant summary of procurement health.
KPI Cards Included
Planned Cost – Total planned procurement budget
Actual Cost – Total actual procurement spend
Cost Variance – Difference between planned and actual cost
Completed Deliver – Total completed deliveries
Overview Charts
Cost Variance by Category – Highlights overruns and savings
Status Distribution – Completed, In Progress, and Delayed orders
Completed Deliver % – Delivery efficiency indicator
Planned vs Actual Cost by Category – Budget discipline at a glance
These visuals help decision-makers assess procurement efficiency within seconds.
⚓ Port Performance Analysis – Location-Wise Insights
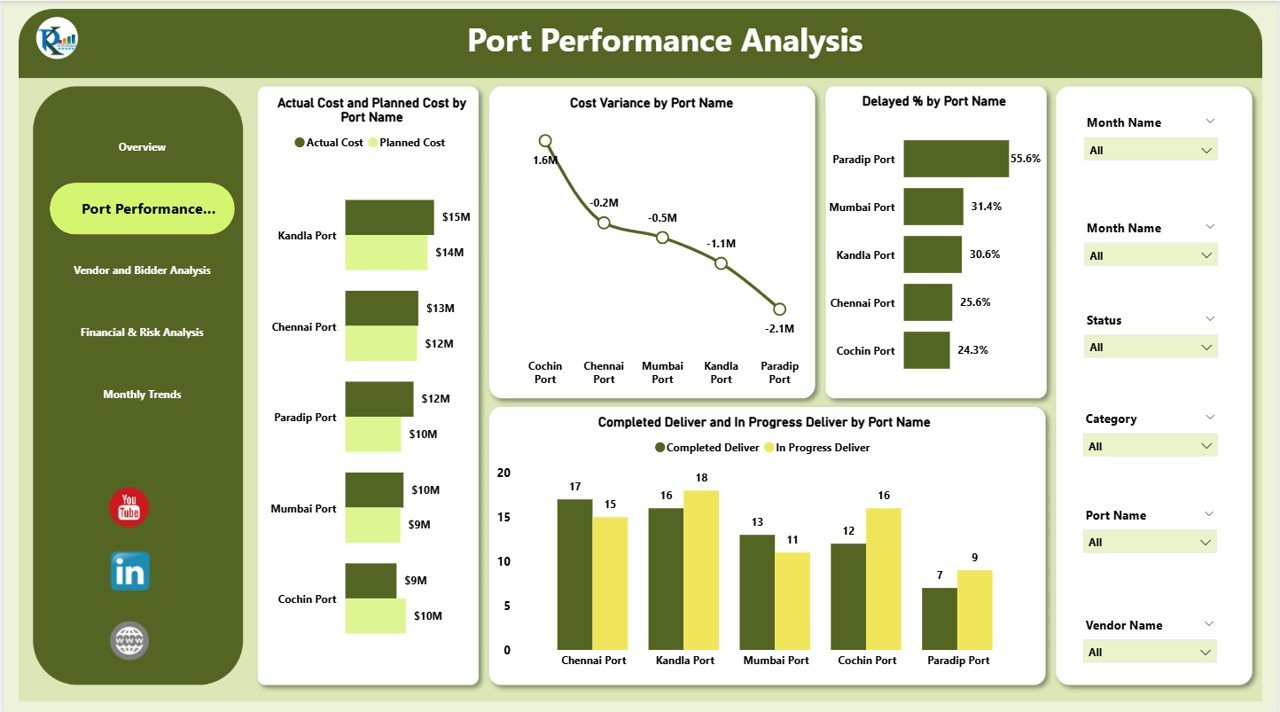
This section evaluates procurement performance across different port locations.
Charts Included
Planned vs Actual Cost by Port Name
Cost Variance by Port Name
Delayed % by Port Name
Completed vs In-Progress Deliveries by Port
This analysis helps identify high-performing ports, delay-prone locations, and cost inefficiencies—allowing targeted corrective actions.
🧑🤝🧑 Vendor & Bidder Analysis – Supplier Reliability
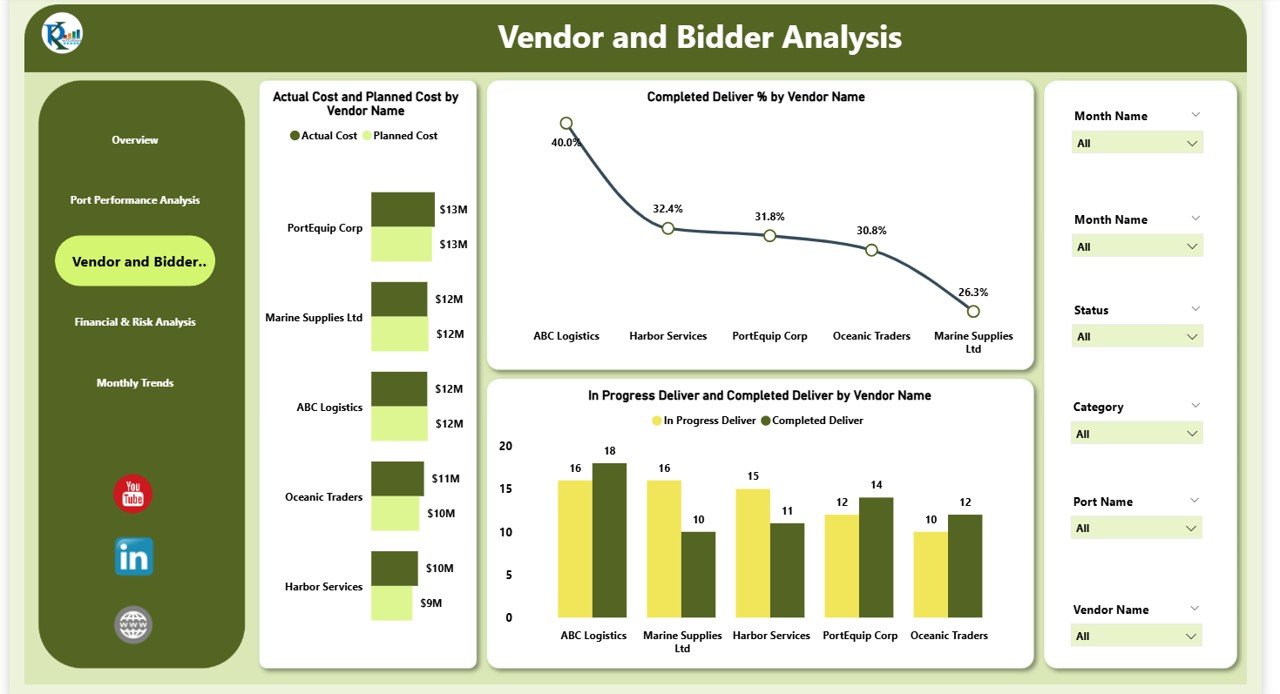
Vendor performance directly impacts port operations. This section focuses on supplier accountability.
Charts Included
Planned vs Actual Cost by Vendor Name
Completed Deliver % by Vendor Name
Completed vs In-Progress Deliveries by Vendor
These insights help procurement teams detect unreliable suppliers, improve negotiations, and strengthen vendor selection strategies.
💰 Financial & Risk Analysis – Governance & Control
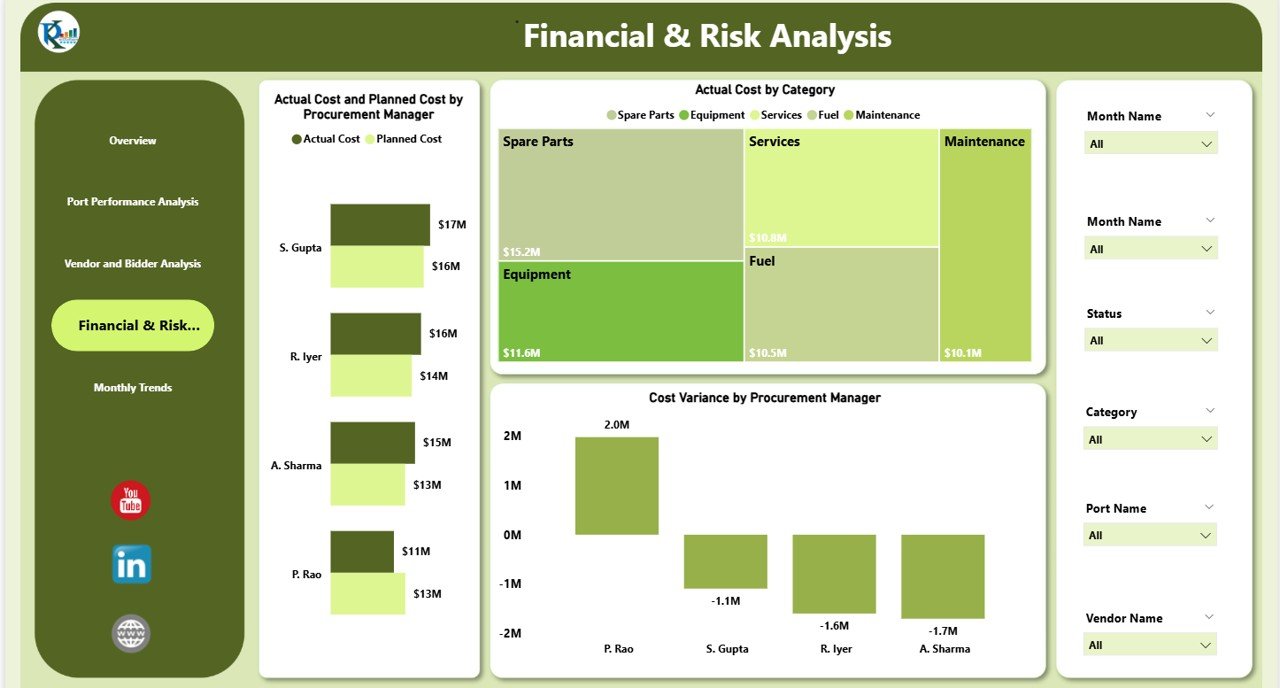
This section supports financial discipline and risk management.
Charts Included
Planned vs Actual Cost by Procurement Manager
Actual Cost by Category
Cost Variance by Procurement Manager
Leadership gains clear visibility into manager-level accountability, budget governance, and procurement risk exposure.
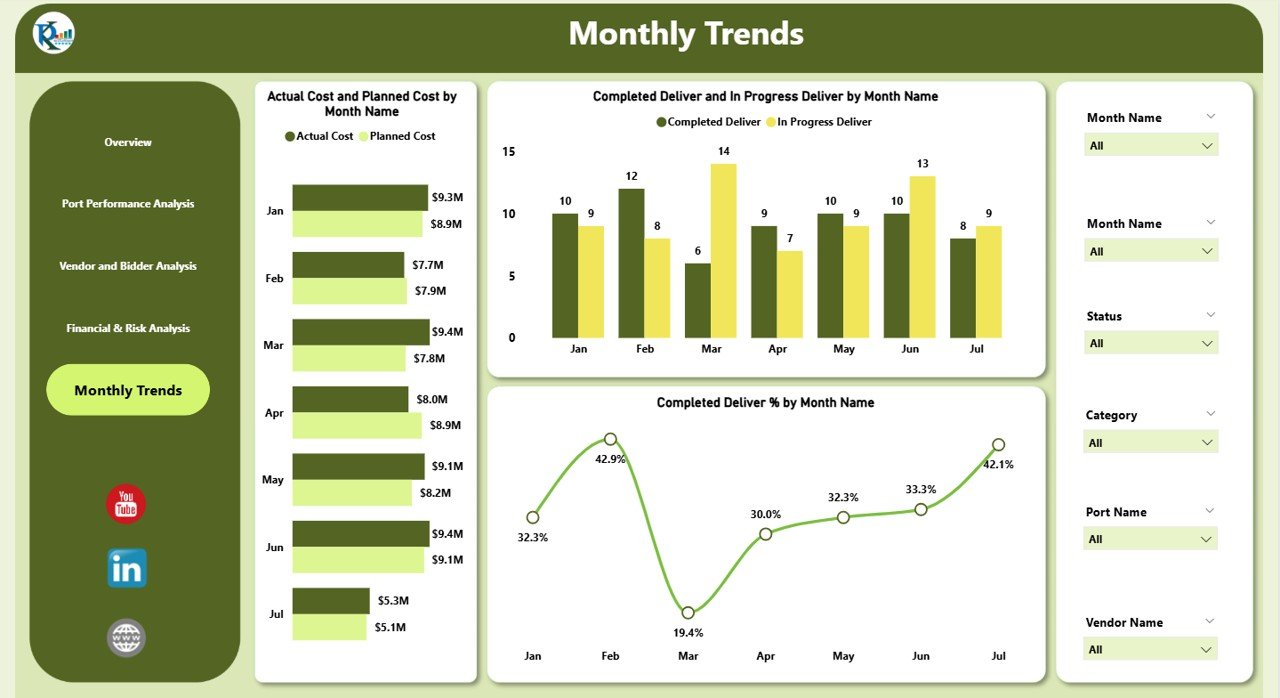
📅 Monthly Trends Analysis – Long-Term Improvement
Procurement performance evolves over time. This section reveals trends and patterns.
Charts Included
Planned vs Actual Cost by Month
Completed vs In-Progress Deliveries by Month
Completed Deliver % by Month
These trends improve forecasting accuracy and future procurement planning.
🎯 Who Can Benefit from This Dashboard
⚓ Port Authorities & Terminal Operators
📦 Procurement & Purchasing Teams
💼 Finance & Cost Control Teams
🚢 Operations & Logistics Managers
🧠 Senior Management & Executives
📘 Click here to read the Detailed blog post
Watch the step-by-step video tutorial:





























Reviews
There are no reviews yet.