

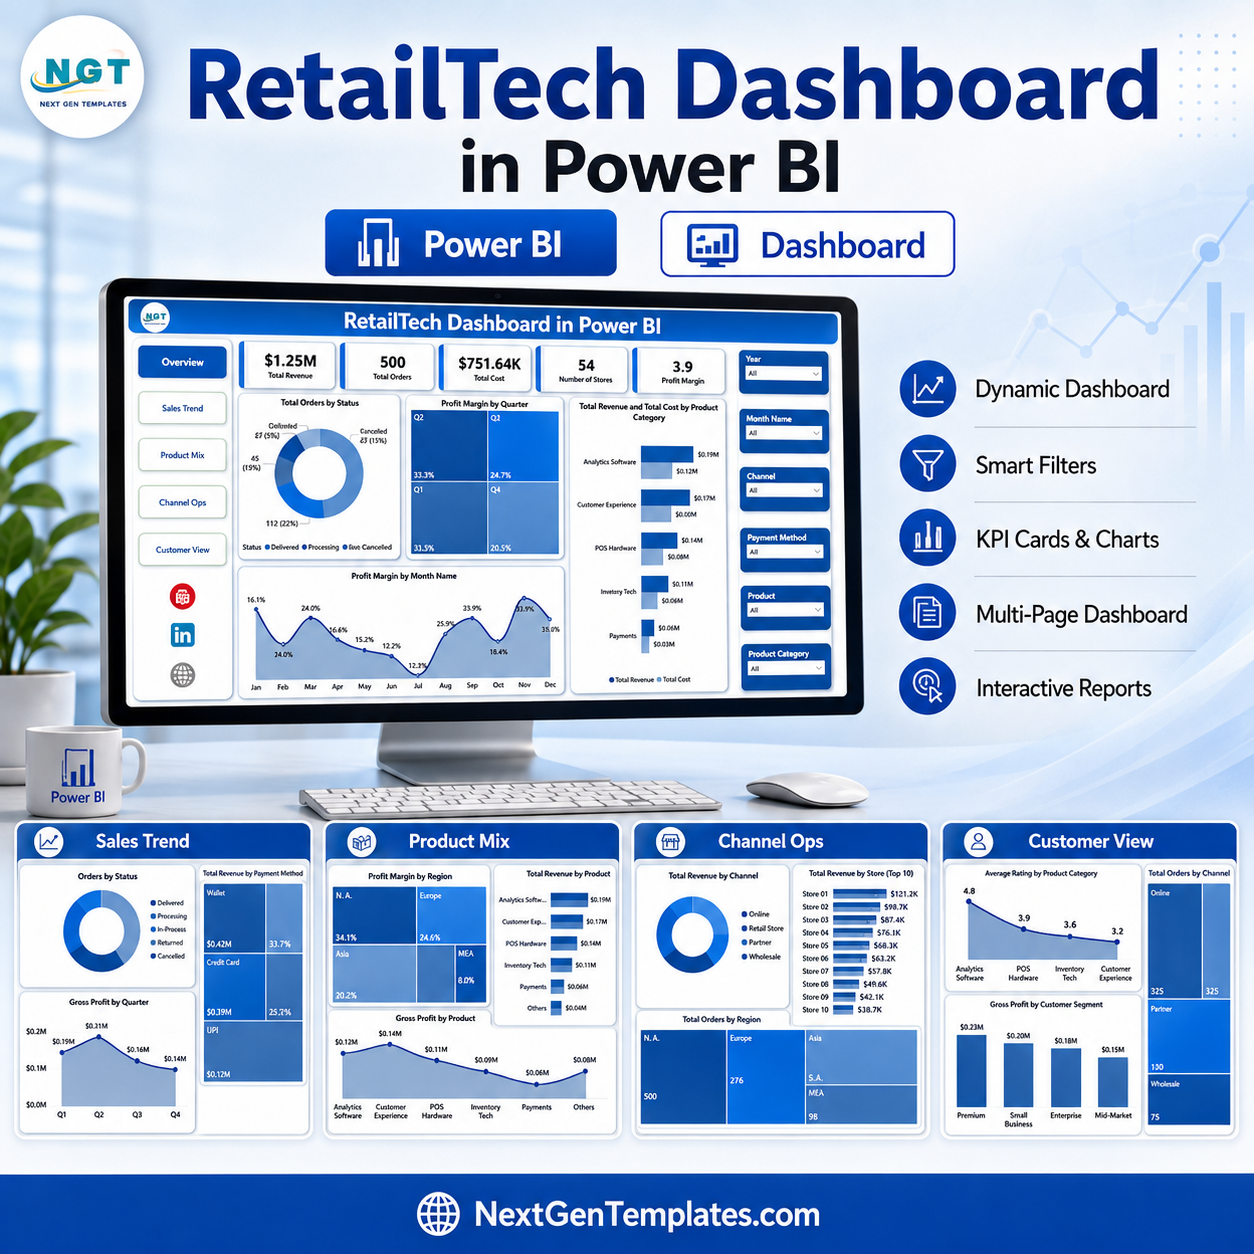
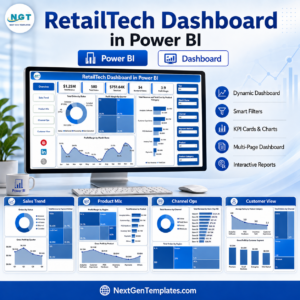
RetailTech Dashboard in Power BI helps retail owners, ecommerce operators, store managers, category leaders, and analysts review revenue, orders, cost, returns, ratings, profit margin, product mix, channel performance, and customer segments in one editable PBIX report. A growing retail team can easily collect thousands of order, category, city, channel, and customer records each month; this dashboard turns those records into a clear 5-page Power BI reporting file for a one-time download. Built by PK with 15+ years of Excel, Google Sheets, and Power BI experience, it gives you a practical starting point with editable visuals, slicers, and page-level analysis. Use it with sample data first, then replace the source with your own retail data and review the report before sharing.
Key Features of RetailTech Dashboard in Power BI
- 5 Power BI pages: Overview, Sales Trend, Product Mix, Channel Ops, and Customer View.
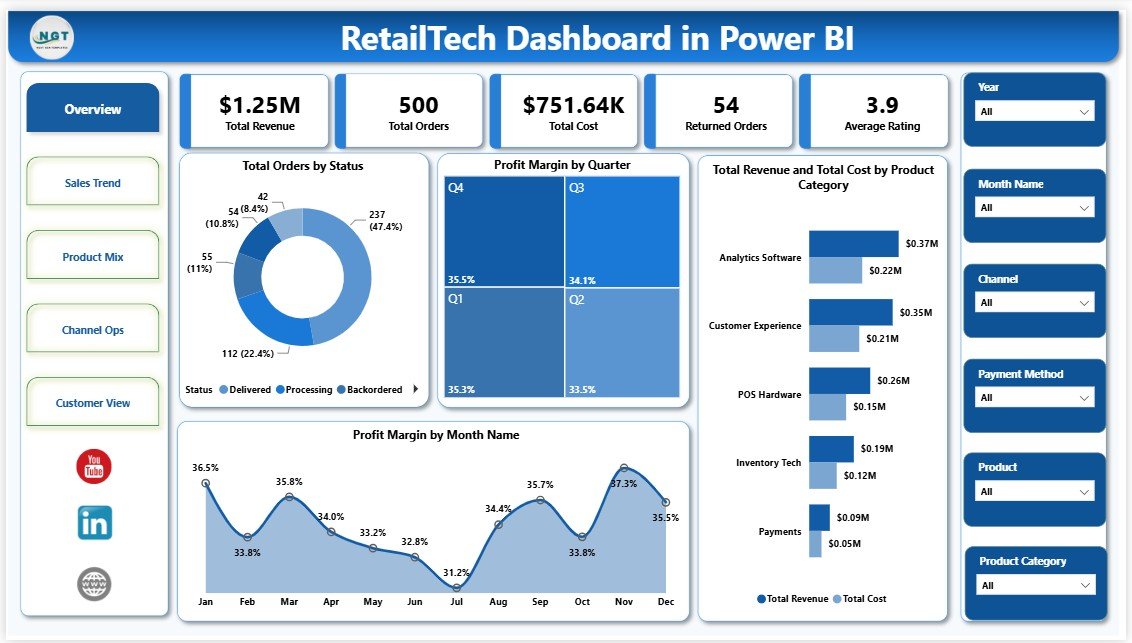
- 5 executive KPI cards: Total Revenue, Total Orders, Total Cost, Returned Orders, and Average Rating.
- Interactive slicers to filter retail data quickly and review focused dashboard views.
- Revenue and cost comparison by product category, store type, city, payment method, and channel.
- Profit margin analysis by quarter, month name, region, and product.
- Order analysis by status, region, and channel.
- Customer experience reporting using average ratings, customer segments, and channel order volume.
What’s Inside the RetailTech Dashboard in Power BI
Overview Page
The Overview page gives a leadership-level summary of retail performance. Cards show Total Revenue, Total Orders, Total Cost, Returned Orders, and Average Rating so users can see business scale, activity, expense, return pressure, and satisfaction together.
Total Orders by Status: Shows completed, pending, returned, cancelled, or delayed order patterns. It helps operations teams find fulfillment and return workflow issues.
Profit Margin by Quarter: Compares profitability across quarters. Use it to spot seasonal trends, cost pressure, promotional effects, and periods where margin needs review.
Total Revenue and Total Cost by Product Category: Compares sales and cost by category. This makes it easier to find high-revenue categories that may still need pricing or cost control work.
Profit Margin by Month Name: Tracks monthly margin movement. It helps identify recurring margin dips and months where product mix or discounting may be affecting profitability.
Sales Trend
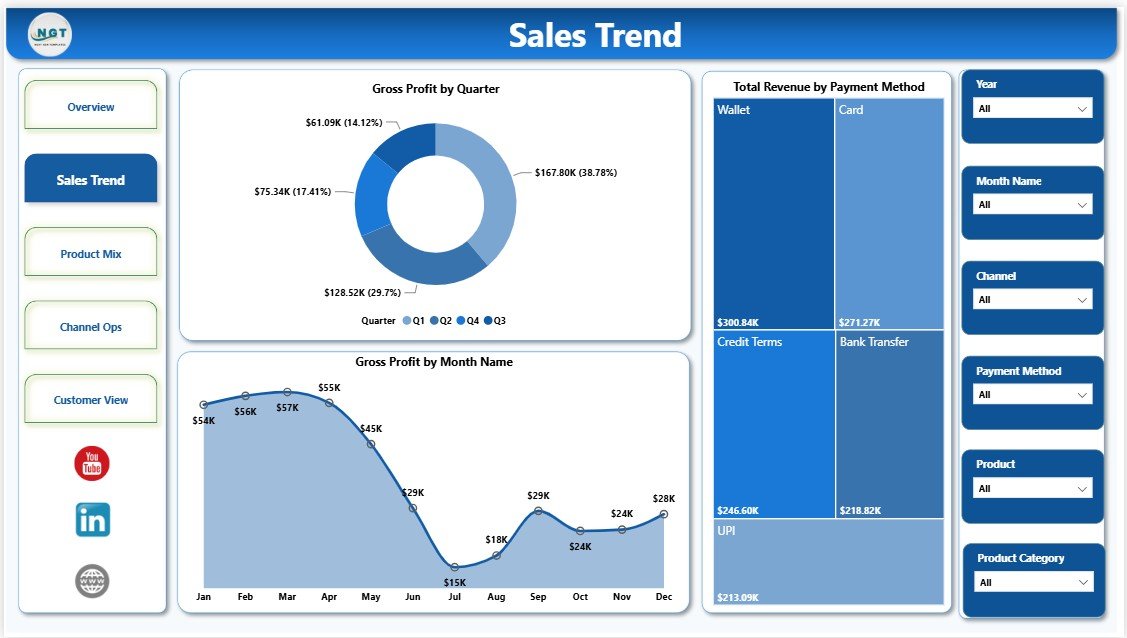
The Sales Trend page focuses on time-based sales and profit review. It includes Gross Profit by Quarter, Total Revenue by Payment Method, and Gross Profit by Month Name.
Gross Profit by Quarter: Shows profit movement by quarter so users can compare seasonal performance. It helps connect sales cycles with margin outcomes.
Total Revenue by Payment Method: Shows which payment methods drive revenue. This is useful for understanding customer payment behavior and payment channel dependency.
Gross Profit by Month Name: Compares gross profit across months. It helps teams understand whether profit is stable or concentrated in specific periods.
Product Mix
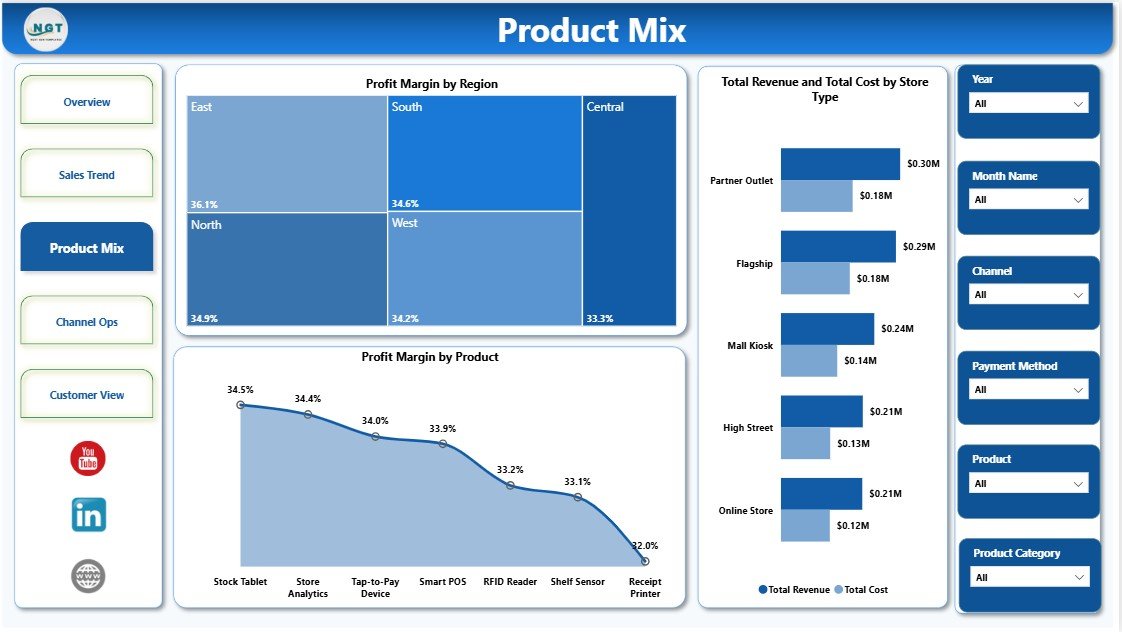
The Product Mix page helps category managers and retail analysts review product-level and region-level performance. It includes Profit Margin by Region, Total Revenue and Total Cost by Store Type, and Profit Margin by Product.
Profit Margin by Region: Compares regional profitability and helps identify areas affected by pricing, shipping, discounting, or product mix.
Total Revenue and Total Cost by Store Type: Compares sales and cost across store formats. It supports decisions about online, physical, franchise, or other retail models.
Profit Margin by Product: Ranks product profitability. It helps users identify products worth promoting, protecting, or reviewing for cost issues.
Channel Ops
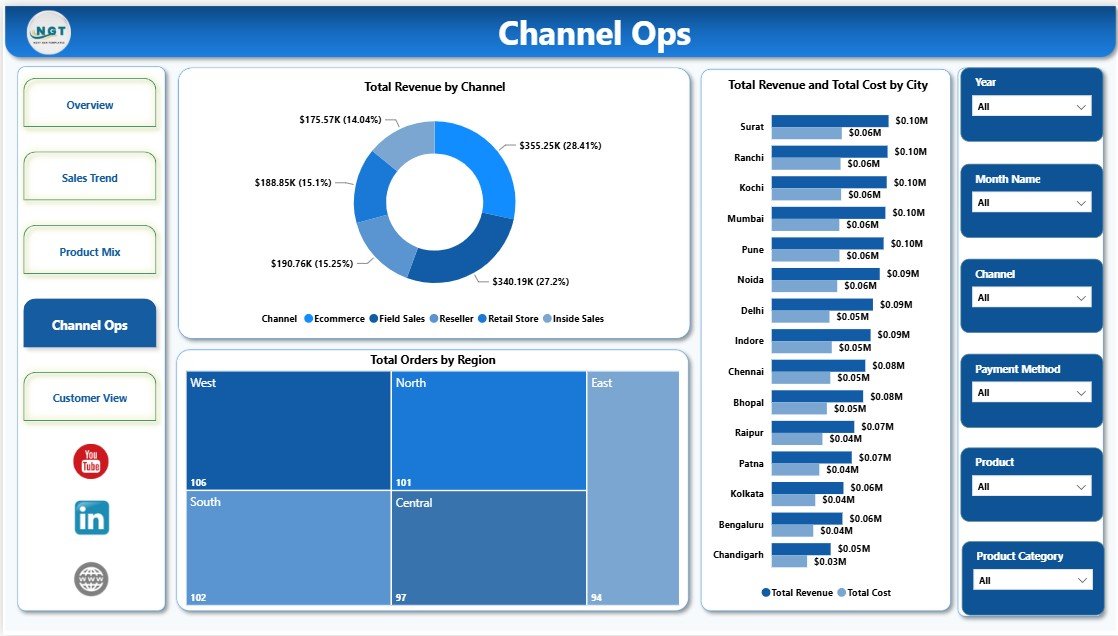
The Channel Ops page connects sales channels with city and regional operations. It includes Total Revenue by Channel, Total Revenue and Total Cost by City, and Total Orders by Region.
Total Revenue by Channel: Shows how sales are distributed across channels. It helps compare ecommerce, store, marketplace, and other channel performance.
Total Revenue and Total Cost by City: Compares city-level sales and cost. It helps identify locations where high revenue may still need cost review.
Total Orders by Region: Shows regional order demand. It supports fulfillment planning, inventory allocation, and regional performance reviews.
Customer View
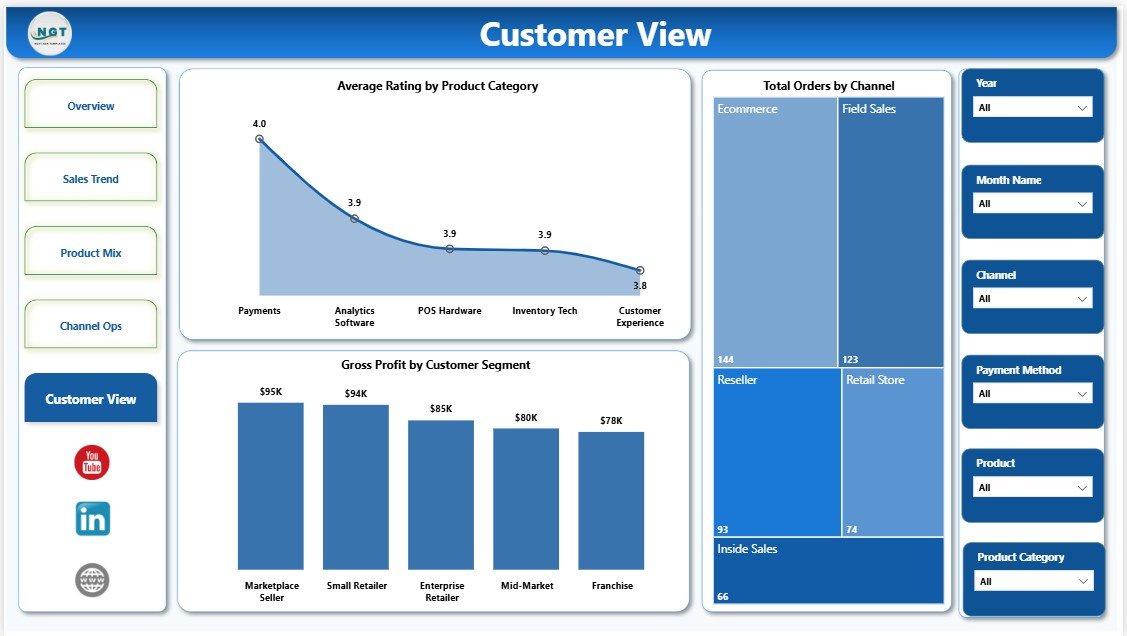
The Customer View page focuses on ratings, customer segments, and channel order volume. It includes Average Rating by Product Category, Gross Profit by Customer Segment, and Total Orders by Channel.
Average Rating by Product Category: Compares customer ratings across categories. It helps identify satisfaction strengths and product categories that need attention.
Gross Profit by Customer Segment: Shows which customer groups generate the most profit. It supports segment-level marketing and sales decisions.
Total Orders by Channel: Compares order volume by channel. It helps users understand where customer demand and operational load are concentrated.
RetailTech Dashboard in Power BI vs. Tableau vs. Paid CRM/SaaS – Where This Fits
| Criteria | This Power BI template | Tableau or Qlik alternative | Paid retail SaaS |
|---|---|---|---|
| Cost | One-time download | License plus report build time | Recurring subscription |
| Platform | Power BI Desktop and optional Power BI Service | Tableau or Qlik | Vendor-hosted retail platform |
| Setup time | Open PBIX, connect source, refresh | Manual model and visual build | Onboarding and configuration |
| Customizable fields | Edit visuals, measures, model, slicers, and pages | Editable with analyst skills | Often limited by vendor settings |
| Year-1 cost at 5 users | Template cost plus Microsoft licensing choice | License cost plus analyst time | Often hundreds or thousands per year |
Who This Template Is For – and Who It’s Not For
This dashboard is for retail owners, ecommerce managers, category managers, store operations teams, finance analysts, and Power BI consultants who need a reporting layer for prepared retail data. It is not a POS system, CRM, inventory transaction system, payment processor, or live ecommerce connector.
How to Use the RetailTech Dashboard in Power BI
- Download and unzip the product file.
- Open the PBIX file in Power BI Desktop.
- Review the five report pages and sample visuals.
- Replace or connect the sample data source with your own retail data.
- Refresh the report and validate the KPI cards.
- Use slicers to review filtered views by available retail dimensions.
- Publish to Power BI Service if your team needs browser sharing or scheduled refresh.
Real-World Use Cases
Store Operations Manager Priya: reviews returned orders, order status, city cost, and regional order demand before weekly store meetings.
Ecommerce Lead Daniel: checks payment method revenue, channel revenue, product margins, and product category ratings to understand online sales quality.
Retail Finance Analyst Sofia: compares gross profit, total cost, regional margin, and product profitability before monthly leadership reporting.
Frequently Asked Questions
Do I need Power BI Desktop?
Yes. Open and edit the PBIX file in Power BI Desktop, which is free from Microsoft.
Can I use my own retail data?
Yes. Replace or connect the sample source with your structured retail records and refresh the report.
Can I customize the dashboard?
Yes. You can edit visuals, measures, relationships, pages, filters, titles, and formatting in Power BI Desktop.
Is this a live retail system?
No. It is a Power BI reporting template, not a POS, inventory, CRM, or payment system.
Can I share it with my team?
Yes. Publish it to Power BI Service and share it based on your Microsoft licensing and workspace permissions.
Is this a subscription?
No. It is a one-time downloadable Power BI dashboard template.
About the Author
Built by PK – Microsoft Certified Professional with 15+ years of Excel, Google Sheets, and Power BI experience. Founder of NextGenTemplates, reaching 300K+ subscribers across YouTube channels. Every template is hand-built and tested before release.
Explore Related Templates
Pair this report with the RetailTech Dashboard in Excel. Browse more Power BI Dashboard templates and Power BI templates.
Download the RetailTech Dashboard in Power BI today and start reviewing retail revenue, costs, orders, returns, ratings, margins, products, channels, and customers in one editable PBIX report.


























Reviews
There are no reviews yet.