

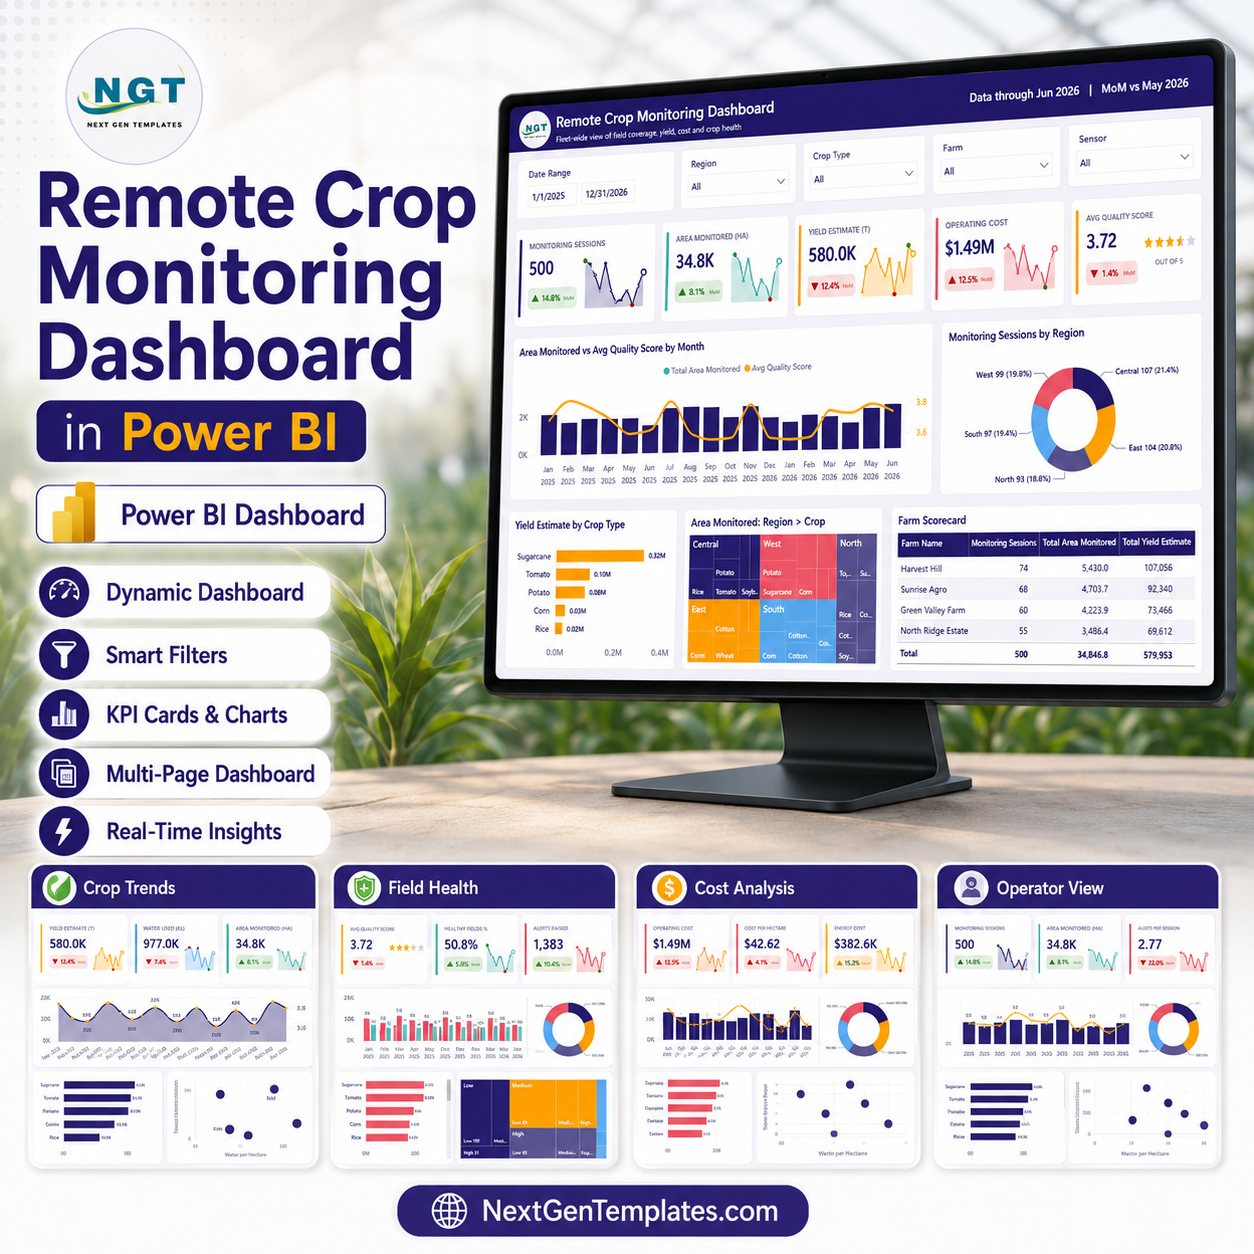

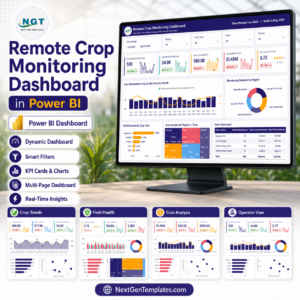
Remote Crop Monitoring Dashboard in Power BI gives farms, agribusiness teams, crop consultants, and drone monitoring operators a 5-page PBIX report for tracking monitoring sessions, hectares covered, yield estimate, operating cost, quality score, alerts, crop health, operator performance, and regional coverage. A farm monitoring only 25 fields twice per month can create 600+ session records per year, so manual reporting quickly becomes slow and inconsistent. This editable Power BI dashboard helps you turn those records into visual decisions for $17.99 one-time, with no recurring dashboard subscription.
Key Features of Remote Crop Monitoring Dashboard in Power BI
- 5 Power BI report pages: Overview, Crop Trends, Field Health, Cost Analysis, and Operator View.
- 5 executive KPI cards: Monitoring Sessions, Area Monitored (HA), Yield Estimate (T), Operating Cost, and Avg Quality Score.
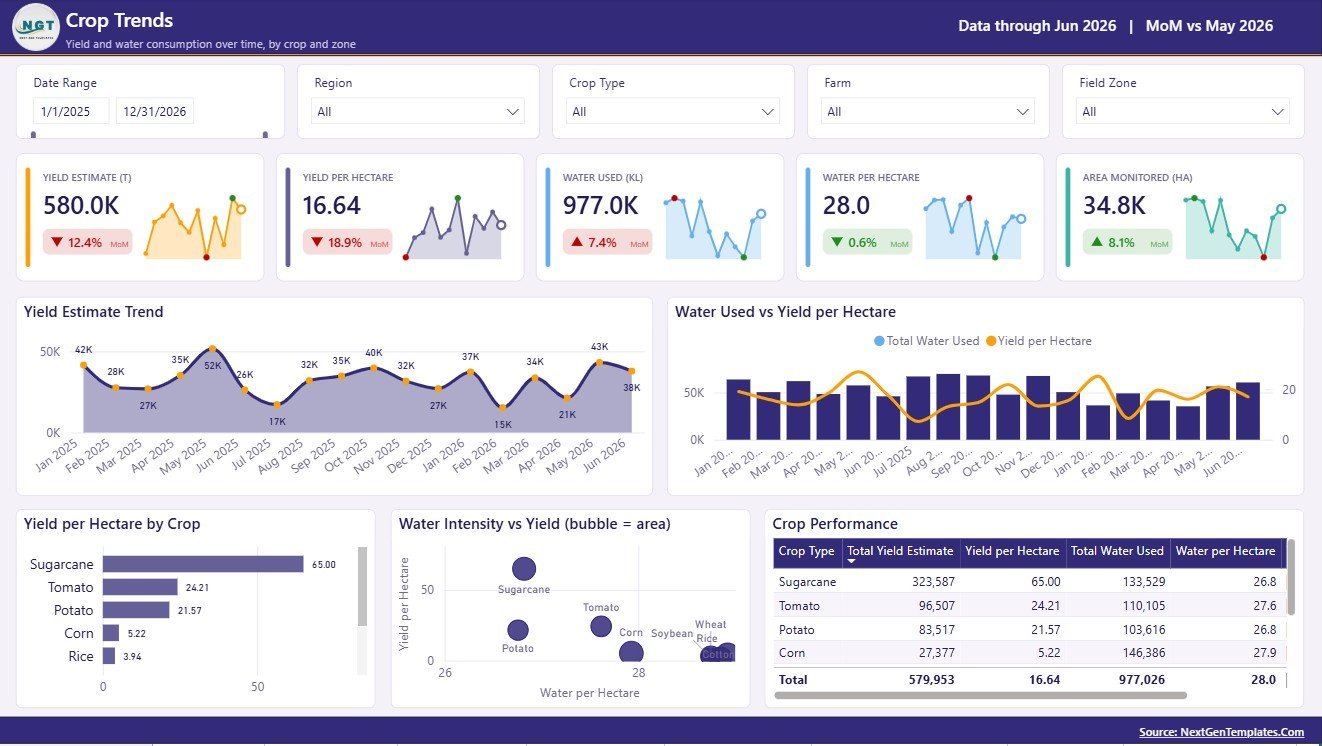
- Crop trend reporting: Review yield estimate, yield per hectare, water used, water intensity, and crop performance over time.
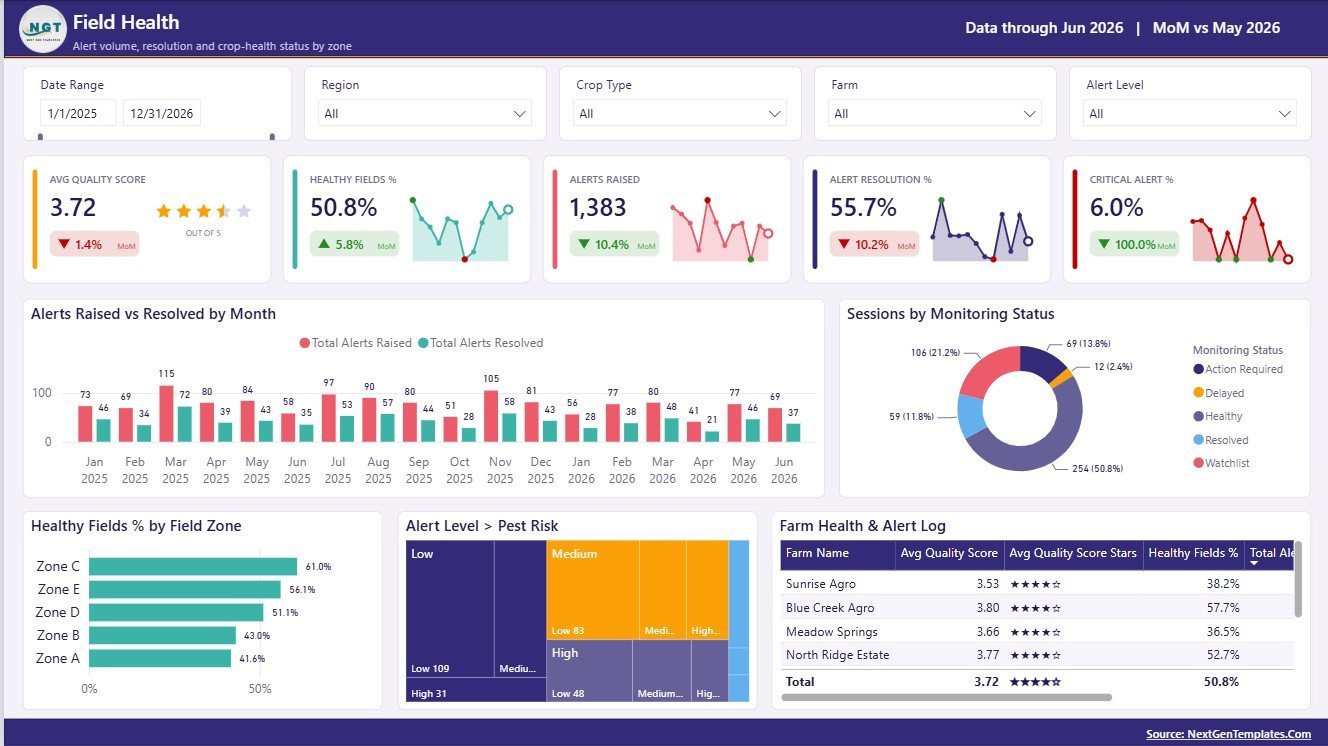
- Field health monitoring: Track alerts raised, alerts resolved, monitoring status, healthy fields percentage, pest risk, and farm health logs.
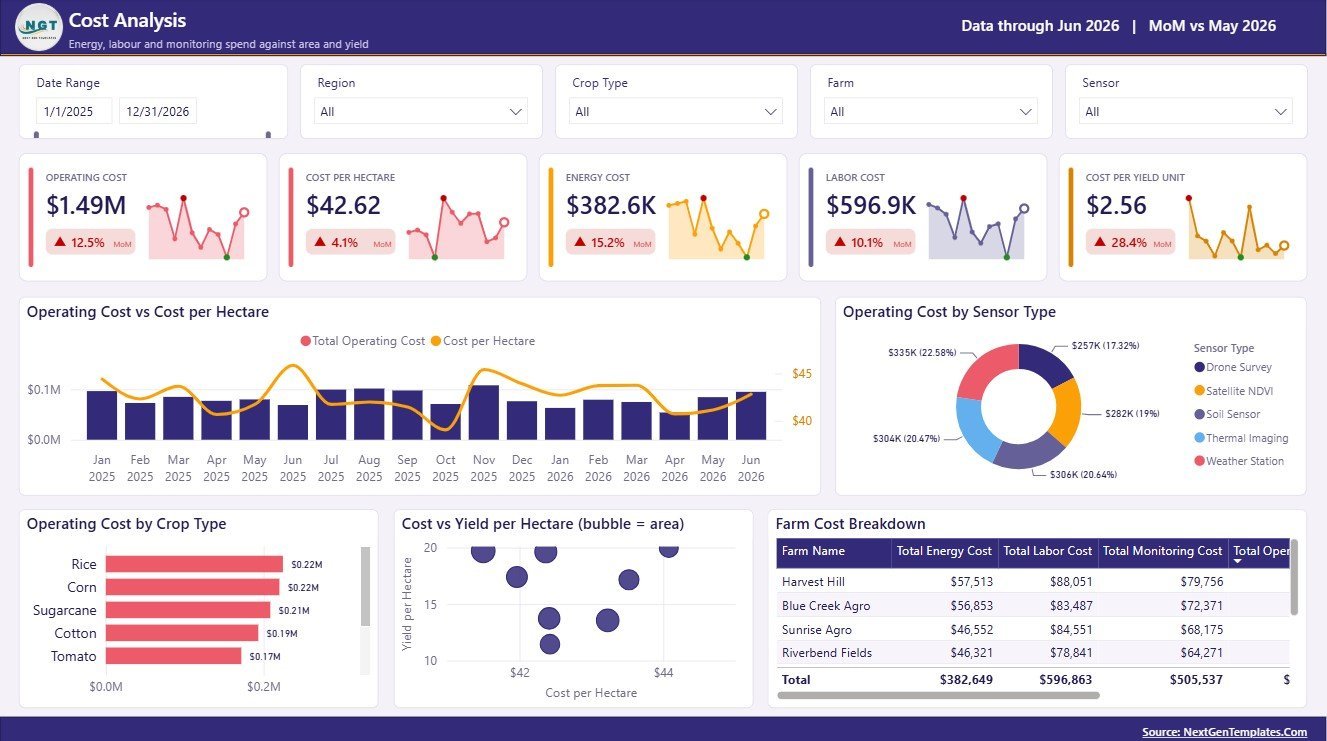
- Cost analysis: Compare operating cost by month, sensor type, crop type, farm, region, and cost per hectare.
- Operator performance: Review drone operator coverage, quality score, sensor mix, alert load, and resolution percentage.
- Interactive slicers: Filter by month, region, crop, farm, sensor type, operator, monitoring status, alert level, and field zone.
What’s Inside the Remote Crop Monitoring Dashboard in Power BI
1. Overview Page
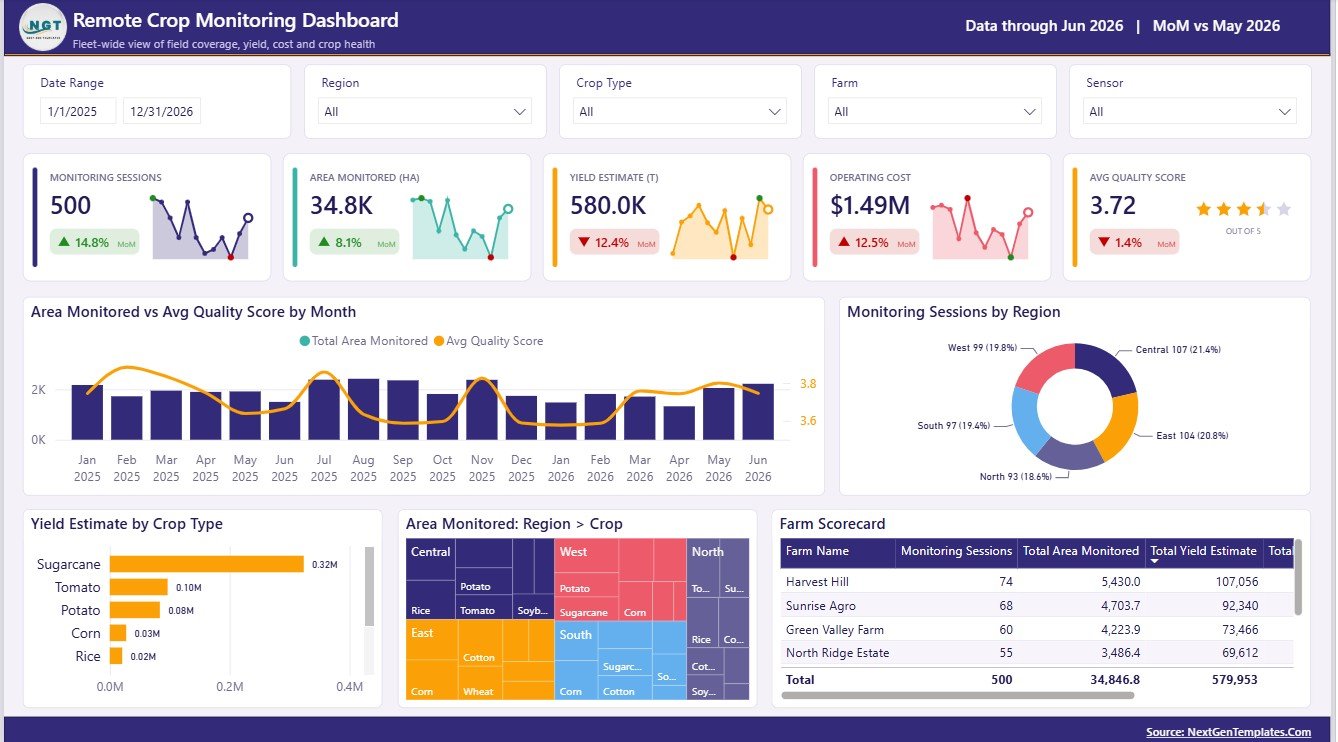
The Overview page gives management a high-level view of crop monitoring operations. The top cards show Monitoring Sessions, Area Monitored (HA), Yield Estimate (T), Operating Cost, and Avg Quality Score so users can evaluate coverage, productivity, spending, and field monitoring quality in one place.
Area Monitored and Avg Quality Score by Month: This chart compares monthly coverage with quality score movement. It helps teams see whether expanding monitored area is also maintaining reliable data quality.
Monitoring Sessions by Region: This visual shows how monitoring activity is distributed across regions. It helps managers identify areas receiving strong attention and regions that may need additional visits.
Yield Estimate by Crop Type: This chart compares estimated yield across crop categories. It helps agronomy teams identify stronger crops, weaker crops, and possible production risks.
Area Monitored by Region and Crop: This chart breaks monitored hectares by geography and crop type. It supports planning for drone routes, sensor allocation, and regional crop reviews.
Farm Scorecard by Farm Name: This table ranks farms by monitoring, yield, cost, and quality indicators. It helps users compare farm performance and quickly spot fields that need follow-up.
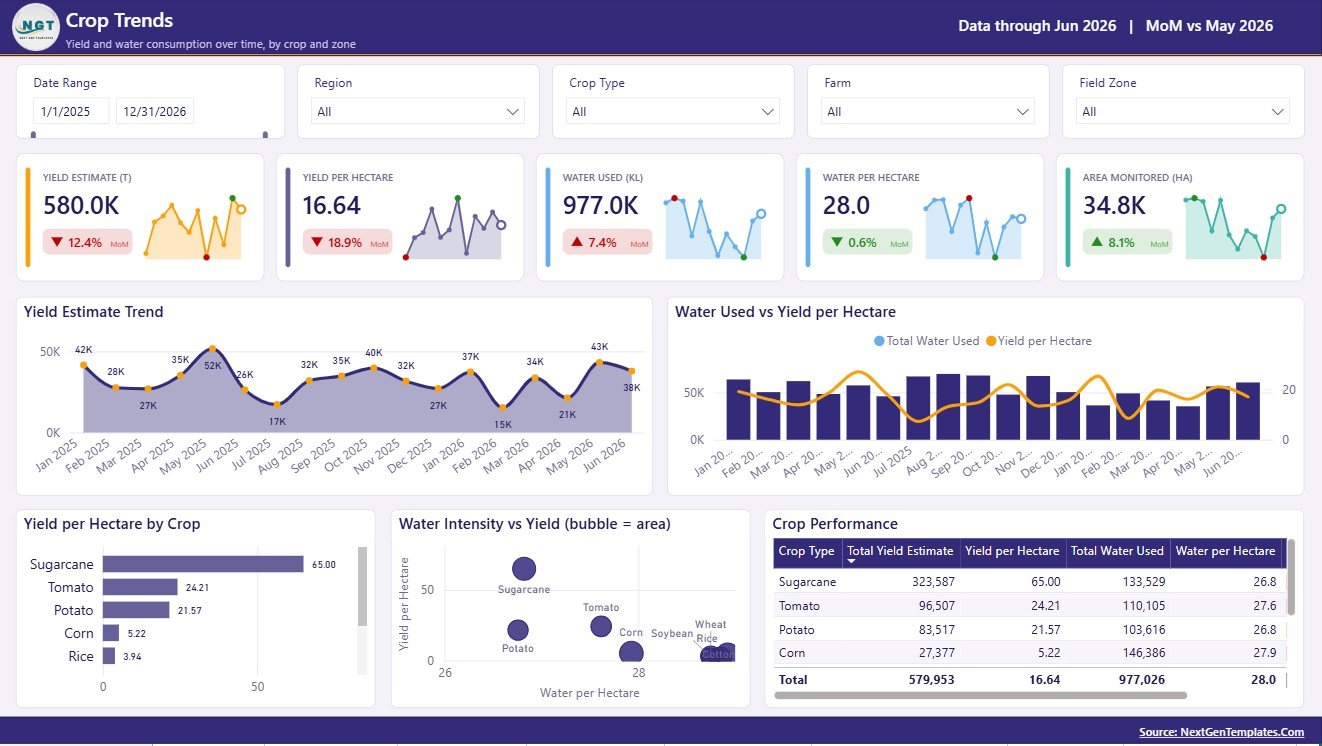
2. Crop Trends
The Crop Trends page focuses on production movement and water efficiency. Yield Estimate by Month shows monthly production direction, Water Used and Yield per Hectare by Month compares resource use with productivity, Yield per Hectare by Crop ranks crop efficiency, Water Intensity and Yield by Crop highlights crop-level tradeoffs, and Crop Performance by Crop Type summarizes crop output in a scorecard format.
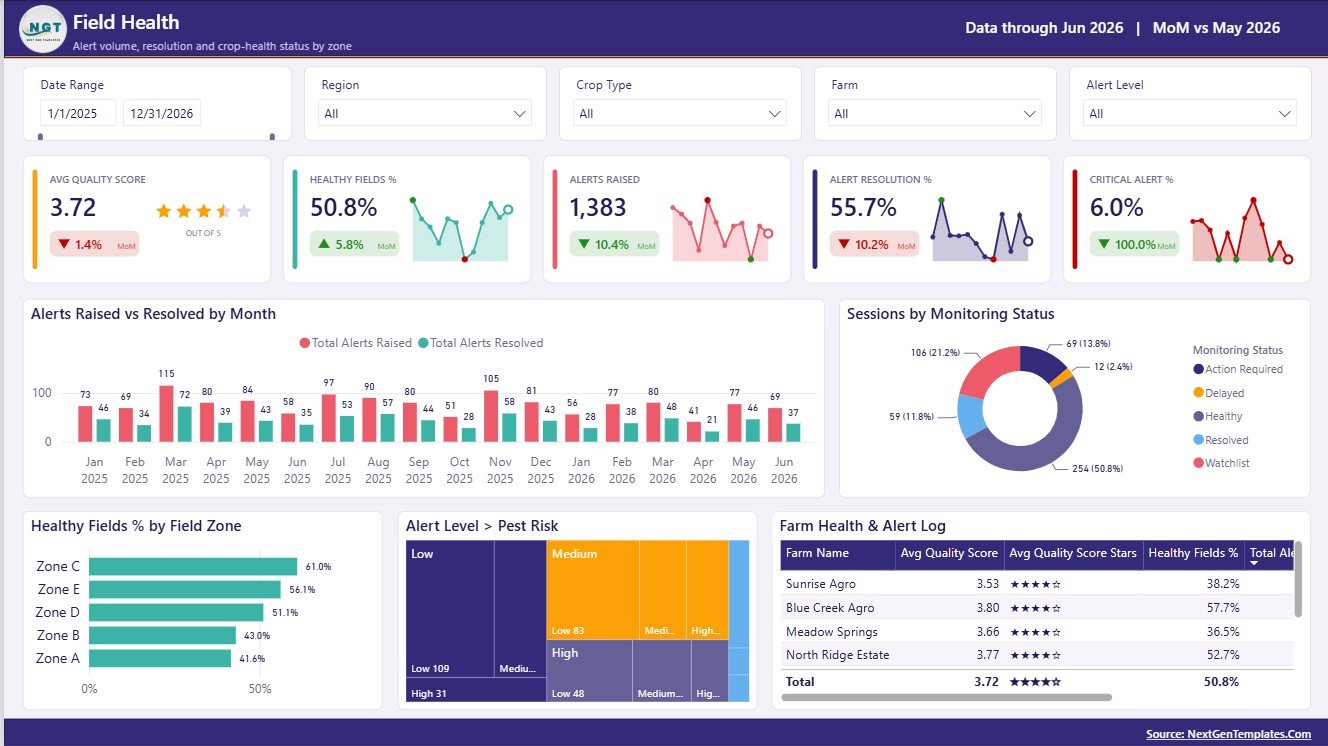
3. Field Health
The Field Health page helps teams monitor operational risk and crop condition. Alerts Raised and Alerts Resolved by Month measures issue flow, Sessions by Monitoring Status shows field visit progress, Healthy Fields % by Field Zone compares field condition across zones, Alert Level by Pest Risk connects pest exposure to severity, and Farm Health and Alert Log by Farm Name gives a farm-level action list.
4. Cost Analysis
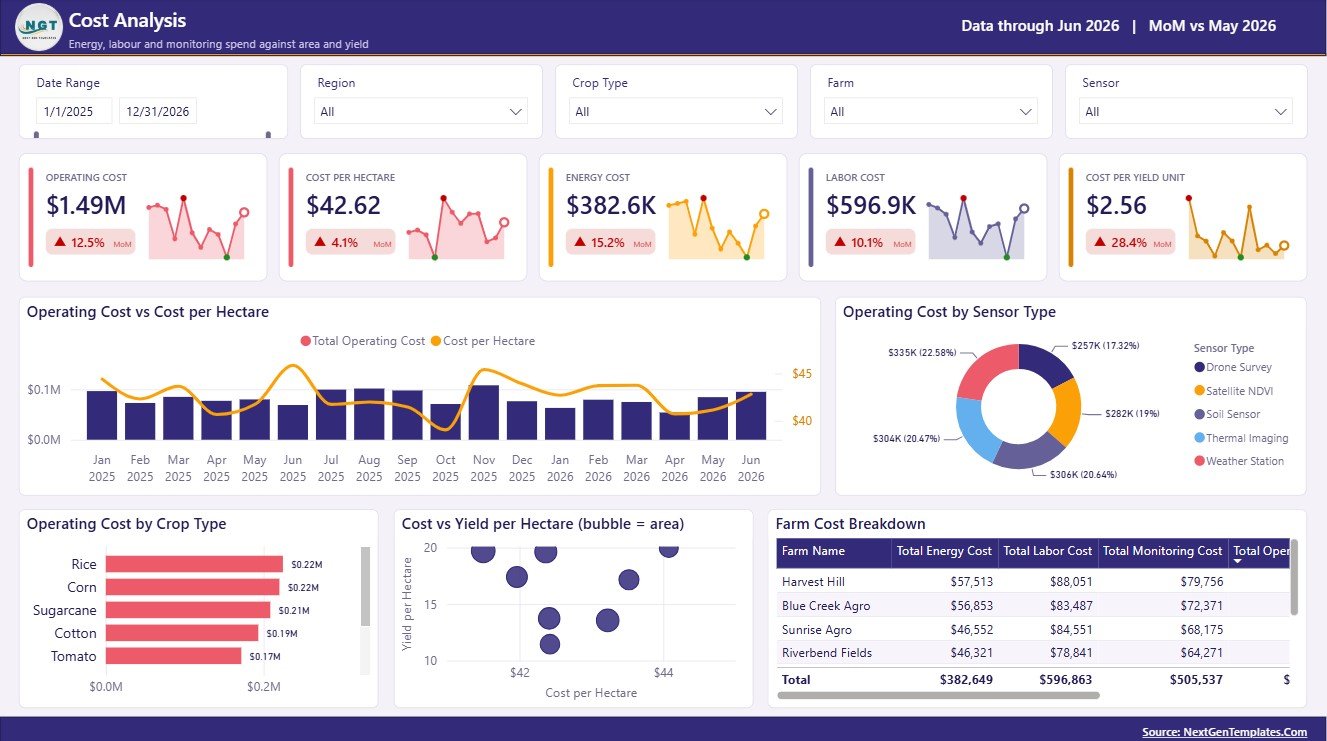
The Cost Analysis page reviews how monitoring spend behaves across time, crops, sensors, and farms. Operating Cost and Cost per Hectare by Month tracks spending efficiency, Operating Cost by Sensor Type compares monitoring technology cost, Operating Cost by Crop Type shows crop-level cost concentration, Cost and Yield per Hectare by Farm compares investment with output, and Farm Cost Breakdown by Farm Name provides detailed farm cost review.
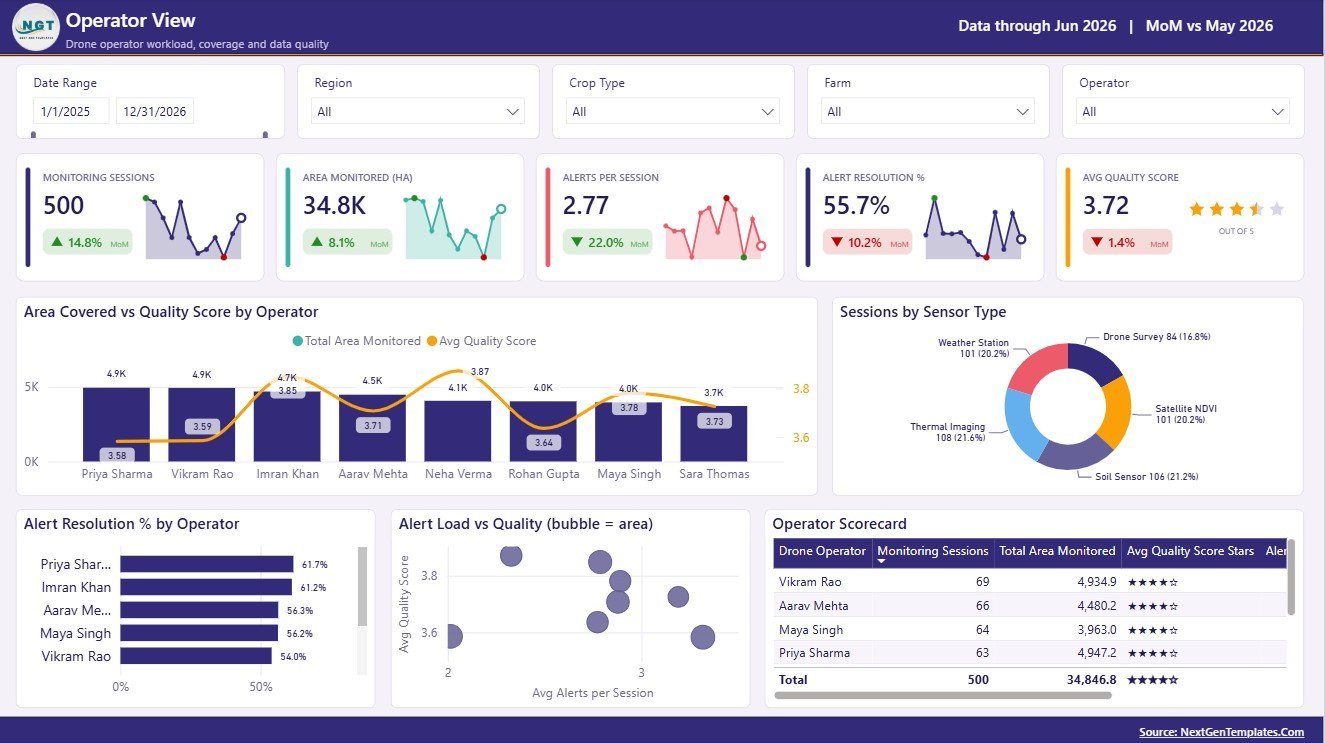
5. Operator View
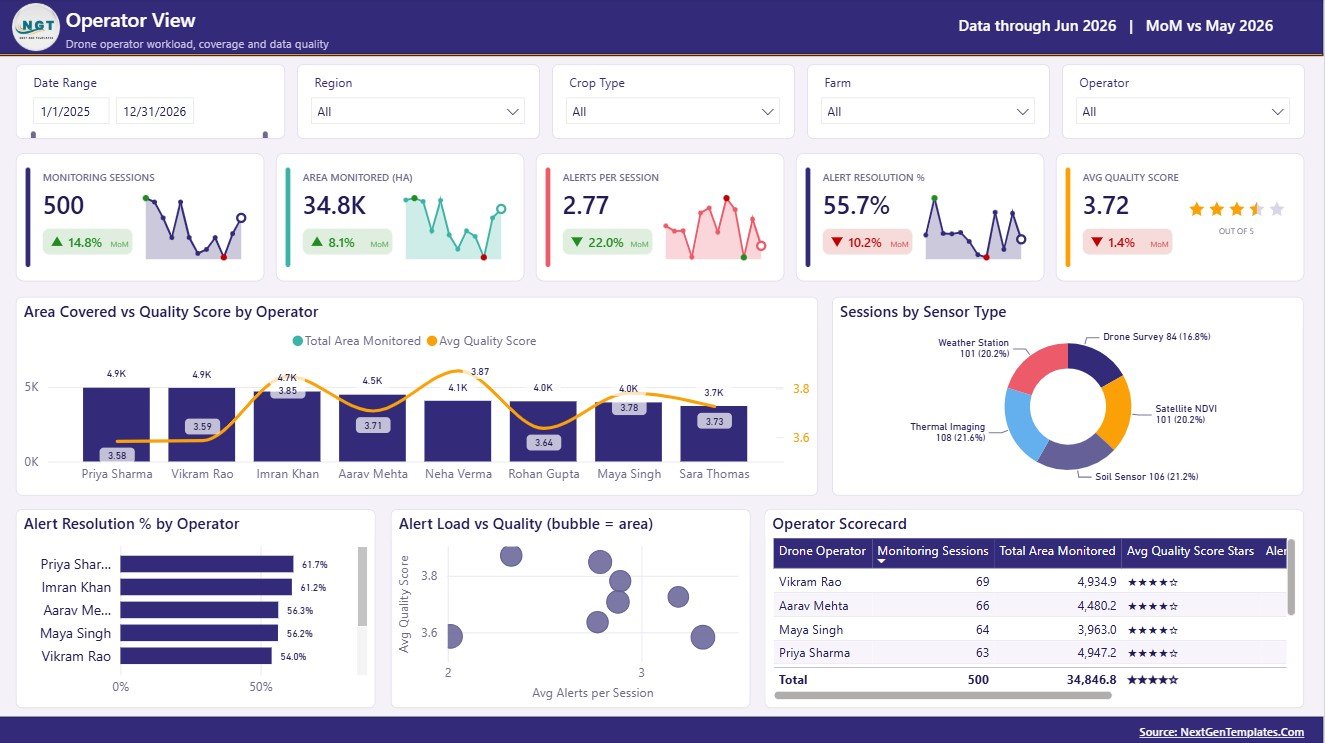
The Operator View page is built for drone and field monitoring team performance. Area Covered and Quality Score by Operator compares workload and output quality, Sessions by Sensor Type shows technology usage, Alert Resolution % by Operator tracks response performance, Alert Load and Quality by Operator highlights workload balance, and Operator Scorecard by Drone Operator gives a clear operator-level review.
Remote Crop Monitoring Dashboard in Power BI vs. Tableau vs. Paid CRM/SaaS – Where This Fits
| Feature | This Power BI template | Tableau or Qlik alternative | Paid farm management SaaS |
|---|---|---|---|
| Cost | $17.99 one-time sale price | License cost plus report build time | Monthly or annual subscription |
| Platform | Power BI Desktop and optional Power BI Service | Tableau or Qlik environment | Vendor-hosted web app |
| Setup time | Open PBIX, replace source, refresh | Build model and visuals manually | Onboarding and configuration |
| Real-time team collaboration | Available after publishing to Power BI Service | Available by license plan | Usually included |
| Mobile access | Available through Power BI mobile after publishing | Available by platform | Usually included |
| Customizable fields | Edit model, measures, visuals, pages, and slicers | Editable with analyst skills | Often limited by vendor settings |
| Share with link | Available through workspace permissions | Available through server permissions | Usually login controlled |
| Year-1 cost at 5 users | Template cost plus Microsoft licensing choice | License cost plus analyst time | Often hundreds or thousands per year |
| Crop monitoring metrics | Sessions, hectares, yield, water, quality, alerts, cost, sensor type, region, farm, crop, and operator | Must be designed manually | Depends on reporting module |
Who This Template Is For – and Who It’s Not For
This dashboard is for agribusiness analysts, farm owners, crop consultants, precision agriculture teams, drone operators, field supervisors, regional managers, and agriculture consultants who need a practical Power BI reporting layer for crop monitoring data. It is not a live drone control system, satellite imagery processor, IoT sensor platform, farm ERP, pesticide recommendation engine, or automated agronomy advisory tool.
How to Use the Remote Crop Monitoring Dashboard in Power BI
- Download and unzip the product file.
- Open the PBIX file in Power BI Desktop.
- Review the sample Overview, Crop Trends, Field Health, Cost Analysis, and Operator View pages.
- Replace the sample data source with your crop monitoring data.
- Refresh the report and validate the KPI cards.
- Use slicers to filter by month, region, crop, farm, sensor type, operator, status, and field zone.
- Publish to Power BI Service if your team needs browser access, sharing, or scheduled refresh.
Real-World Use Cases
Anika, agribusiness manager: reviews monthly hectares monitored, yield estimate, quality score, and regional sessions before allocating the next drone monitoring schedule.
Rohan, crop consultant: uses the Crop Trends and Field Health pages to compare crop yield, water intensity, pest risk, and alert resolution during client review meetings.
Meera, drone operations lead: tracks operator coverage, alert load, sensor type usage, and quality score to balance field assignments across monitoring teams.
Frequently Asked Questions
What does the dashboard track?
It tracks monitoring sessions, area monitored in hectares, yield estimate, operating cost, quality score, yield per hectare, water used, water intensity, alerts raised, alerts resolved, monitoring status, pest risk, sensor type, region, farm, crop, and operator performance.
Do I need Power BI Desktop?
Yes. Open and edit the PBIX file in Power BI Desktop, which is free from Microsoft. Power BI Service is optional for sharing and scheduled refresh.
Can I use my own farm data?
Yes. Replace the sample data source with your structured crop monitoring records and refresh the report so all pages update.
Can I customize the dashboard pages?
Yes. You can edit visuals, slicers, measures, colors, titles, data model relationships, and source connections in Power BI Desktop.
Does this connect directly to drones or sensors?
No. It is a dashboard template for prepared monitoring data. Direct drone, satellite, or IoT connections require separate data integration work.
Is this a subscription?
No. It is a one-time downloadable Power BI dashboard template.
About the Author
Built by PK – Microsoft Certified Professional with 15+ years of Excel, Google Sheets, and Power BI experience. Founder of NextGenTemplates, reaching 300K+ subscribers across YouTube channels. Every template is hand-built and tested before release.
Explore Related Templates
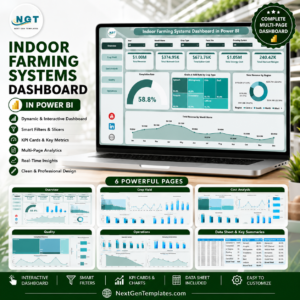
Pair this dashboard with Plant Nurseries Dashboard in Power BI, Indoor Farming Systems Dashboard in Power BI, Indoor Farming Systems Dashboard in Excel, and Aquaculture KPI Scorecard in Excel. Browse more Power BI Dashboard templates and Power BI templates.
Detailed blog post: Remote Crop Monitoring Dashboard in Power BI.
Download the Remote Crop Monitoring Dashboard in Power BI today and start reviewing crop coverage, yield, health alerts, cost, water efficiency, and operator performance in one editable PBIX report.
Last updated: August 3, 2026.
Watch the demo video:
Compatibility and Requirements
- Works in Power BI Desktop, which is free from Microsoft. Microsoft explains how to install it in Get Power BI Desktop.
- The report is a PBIX file. Power BI Service is optional and is only needed for browser access, sharing or scheduled refresh.
- The dashboard reads prepared crop monitoring data. It does not connect to drones, satellites or IoT sensors on its own.
Related Agriculture and Monitoring Templates
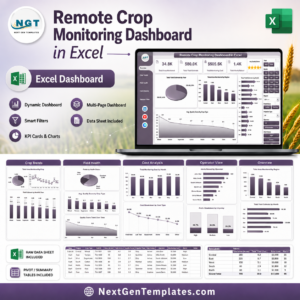
- Remote Crop Monitoring Dashboard in Excel: the same crop monitoring reporting in Excel
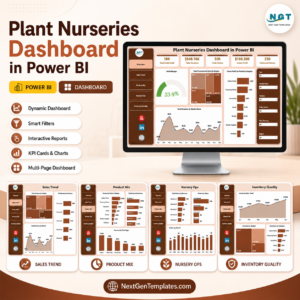
- Plant Nurseries Dashboard in Power BI: another agriculture dashboard in Power BI
- Indoor Farming Systems Dashboard in Power BI: a Power BI dashboard for indoor farms
- Compliance Monitoring Dashboard in Power BI: a monitoring dashboard for tracking compliance in Power BI
Browse all Power BI dashboards.

















Reviews
There are no reviews yet.