


E-commerce analytics is now a recurring operating expense the way rent used to be. Triple Whale’s basic plan opens at $299 per month and scales to $429 once you cross $1M in annual GMV. Polar Analytics starts around $720 per month and runs a $6M-revenue brand roughly $1,020 per month — $12,240 per year before a single attribution add-on. Glew tiers climb from $79 to $649 per month based on revenue bands. Shopify Analytics Plus is bundled into the Plus plan at $2,300+ per month. And every one of these platforms uses GMV-tiered pricing, which means the more you grow, the more you pay — in perpetuity.
The Sales Dashboard For Online Store in Excel is built for the e-commerce operators who haven’t yet crossed the threshold where a $300-to-$1,000-per-month subscription makes financial sense, and for the ones who have but still want a flat, owned reporting layer they fully control. Five sheet tabs — Overview, Product Performance, Lead Source, Region, and Monthly Trends — cover the core e-commerce KPIs: Gross Sales, Net Sales, Discount, Shipping Cost, Profit Margin %, COGS, Gross Profit, plus profitability drilldowns by product, category, region, and lead source. Paste your Shopify, WooCommerce, BigCommerce, Magento, Wix, or Etsy export into the data sheet. The entire dashboard refreshes. One-time $17.99.
Why E-Commerce Analytics Spend Doesn’t Match the Actual Visibility Gap
- Triple Whale’s basic plan starts at $299 per month and climbs to $429 for brands crossing $1 million in annual GMV — with costs scaling steeply for larger stores and AI-attribution add-ons charged separately.
- Polar Analytics opens at roughly $720 per month and lands a $6M-revenue brand at approximately $1,020 per month — more than $12,000 per year before raw data warehouse access or advanced attribution add-ons.
- Glew’s Pro tier scales from $79 per month for sub-$1M brands up to $649 per month at $10M-$15M revenue, with enterprise pricing above that — and users frequently report slow dashboard loads and fragmented multi-channel views.
- Shopify Analytics Plus is bundled only with Shopify Plus at $2,300+ per month, pricing it out of reach for every Shopify store under roughly $1M in annualized revenue.
Here’s the mismatch: most e-commerce stores under $1M in annual revenue don’t actually need multi-touch attribution modeling with iOS 14.5 compensation or Snowflake data warehouses. They need five things — what’s my gross sales this month, what’s my actual net sales after discounts and shipping, which products are profitable after COGS and which ones are bleeding margin, which lead source returns profitable customers, and what does the trend look like month over month. Every one of those five questions is answerable from a clean CSV export and a well-structured Excel workbook. This dashboard is that workbook.
What’s Inside — 5 Analytical Sheets
🧭 Overview Sheet — Full Sales Snapshot
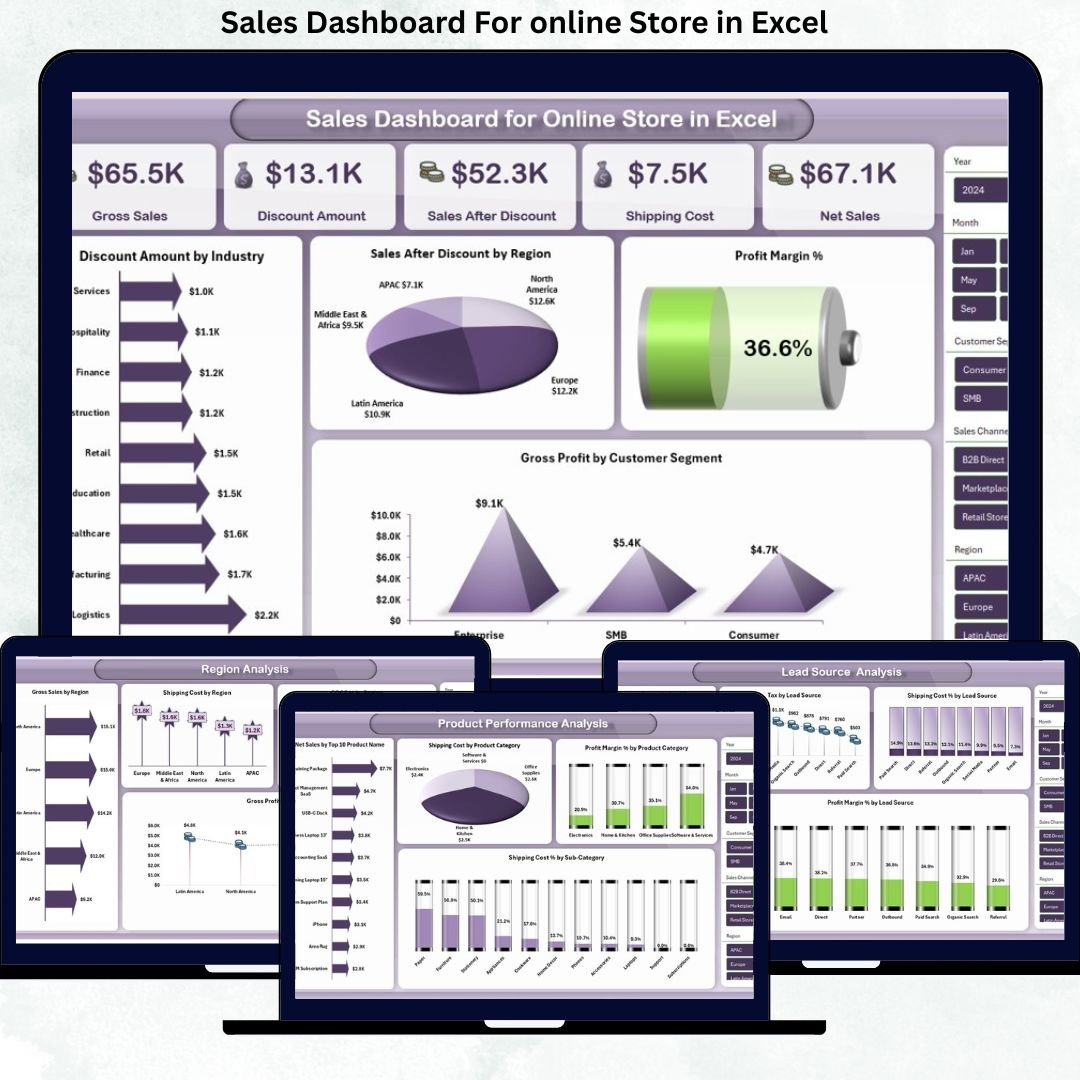
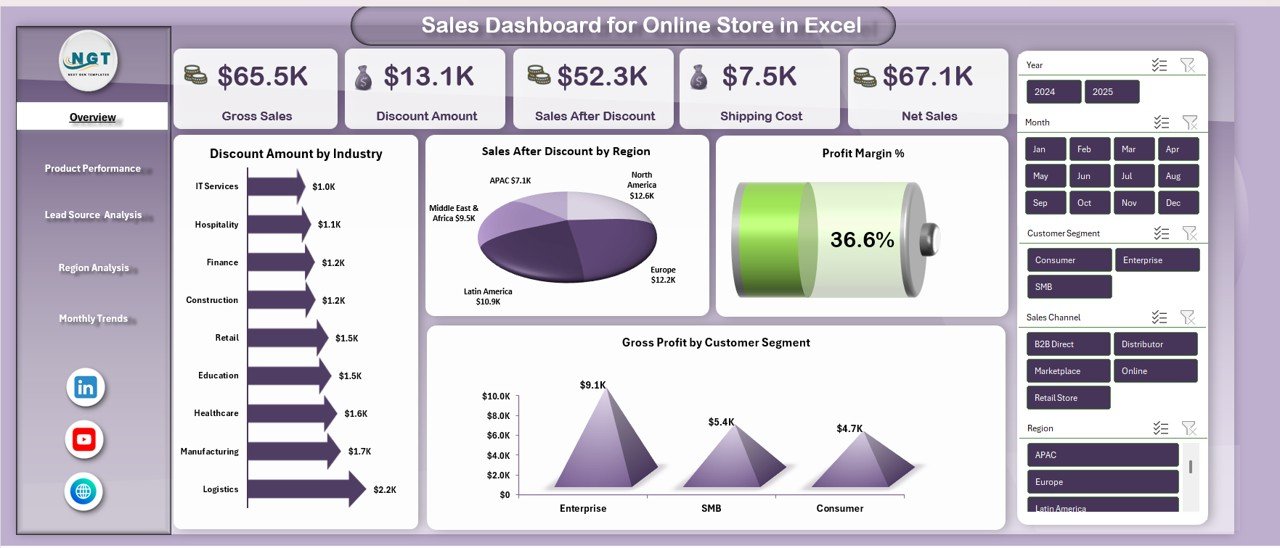
The landing sheet. Six headline KPIs — Gross Sales, Discount Amount, Sales After Discount, Shipping Cost, Net Sales, and Profit Margin % — plus two visual charts: Discount by Industry and Sales by Region. This is the page you screenshot for the weekly team meeting or the monthly board review.
📦 Product Performance Analysis
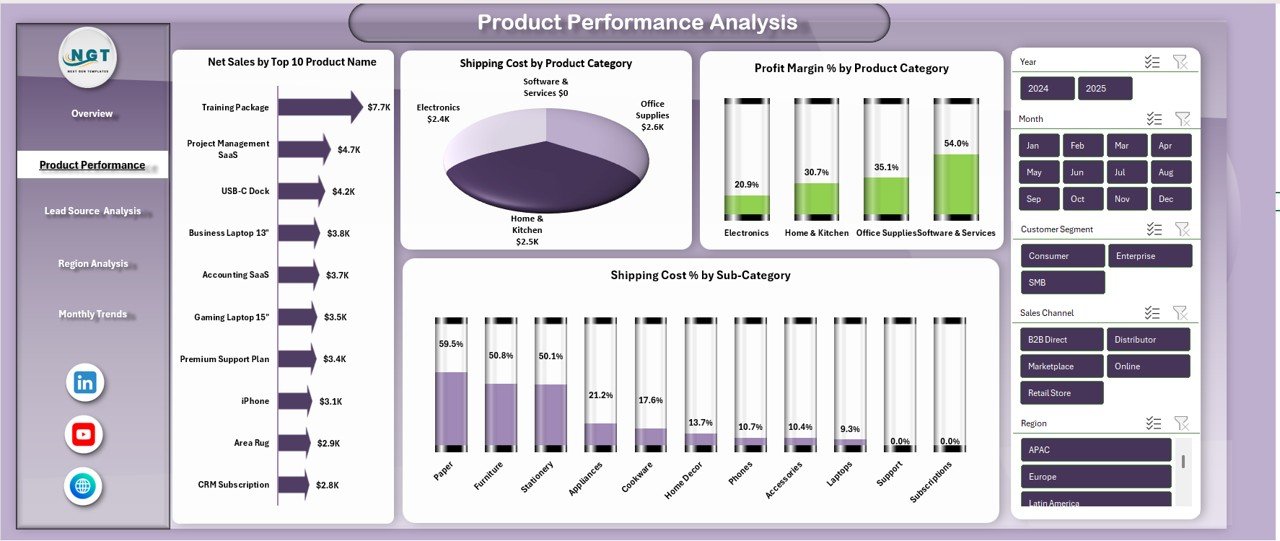
SKU-level profitability. Four charts: Net Sales by Top 10 Products, Shipping Cost by Product Category, Profit Margin % by Category, and Shipping Cost % by Sub-Category. Instantly surfaces the products where shipping cost is quietly eroding margin, and the categories where profitability is strongest. Critical for inventory planning and pricing decisions.
🎯 Lead Source Analysis
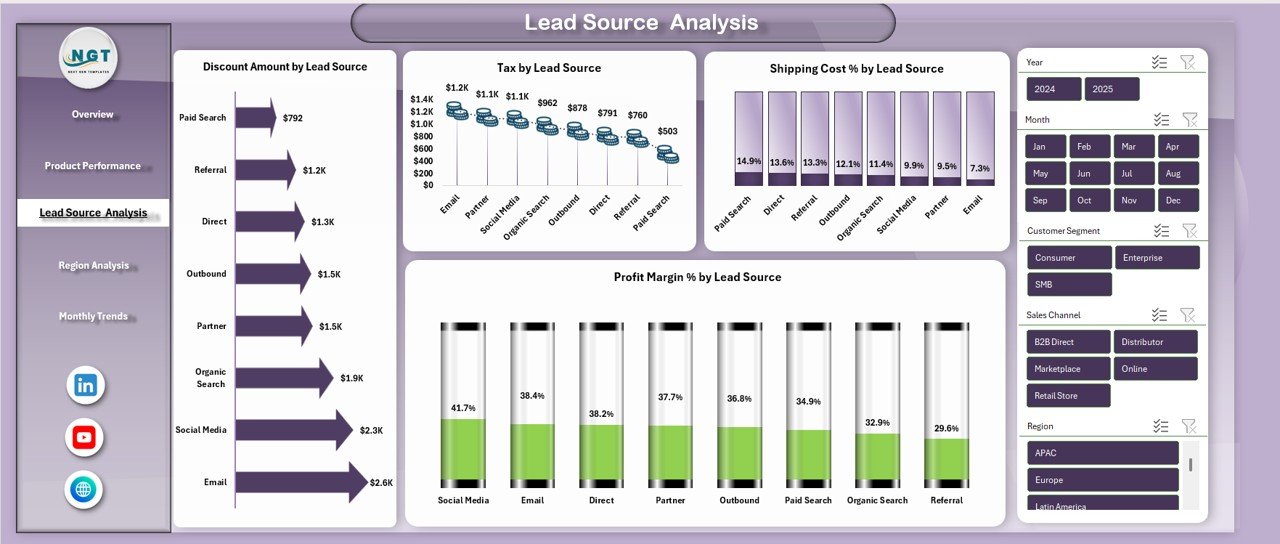
Marketing ROI at the channel level. Analyzes Discount Amount, Tax, Shipping Cost %, and Profit Margin % by Lead Source — Google Ads, Meta Ads, TikTok, organic, email, referral, affiliate. Answers the question native Shopify analytics can’t: which channels produce profitable customers versus which channels only move revenue at a loss after discount and shipping.
🌍 Region Analysis
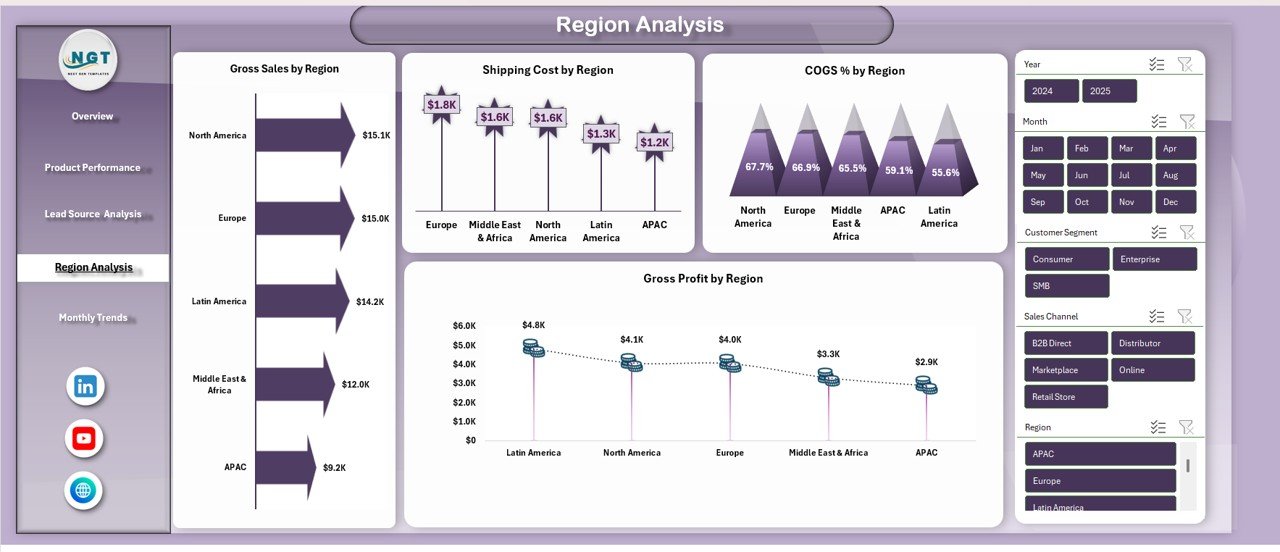
Geographic profitability. Compares Gross Sales, Shipping Cost, Gross Profit, and COGS % across regions. This is where most e-commerce operators discover they’re losing money shipping into certain zones — data their 3PL statements don’t show them directly, and data Shopify Standard analytics doesn’t surface at this grain.
📆 Monthly Trends Sheet
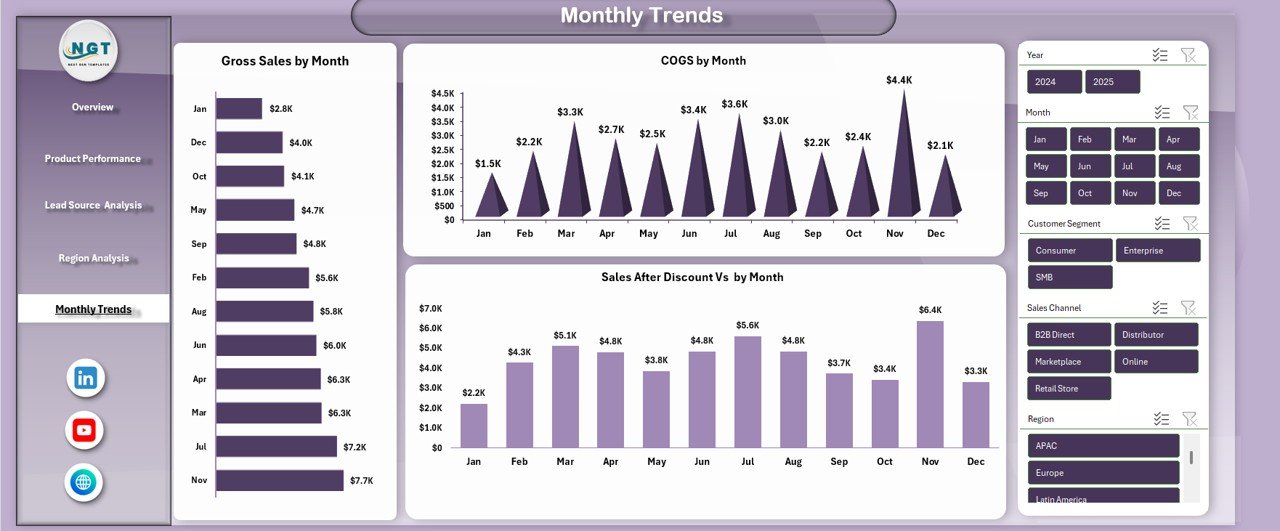
Time-series view. Tracks Gross Sales, COGS, and Sales After Discount month-by-month. Surfaces seasonality, growth patterns, and cost drift. The chart to bring to investor updates, quarterly business reviews, and marketing-budget planning conversations.
📊 Stop paying $300-$1,020 per month for analytics you can own for $17.99.
Get a ready-to-use 5-sheet e-commerce analytics workbook covering gross sales, net sales, profit margin, product profitability, lead source ROI, regional analysis, and monthly trends. Paste your data, refresh, present.
Excel Dashboard vs. Triple Whale / Polar / Glew vs. Shopify Native Analytics
| Feature | Our Excel Dashboard | Triple Whale / Polar / Glew | Shopify Standard Analytics |
|---|---|---|---|
| License Cost | One-time $17.99 | $79-$1,020+/month (GMV-tiered) | Included with Shopify subscription |
| Data Ownership | ✅ Full local control | Cloud-only, vendor-held | Cloud-only, Shopify-held |
| Product Profitability (Net Sales, COGS, Profit Margin %) | ✅ Full analysis by product, category, sub-category | ✅ Native, often requires upgrade tier | Limited — revenue only, no cost breakdown |
| Lead Source / Channel ROI | ✅ Profit Margin % by channel | ✅ Native multi-touch attribution | Basic acquisition reports |
| Multi-Touch Attribution (iOS 14.5-proof) | ❌ No server-side pixel | ✅ First-party pixels (Triple Whale / Polar) | Limited post-iOS 14.5 |
| Real-Time Dashboard Refresh | Manual (paste data) | ✅ 15-min to hourly auto-refresh | ✅ Near-real-time |
| Multi-Channel (Shopify + Amazon + WooCommerce + Etsy) | ✅ Paste any CSV export | ✅ 100+ native connectors | ❌ Shopify-only |
| Customer Lifetime Value (LTV) Cohorts | ❌ Not included | ✅ Cohort analysis native | Basic |
| AI Predictive Forecasting | Excel FORECAST function | ✅ AI agents (extra add-on) | ❌ No |
| Best For | E-commerce stores $0-$1M annual GMV, or operators who want owned, flat-cost reporting at any scale | Brands $1M-$50M GMV needing real-time attribution, cohort analysis, and multi-channel unification | Shopify merchants already on Plus or happy with surface-level native reporting |
Honest positioning — if you’re running a $5M+ DTC brand with Meta, TikTok, and Google Ads spend in the tens of thousands per month and you need multi-touch attribution to allocate that budget correctly, Triple Whale and Polar Analytics are legitimate tools. They solve a real problem. What this dashboard replaces is the $300-$1,020 per month spend for brands that aren’t yet at that scale — or for brands that are, but want a clean, owned reporting layer they can share with an investor, an accountant, or a CFO without exposing live platform access.
Who Uses This Dashboard
| Role | Primary Use Case |
|---|---|
| Online Store Owners | Weekly P&L visibility, product profitability review, board decks |
| E-Commerce Managers | Monthly reporting, channel ROI analysis, seasonal planning |
| Finance & Accounts Teams | Gross Profit tracking, margin analysis, COGS reconciliation |
| Digital Marketing Teams | Lead source profitability, discount impact on margin |
| Sales Analysts | Deep-dive product, region, and trend analysis |
| Shopify / WooCommerce / BigCommerce Merchants | Platform-independent reporting layer that survives platform migrations |
| Amazon & Etsy Sellers | Cross-marketplace consolidated reporting |
| D2C Brand Founders | Investor-ready metrics without granting dashboard access |
Benefits You’ll See in the First 30 Days
- 💰 $3,500-$12,000 annual savings vs. the typical SMB e-commerce analytics subscription stack
- 🎯 SKU-level profitability visibility — find the products quietly bleeding margin to shipping cost
- 📊 Lead source ROI — discover which channels drive profitable customers, not just top-line revenue
- 🌍 Regional profitability view — spot high-shipping-cost zones that erode margin
- 📈 Monthly trend surface — catch seasonality and cost drift before they compound
- 🔄 Platform-independent — works for Shopify, WooCommerce, BigCommerce, Magento, Wix, Etsy, Amazon
- 🔓 Full data ownership — your data stays with you, not in a vendor’s warehouse
How to Use the Dashboard (Step-by-Step)
- Download and open the .xlsx file in Microsoft Excel (Windows, Mac, or Excel Online).
- Navigate to the data sheet — this is where your raw sales data lives.
- Export your sales data — Shopify Orders Export, WooCommerce Reports → Orders, BigCommerce Export, Magento Reports, Wix Sales Reports, or Etsy Sold Orders all export to CSV natively.
- Paste your data into the data sheet — match the column structure: Date, Product, Region, Lead Source, Sales, Discount, Shipping, Tax, COGS.
- Refresh pivot tables if prompted (Data tab → Refresh All in Excel).
- Click to any dashboard sheet — Overview, Product Performance, Lead Source, Region, or Monthly Trends. All KPIs and charts refresh automatically.
- Review Overview for the headline numbers — Gross Sales, Net Sales, Profit Margin % — before drilling into specifics.
- Drill into Product Performance to identify margin leaks at the SKU or category level.
- Compare Lead Source Profit Margin % against your ad spend reports — this is where you’ll find misallocated marketing budget.
- Use Monthly Trends for board updates, quarterly reviews, and marketing planning.
Optional Upgrades You Can Add Later
- Shopify Power Query Auto-Refresh — connect Excel’s Power Query directly to your Shopify Admin API for automatic daily refresh without manual export.
- Multi-Channel Consolidator — add a consolidation sheet that combines Shopify + Amazon + Etsy + WooCommerce exports into a single unified data model.
- Inventory & Stock Layer — join in current inventory position to produce stock-adjusted profit forecasts.
- AOV, CAC, and LTV Calculations — add customer-level cohort analysis using repeat-purchase data.
- Returns & Refunds Module — track refund rates by product and region to adjust Net Sales accurately.
- Power BI Overlay — connect a Power BI report to the same data sheet for interactive web-based dashboards with row-level security.
- Automated PDF Report Export — use Excel VBA or Power Automate to schedule a weekly PDF export and email delivery to stakeholders.
Best Practices From High-Performing E-Commerce Operators
- Refresh weekly, not daily. Daily refresh creates noise without insight. Weekly refresh aligned to your order cycle surfaces real trends.
- Populate COGS accurately — this is non-negotiable. The biggest reason e-commerce operators misread their business is stale or missing COGS data. A Product Performance sheet without accurate COGS is a revenue report, not a profitability report.
- Include shipping cost at the line-item level. Regional profitability falls apart when shipping is flat-allocated. Pull actual shipping cost per order from your 3PL or shipping provider.
- Segment lead source consistently. “Facebook”, “facebook.com”, “fb_ads”, and “Meta” will look like four different channels on your report. Normalize source values in a dropdown list before pasting.
- Pair this dashboard with a paid-ads report. This dashboard tells you Profit Margin % by lead source. Your ad platforms tell you spend. The two together tell you true ROAS.
Related Templates You May Need
- Monthly Sales Tracker in Google Sheets — simpler single-sheet sales tracking for new stores
- Inventory Management System in Excel (V3.0) — track stock, reorder points, and SKU-level inventory
- Manufacturing Dashboard in Excel — if you’re a brand that also manufactures
- HR Dashboard in Excel — workforce analytics for growing e-commerce teams
- All Sales & Marketing Templates — complete catalog
- All Excel & Power BI Dashboards
Frequently Asked Questions
Can this replace Triple Whale, Polar Analytics, or Glew?
For e-commerce stores under $1M in annual GMV, yes — it covers the core reporting needs (Net Sales, Profit Margin %, product profitability, lead source ROI, regional analysis, monthly trends) at 0.4% of the annual cost of a Triple Whale subscription. For brands above $1M GMV with significant Meta/Google/TikTok ad spend, it does not replace first-party pixel attribution (Triple Whale’s Triple Pixel, Polar’s server-side pixel) or iOS 14.5-compensated multi-touch attribution. What it does replace is the $300-$1,020 per month baseline reporting subscription — freeing that budget for actual ad spend, inventory, or product development.
Which e-commerce platforms does this work with?
Any platform that exports orders to CSV — which is effectively all of them. Tested with Shopify, WooCommerce, BigCommerce, Magento, Wix, Squarespace Commerce, Etsy, Amazon Seller Central (Business Reports), Walmart Marketplace, and eBay. The dashboard is platform-independent because it works off the normalized data sheet, not a live platform connection.
What data fields do I need to populate?
The data sheet expects: Date, Order ID, Product, Category, Sub-Category, Region, Lead Source, Gross Sales, Discount Amount, Shipping Cost, Tax, COGS. Every Shopify, WooCommerce, BigCommerce, and Magento export includes the core fields; Lead Source typically requires a UTM parameter capture or a marketing-channel tag in your order metadata. For Amazon and Etsy, Region is usually derived from the shipping address and Lead Source is typically a single value per platform.
How accurate is the Profit Margin % calculation?
Exactly as accurate as your COGS input. The formula is straightforward: Profit Margin % = (Net Sales – COGS – Shipping Cost) / Net Sales. If your COGS is accurate to the penny, so is your margin. If your COGS is stale or estimated, your margin will be directionally correct but not audit-accurate. Most e-commerce operators find that tightening their COGS data for this dashboard produces better decisions regardless of which reporting tool they use downstream.
Can I use this for multi-store or multi-brand reporting?
Yes — either paste multiple stores’ data into a single data sheet with a Store column added, or maintain separate copies of the workbook per store. For portfolio holding companies managing 3-15 Shopify brands, the single-workbook multi-store approach works well. For 15+ brands, consider upgrading to a proper BI tool like Glew or Polar Analytics.
Does it work offline?
Yes — it’s a standard .xlsx file. No internet connection required, no account required, no cloud sync required. Store it on your local drive, OneDrive, Google Drive, Dropbox, or a shared network folder. Your data never leaves your control unless you share the file.
Can I customize the charts, colors, and KPIs?
Yes — everything is unlocked. Common customizations include: updating chart colors to match brand guidelines, replacing Profit Margin % with Contribution Margin, adding AOV (Average Order Value) as a headline KPI, and adding a Returns/Refunds adjustment row to Net Sales. Most e-commerce operators customize the color palette within the first hour of use.
How does this compare to Shopify Analytics or Shopify Analytics Plus?
Shopify Standard Analytics (included with every Shopify plan) gives surface-level revenue and traffic metrics. Shopify Analytics Plus (bundled with Shopify Plus at $2,300+/month) adds deeper cohort and attribution features. This Excel dashboard sits between the two — more depth than Standard Analytics (specifically at product profitability, regional margin, and lead source ROI), less depth than Plus (no real-time refresh, no multi-touch attribution, no native LTV cohorts). For a Shopify merchant on the $39 Basic or $105 Standard plan, this dashboard fills exactly the visibility gap that makes many of them otherwise consider upgrading to Plus.
What if I’m using headless Shopify or a custom commerce stack?
As long as you can export order-level data to CSV (which every commerce backend supports), this works. For headless stacks built on Shopify Hydrogen, BigCommerce Stencil, or custom Next.js + Stripe architectures, a nightly CSV dump from your order database is a standard engineering task — and the dashboard consumes the output directly.
When should I actually upgrade to Triple Whale or Polar Analytics?
Signals it’s time to graduate: (1) you’ve crossed roughly $1M in annual GMV and Meta/Google/TikTok ad spend is >$10,000/month — attribution accuracy directly affects budget allocation, (2) you need iOS 14.5-compensated first-party pixel data, (3) you’re running >3 sales channels and weekly CSV consolidation is taking more than 2-3 hours, (4) cohort-based LTV analysis is driving acquisition strategy decisions, or (5) you have an in-house data team that wants Snowflake warehouse access. At that point, Triple Whale or Polar Analytics become legitimate investments. Below those thresholds, this dashboard usually outperforms the subscription in cost-to-value.
Read the Full Blog Post on PK: An Excel Expert
For a detailed walkthrough of each sheet, chart construction tips, and real-world e-commerce operator use cases, read the full guide on our Excel expertise blog: Sales Dashboard For Online Store in Excel — Full Guide.
Watch the Walkthrough Video
See the dashboard in action — Overview page, Product Performance drill-down, Lead Source analysis, Region comparison, and Monthly Trends:
🎥 Subscribe to YouTube.com/@PKAnExcelExpert for weekly Excel dashboard walkthroughs for e-commerce operators, finance teams, and business analysts.
Ready to replace your $300/month analytics subscription with a $17.99 Excel dashboard?
Download the Sales Dashboard For Online Store in Excel — one-time $17.99, 5-sheet analytical workbook covering gross sales, net sales, profit margin, product profitability, lead source ROI, regional analysis, and monthly trends.



























Reviews
There are no reviews yet.