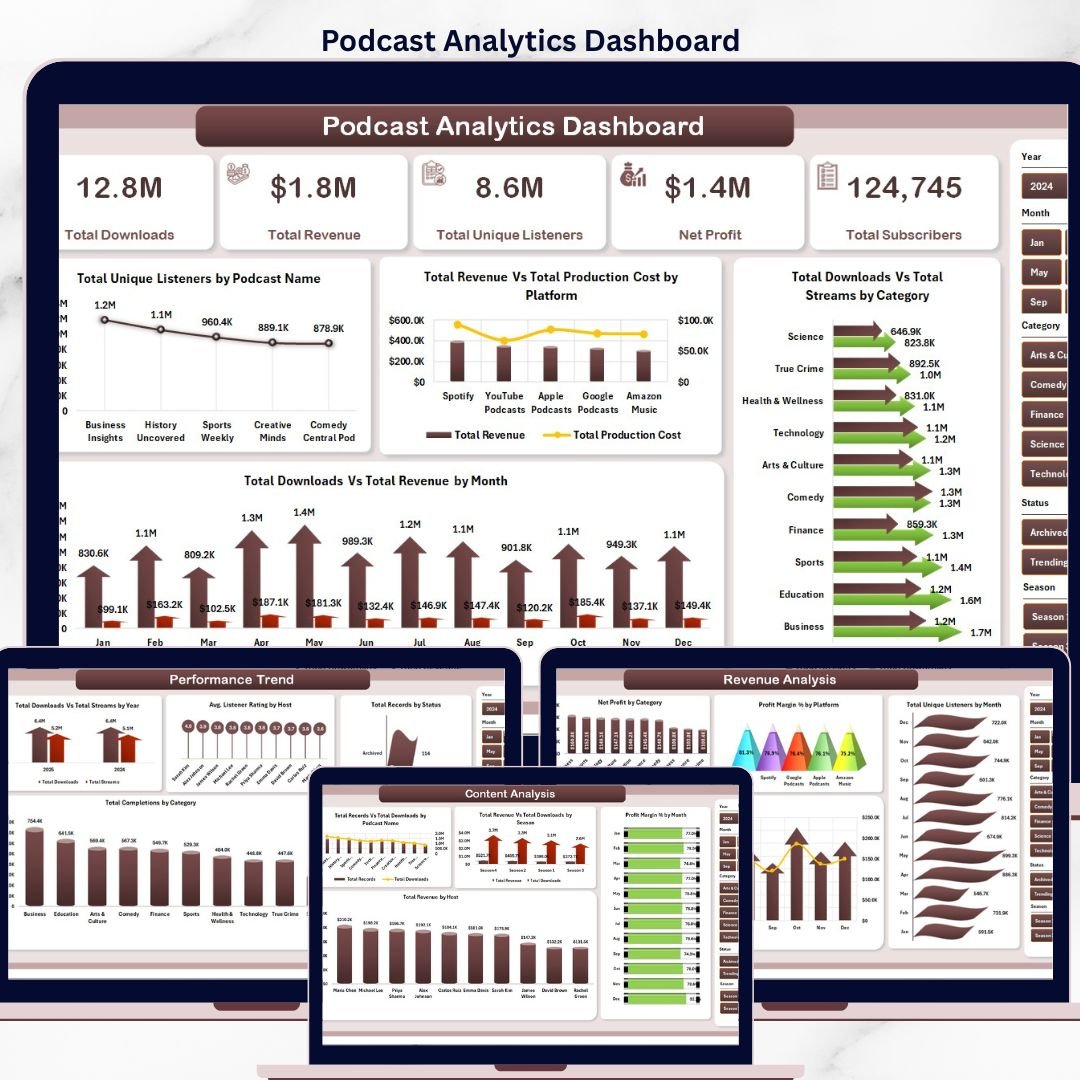
The Podcast Analytics Dashboard in Excel tracks 5 interactive pages with 20+ analytical charts and 5 headline KPI cards covering Total Downloads, Total Revenue, Total Unique Listeners, Net Profit, and Total Subscribers. Setup takes under 10 minutes — replace the sample data in one sheet and every chart, pivot table, and filter updates automatically.
🌍 Join 8,400+ teams in 40+ countries using NextGenTemplates to replace paid podcast analytics SaaS tools with one-time-purchase Excel, Google Sheets, Power BI, and HTML templates.
✅ Instant download · One-time payment · No subscription · No per-user fees · Lifetime access
Podcast Analytics Dashboard
🔑 Key Features of the Podcast Analytics Dashboard in Excel
🔹 5 interactive report pages — Overview, Audience Insights, Revenue Analysis, Performance Trend, and Content Analysis, each with its own chart set and filter panel.
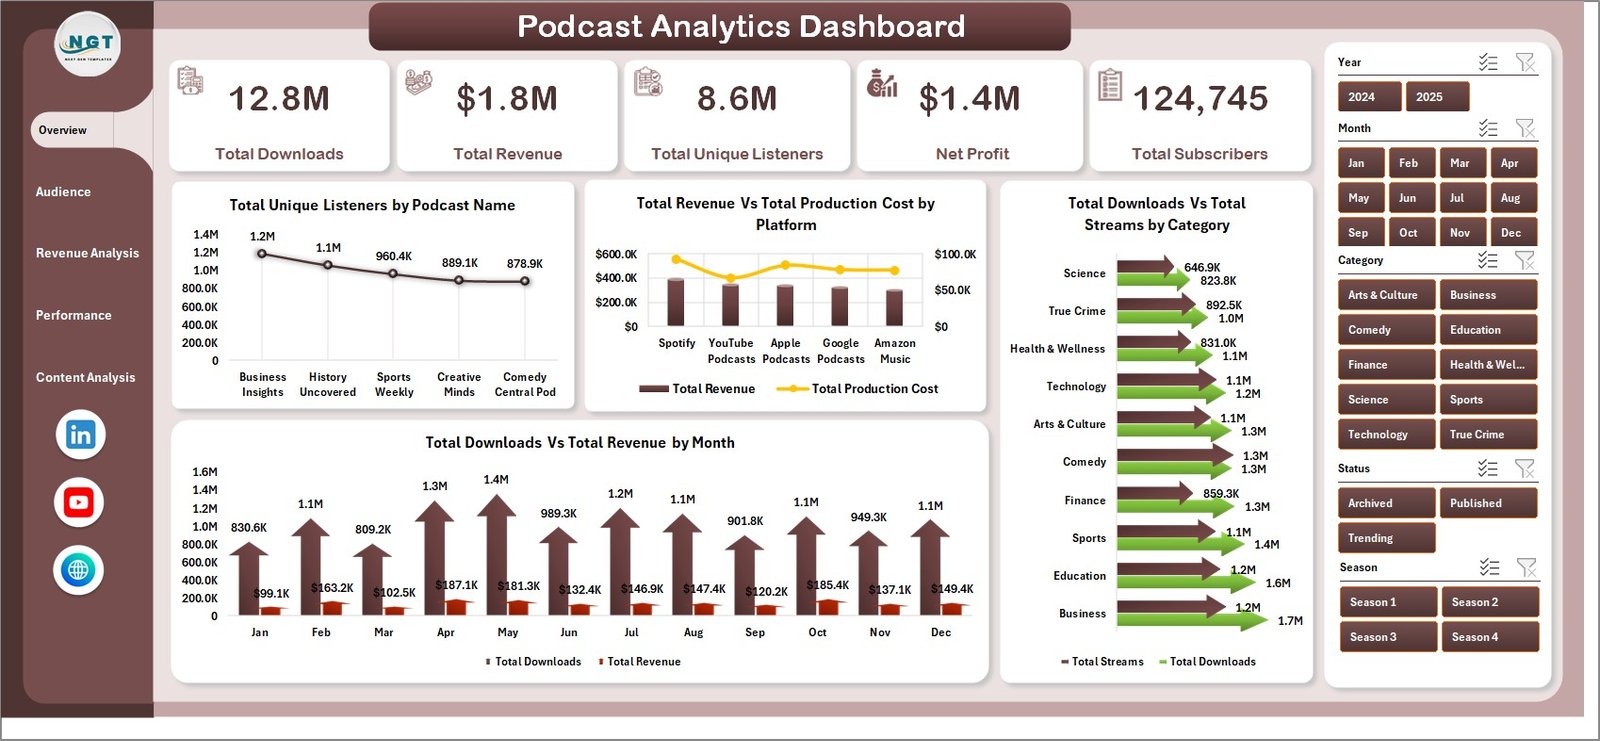
🔹 5 headline KPI cards on the Overview page — Total Downloads, Total Revenue, Total Unique Listeners, Net Profit, and Total Subscribers update in real time as filters are applied.
🔹 Pivot-driven architecture — every chart is backed by a pivot table on the Support Sheet, so a single Refresh All recalculates the entire dashboard in seconds.
🔹 Multi-dimension slicers on platform, category, podcast name, host, season, and month let you drill into any segment without writing formulas.
🔹 Revenue vs. cost visibility across platforms and podcasts using side-by-side comparison charts that expose profit margin leakage by episode and by channel.
🔹 Structured data sheet with locked column headers — paste your own export from Spotify for Podcasters, Apple Podcasts Connect, or YouTube Studio into the same format and refresh.
📦 What’s Inside the Podcast Analytics Dashboard in Excel
1. Overview Page — the landing view with 5 KPI cards (Total Downloads, Total Revenue, Total Unique Listeners, Net Profit, Total Subscribers) and 4 summary charts:
🔹 Total Unique Listeners by Podcast Name — identifies which shows attract the largest distinct audience.
🔹 Total Revenue Vs Total Production Cost by Platform — exposes which distribution platforms deliver positive margin and which ones burn budget.
🔹 Total Downloads Vs Total Streams by Category — compares download-first vs. stream-first consumption patterns per content category.
🔹 Total Downloads Vs Total Revenue by Month — a dual-series trend that shows whether download growth is converting into revenue growth month-over-month.
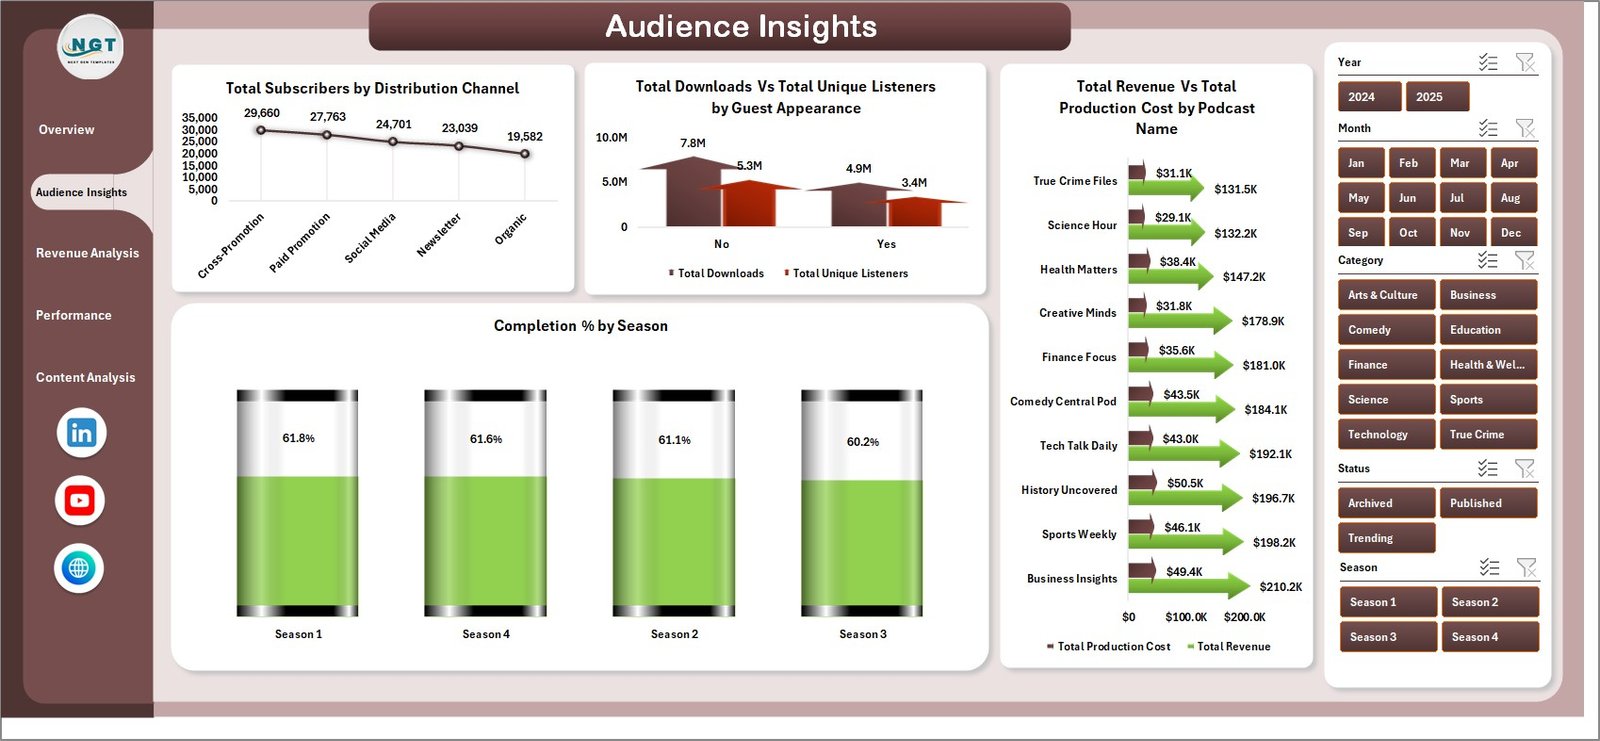
Audience Insights
2. Audience Insights — 4 analyses that profile who is listening and how deeply they engage:
🔹 Total Subscribers by Distribution Channel — ranks channels by subscriber base so you know where to invest promotion budget.
🔹 Total Downloads Vs Total Unique Listeners by Guest Appearance — quantifies the lift each guest brings to both reach and unique audience size.
🔹 Total Revenue Vs Total Production Cost by Podcast Name — a show-by-show profitability view to decide which formats to double down on.
🔹 Completion Percentage by Season — season-level listen-through rate that signals format fatigue or improvement.
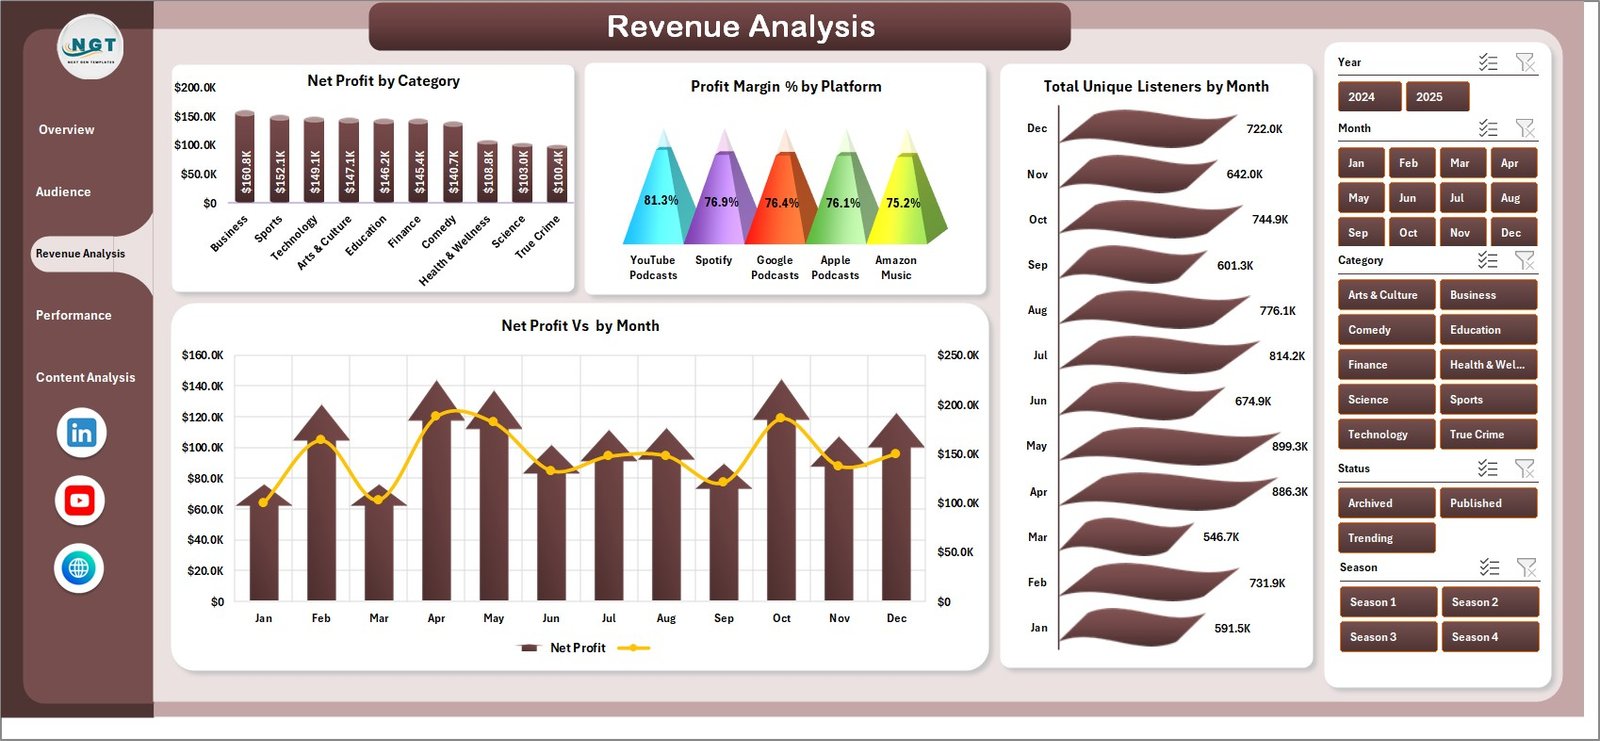
Revenue Analysis
3. Revenue Analysis — 4 charts focused on monetization efficiency:
🔹 Net Profit by Category, Profit Margin Percentage by Platform, Total Unique Listeners by Month, and Net Profit by Month — together these reveal whether your monetization curve is scaling with audience growth.
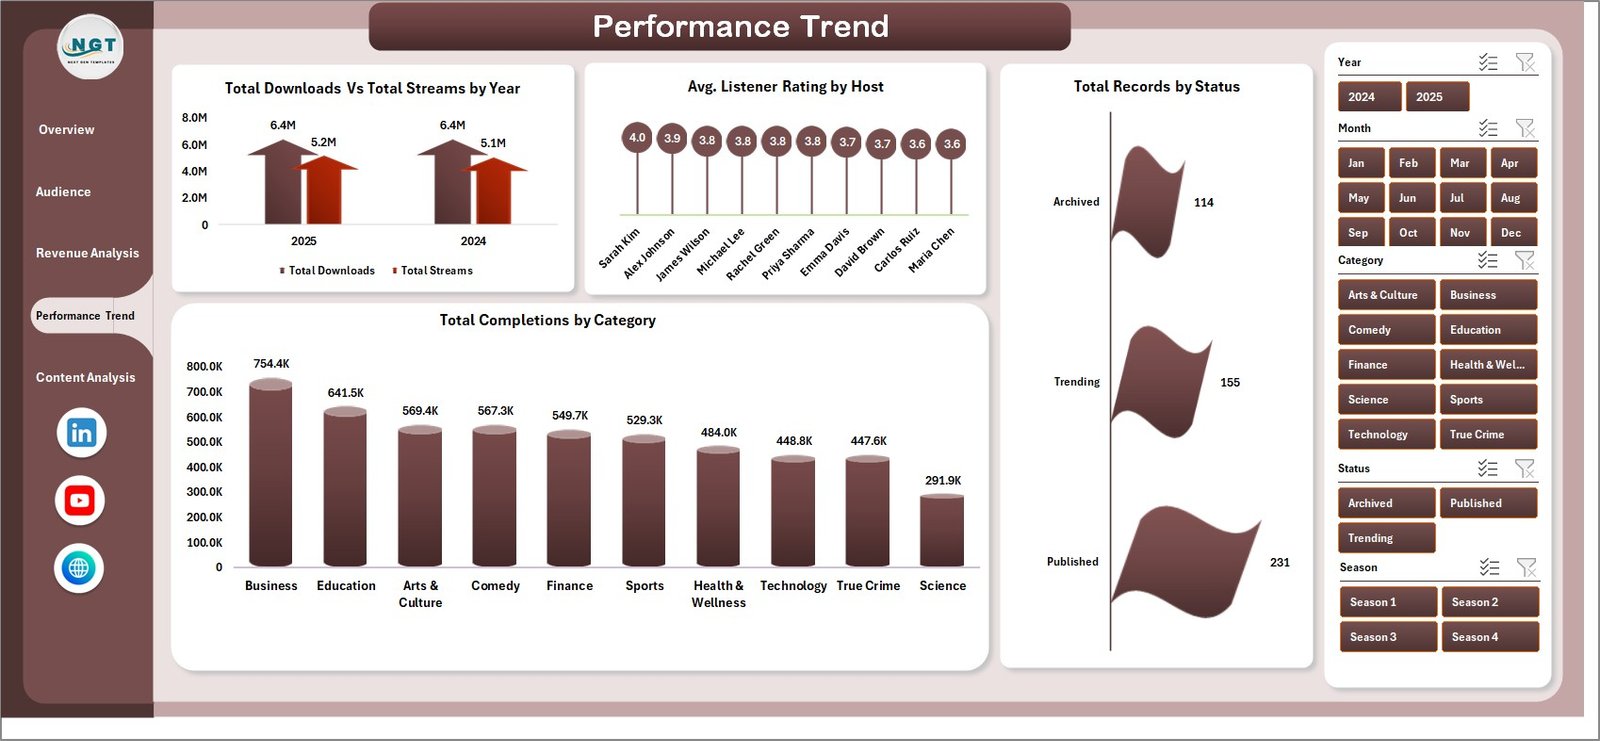
Performance Trend
4. Performance Trend — 4 analyses for long-term operational review:
🔹 Total Downloads Vs Total Streams by Year, Avg Listener Rating by Host, Total Records by Status, and Total Completions by Category — useful for yearly planning, host evaluation, and category greenlighting.
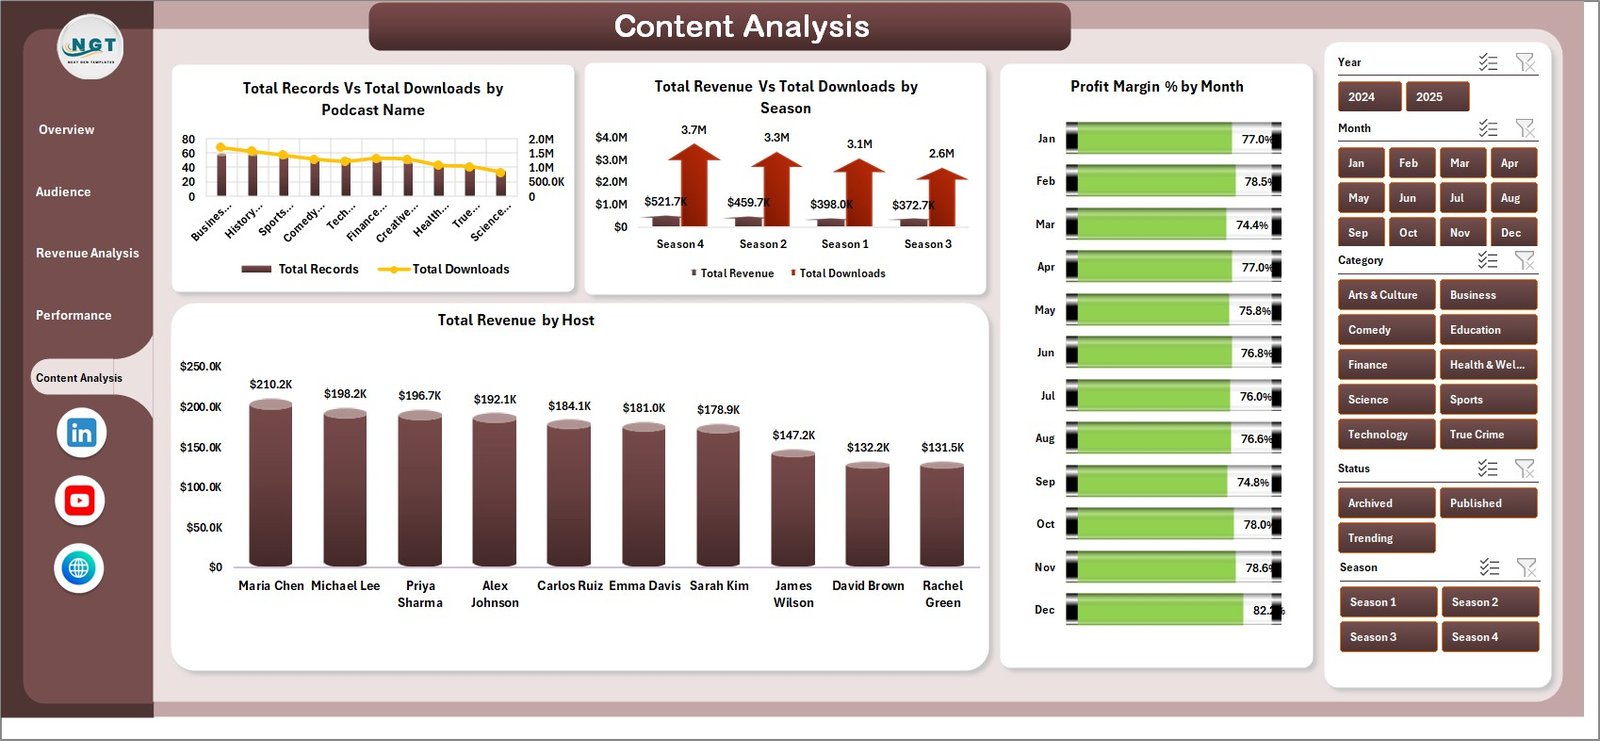
Content Analysis
5. Content Analysis — 4 editorial-focused charts:
🔹 Total Records Vs Total Downloads by Podcast Name, Total Revenue Vs Total Downloads by Season, Profit Margin Percentage by Month, and Total Revenue by Host — connects content output volume to commercial outcomes.
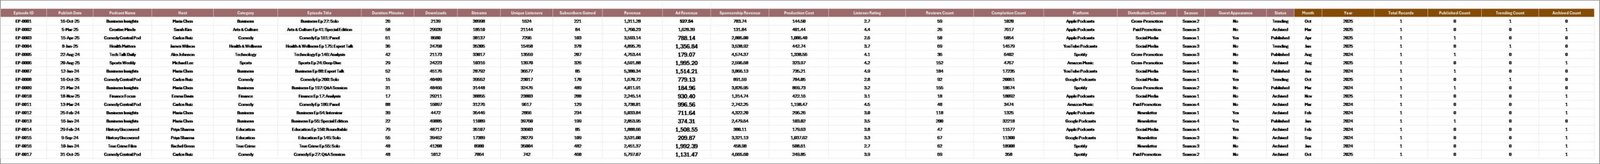
Data Sheet tab
6. Data Sheet tab — the structured input table. Paste your podcast export here in the same column format and every visual downstream updates.
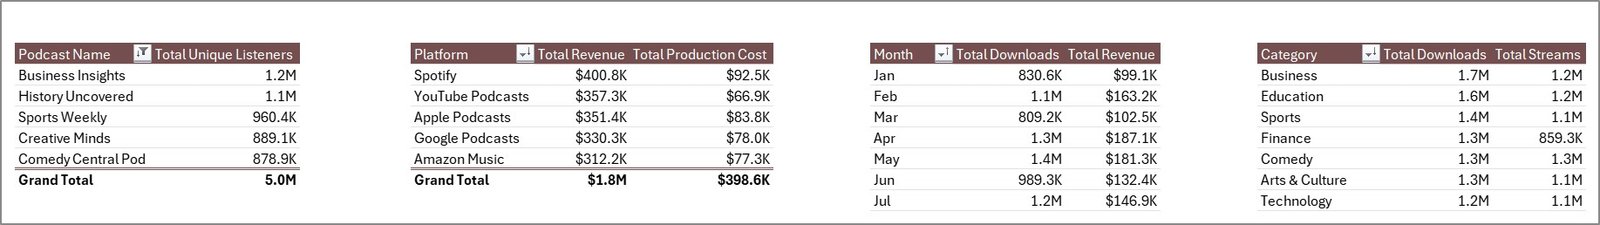
Support sheet tab
7. Support Sheet — all pivot tables that feed the dashboard live here. Click Data → Refresh All after updating the data sheet and every chart recalculates. This sheet can stay hidden in production.
👥 Who This Template Is For — and Who It’s Not For
✅ This template is built for:
- Independent podcasters running 1–10 shows who want one place to see downloads, revenue, and cost
- Podcast network operators managing a portfolio of hosts and seasons
- Agency account managers delivering monthly podcast performance decks to clients
- In-house content marketing teams at 20–500 person companies using a branded podcast for lead gen
- Finance controllers who want to tie podcast P&L into existing Excel workflows
❌ This template is NOT for:
- Networks needing real-time feed-level tracking with IAB-certified download dedupe (use Podtrac or ArtDetect)
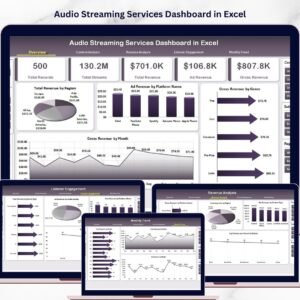
- Teams without Microsoft Excel — use the Audio Streaming Services Dashboard or a Google Sheets equivalent instead
- Podcasters who want fully automated API ingestion from Spotify/Apple (this template is paste-and-refresh)
⚙️ How to Use the Podcast Analytics Dashboard in Excel
- Download and unzip the file after purchase — the workbook opens in Excel 2016 or later.
- Open the Data Sheet tab and review the sample columns (platform, category, podcast name, host, season, downloads, streams, revenue, production cost, listener rating, completions, subscribers, unique listeners, month, year, status).
- Replace the sample data with your own export from Spotify for Podcasters, Apple Podcasts Connect, or YouTube Studio using the same column order.
- Go to the Data tab in the Excel ribbon and click Refresh All. Every pivot, chart, and KPI recalculates.
- Use the slicers on each page to filter by platform, category, host, season, or month.
- Optionally hide the Support Sheet before sharing the workbook with stakeholders.
💼 Real-World Use Cases
Maya runs a 3-show indie podcast network. Each Monday she pastes the week’s Spotify and Apple exports into the Data Sheet, hits Refresh All, and reviews which show had the highest Net Profit, which host pulled the best Avg Listener Rating, and which guest episodes drove the biggest download spike — all in under 15 minutes instead of the $99/month she used to pay a podcast analytics SaaS.
Rahul is a content marketing lead at a B2B SaaS company. He uses the Podcast Analytics Dashboard in Excel to report podcast ROI to his CMO, specifically the Total Revenue vs Total Production Cost by Platform chart to prove that the company’s YouTube podcast arm is outperforming the Spotify-only arm on margin.
Elena manages 12 client podcasts at a creative agency. She duplicates the workbook per client, feeds each one its own data, and uses the Completion Percentage by Season chart plus Profit Margin Percentage by Platform to frame her quarterly retention conversations.
❓ Frequently Asked Questions
What KPIs does the Podcast Analytics Dashboard in Excel track?
The Podcast Analytics Dashboard in Excel tracks 5 headline KPIs — Total Downloads, Total Revenue, Total Unique Listeners, Net Profit, and Total Subscribers — plus 20+ supporting analyses across platform, category, podcast name, host, season, and month dimensions.
How long does the Podcast Analytics Dashboard in Excel take to set up?
Setup for the Podcast Analytics Dashboard in Excel typically takes under 10 minutes. Replace the sample rows on the Data Sheet with your own podcast export data in the same column format, click Refresh All on the Data ribbon, and every chart and KPI updates automatically.
How does the Podcast Analytics Dashboard in Excel compare to Chartable or Podtrac?
The Podcast Analytics Dashboard in Excel is a one-time $17.99 purchase with full data ownership and fully editable charts. Chartable and Podtrac are subscription SaaS tools priced at $40–$300 per month that offer real-time feed tracking but lock your data inside their platform.
Do I need macros or VBA enabled for this Podcast Dashboard?
No. The Podcast Analytics Dashboard in Excel is built entirely with pivot tables, slicers, and native charts — no VBA or macros required. It opens cleanly in Excel 2016, Excel 2019, Microsoft 365, and Excel Online without security warnings.
Can I add my own custom charts to the Podcast Analytics Dashboard in Excel?
Yes. All pivot tables live on the Support Sheet and are unprotected. You can build additional pivots from the same Data Sheet, drop new charts onto any page, and connect them to the existing slicers by right-clicking the slicer and choosing Report Connections.
Where can I export my podcast data from to paste into this template?
The Podcast Analytics Dashboard in Excel accepts data exported from any podcast host. Common sources include Spotify for Podcasters, Apple Podcasts Connect, YouTube Studio, Buzzsprout, and Libsyn. The YouTube Studio analytics export guide explains how to download the raw CSV.
👤 About the Author
Built by PK — Microsoft Certified Professional with 15+ years of Excel, Google Sheets, and Power BI experience. Founder of NextGenTemplates, reaching 300K+ subscribers across YouTube channels (@PK-AnExcelExpert, @NextGenTemplates, @NeoTechNavigators). Every template is hand-built and tested before release.
🔗 Explore Related Templates
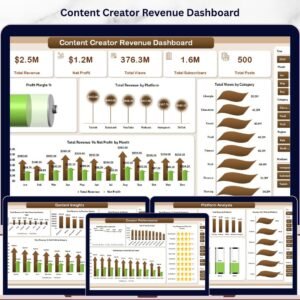
🔹 Content Creator Revenue Dashboard in Excel — Track monetization across YouTube, podcasts, sponsorships, and courses in one workbook.
🔹 YouTube Channel Analytics Dashboard in Excel — Dedicated YouTube channel performance tracker for creators also running video.
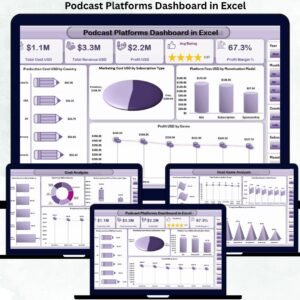
🔹 Podcast Platforms Dashboard in Power BI — The Power BI sibling of this dashboard for teams who prefer Power BI over Excel.
🔹 Audio Streaming Services Dashboard in Excel — Track Spotify, Apple Music, and streaming revenue alongside podcast performance.
🔹 Browse the complete Excel Dashboard Templates catalog for more role-specific dashboards.
📖 Click here to read the Detailed Blog Post
🎥 Visit our YouTube channel for step-by-step video tutorials
👉 YouTube.com/@NextGenTemplates
Watch the step-by-step video tutorial:


Reviews
There are no reviews yet.