The Monthly Sales Tracker and Report in Google Sheets is a ready-to-use cloud template that turns raw sales entries into a fully-formatted monthly performance report — target vs actual, revenue by product, revenue by region, revenue by rep, and visual charts — without a single formula to write. Open the template, copy it to your Drive, paste your sales data, and the report updates in real time. Works for B2B sales teams, e-commerce sellers, retail shops, field-sales managers, and any small business that runs monthly sales reviews.
Current price: $6.99 (regular $14.99 · save $8). Google Sheets file · opens in any browser · mobile-friendly · real-time collaboration · no Excel required.
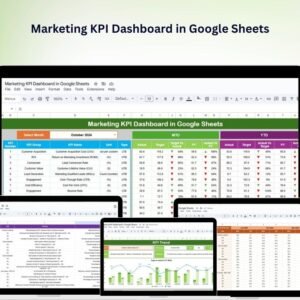
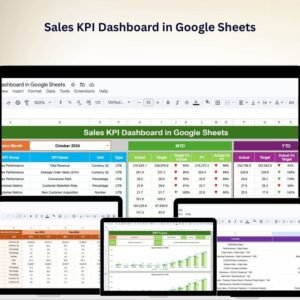
💡 Scaling up? Once your monthly tracker is live, the natural next step is a full Sales KPI Dashboard in Google Sheets ($12.99) with executive-level visuals, or the Sales Incentive Dashboard & Tracker ($9.99) if you pay commissions against these numbers.
What This Google Sheets Sales Tracker Does
This template automates the three jobs every sales manager repeats every month: capture the data, compare it to targets, and visualise the trend. Each is a separate tab wired together with Google Sheets formulas (QUERY, SUMIFS, and native charts) so your team only enters transactions — the report builds itself.
Who It’s Built For
- Sales managers at small and mid-sized companies running monthly sales reviews and 1:1s with reps.
- Small business owners and solopreneurs who need a simple P&L-style sales report without paying for Salesforce or HubSpot.
- E-commerce sellers on Shopify, Etsy, WooCommerce, or Amazon who want a consolidated monthly revenue view.
- Retail managers tracking daily/monthly store sales against targets.
- Field sales teams where each rep updates their numbers from mobile.
- Finance and FP&A analysts pulling monthly top-line numbers for board decks.
- Startup founders reporting MRR/ARR movement to investors in a lightweight monthly format.
Full Walkthrough — Page by Page
1. Sales Data Entry Sheet
Every sale is one row: Date, Customer, Product/Category, Rep/Region, Quantity, Unit Price, Revenue. Paste from Shopify/Amazon exports, CRM exports, or bank-transaction CSVs. The rest of the template pulls from this sheet — you never touch the report or chart tabs.
2. Monthly Sales Report (Target vs Actual)
The main report tab shows total sales for the selected month, target for the month, variance %, number of transactions, average order value, and top 5 products / regions / reps. Switch months using a dropdown — the whole report recalculates in under a second even at 10,000+ rows.
3. Visual Charts & Trend Analysis
Native Google Sheets charts render inline and update when you add new data:
- Monthly revenue trend — line chart comparing current year to prior year.
- Target attainment gauge — conditional colour from red (<80%) to green (>100%).
- Revenue by product / category — bar chart with top-N filtering.
- Revenue by rep / region — stacked bar or pie chart.
- Running YTD vs last-year YTD — comparison chart for pacing.
4. Targets & Goals Sheet
A dedicated settings tab holds monthly revenue targets, per-rep quotas, and per-region or per-product goals. Change a target here and every variance calculation across the report updates instantly. No hunting for formulas buried in cells.
5. Customisable Categories & Fields
Add columns to the Data sheet (e.g., Campaign, Lead Source, Channel, Discount %, Margin) and the report auto-picks them up. The template uses open columns and named ranges so extending it doesn’t break formulas — ideal for growing teams that add new analytical dimensions over time.
Google Sheets vs Excel vs Paid CRM — Where This Template Fits
If you’re comparing sales-tracking options, here is the practical trade-off:
| Feature | Monthly Tracker (this) | Excel Sales Dashboard | Paid CRM (HubSpot / Salesforce) |
|---|---|---|---|
| Cost | $6.99 one-time | $14–$18 one-time | $25–$150 / user / month |
| Platform | Google Sheets (browser) | Microsoft Excel | Vendor cloud |
| Real-time team collaboration | ✅ | Limited (shared file) | ✅ |
| Mobile entry from field | ✅ (Sheets app) | Limited | ✅ |
| Setup time | < 5 minutes | 10–15 minutes | Weeks (implementation) |
| Customisable fields | ✅ fully | ✅ fully | Limited without admin |
| Share with a link | ✅ (native) | Via OneDrive | Requires licence |
| Year-1 cost at 5 users | $6.99 | $15–$18 | $1,500–$9,000 |
For teams that want real-time collaboration without paying a per-user CRM fee, Google Sheets sits in the sweet spot — and this template gives you the structure that raw Google Sheets lacks.
How to Set It Up in Under 5 Minutes
- Download the PDF guide from your order page — it contains the “Make a copy” link.
- Click the link and Google Drive prompts you to make your own copy. Rename it (e.g., “FY2026 Sales Tracker”).
- Open the Targets sheet and type in your monthly revenue targets for the year.
- Paste your sales history into the Data sheet (or connect a CSV export from your CRM / e-commerce platform).
- Open the Monthly Report — your target vs actual, top products, and trend charts are already populated.
Full video walkthrough is embedded at the bottom of this page, and the written step-by-step blog tutorial is on NeoTechNavigators.
Why Buyers Choose This Template
🚀 Zero setup friction — one click in Google Drive and you are live. No software install, no account signup, no SaaS subscription.
📊 Real-time charts — every tile updates as your team enters sales; live-share the report link in Slack / Teams / WhatsApp.
🎯 Target vs actual built in — variance %, attainment colour coding, and top-performer view without writing a formula.
📱 Mobile-ready — field reps update from the Google Sheets mobile app; managers review from any browser.
🔒 Your data stays in your Google Drive — no third-party vendor holds your revenue data.
💾 Lifetime access — buy once, re-copy the template anytime from your account.
Companion Templates — Sales Stack in Google Sheets
The Monthly Sales Tracker is the foundation. Once it’s running, most customers layer these companions on top:
Dashboards & Deep Analytics
- Sales KPI Dashboard in Google Sheets — executive-level KPI view with 15+ sales metrics ($12.99)
- Sales Performance Management Dashboard — multi-rep performance analytics ($6.99)
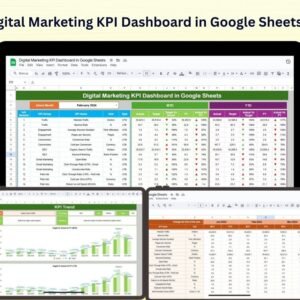
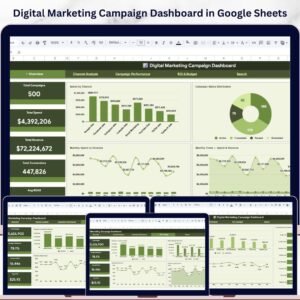
- Marketing Dashboard in Google Sheets — pair sales outcomes with marketing spend ($9.99)
- CRM KPI Dashboard in Google Sheets — pipeline, conversion, and activity KPIs ($12.99)
Daily & Transactional Trackers
- Sales Order Tracker in Google Sheets — order-level tracking with status pipeline ($6.99)
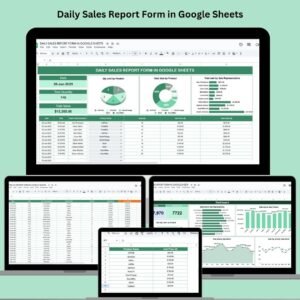
- Daily Sales Report Form in Google Sheets — rep-level daily reporting form ($6.99)
- E-Commerce Sales Performance Tracker — online-store focused tracker ($6.99)
Incentives, Commissions & Retail
- Sales Incentive Dashboard & Tracker — incentive plan and payout tracker ($9.99)
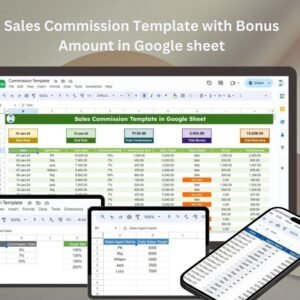
- Sales Commission Template with Bonus — commission engine with tiered bonuses ($6.99)
- Retail Dashboard in Google Sheets — store-level KPIs and footfall ($9.99)
Want the Excel or Power BI Version?
- Sales Dashboard in Excel — desktop version for Excel-first teams ($17.99)
- Sales Tracking Dashboard in Excel — VBA-powered sales system ($17.99)
- Sales KPI Dashboard in Power BI — enterprise analytics ($11.99)
Browse More
All Google Sheets Sales & Marketing Templates · All Google Sheets Dashboards · All Google Sheets Trackers
Frequently Asked Questions
What is the Monthly Sales Tracker and Report in Google Sheets?
It is a pre-built Google Sheets template with linked Data, Targets, and Report tabs. You paste transactions into the Data sheet, set your targets once, and the monthly sales report rebuilds itself — target vs actual, variance, top products, top reps, and trend charts. No formulas for you to write.
Do I need a paid Google Workspace account?
No. A free personal Google account works. The template opens in Google Sheets (free), lives in your Google Drive (free tier is 15 GB), and can be shared with anyone who has a Google account at no extra cost.
How do I get the template after purchase?
Your download is a short PDF guide containing a “Make a copy” link. Click the link, Google Drive asks you to create your own editable copy, and the file lands in your Drive. You own it from that point on — re-copy as many times as needed.
Can I use this for e-commerce sales (Shopify, Amazon, Etsy)?
Yes. Export your orders from Shopify, Amazon Seller Central, Etsy, or WooCommerce as CSV, open the CSV in Sheets, and paste the relevant columns into the Data sheet. The report tab auto-calculates revenue, target attainment, and top products. For a dedicated e-commerce focus, see our E-Commerce Sales Performance Tracker.
How many sales transactions can this template handle?
Google Sheets supports up to 10 million cells per file. In practice this template handles 10,000–30,000 monthly transactions without noticeable slowdown on modern browsers. For higher volumes or multi-year history, use the Excel version or Power BI version linked above.
Can multiple team members update it at the same time?
Yes — this is the main reason customers pick Google Sheets over Excel. Share the file with Edit access; every rep updates their rows simultaneously and the manager sees changes live. Use Sheets’ built-in comments and @mentions for follow-ups on specific cells.
Does it work on mobile?
Yes. Field reps can open the sheet in the Google Sheets mobile app (iOS / Android), scroll to their row, and enter today’s sales. Charts render on mobile too, so managers can review the monthly report from a phone during commute or client visits.
How is this different from the Sales KPI Dashboard?
The Monthly Sales Tracker is focused on monthly period reporting — one month at a time, target vs actual, top 5s, and trend. The Sales KPI Dashboard in Google Sheets ($12.99) is a broader KPI scorecard — 15+ sales KPIs (win rate, conversion rate, pipeline velocity, average deal size, etc.) across multiple time windows. Most teams start with the tracker and add the KPI dashboard as the sales org matures.
Can I customise the fields (region, product, channel, campaign)?
Yes. The template uses named ranges and open columns, so adding a Region, Product Category, Channel, or Campaign column on the Data sheet flows automatically through to the report. You can also change the default slicers in the report tab to segment by any column you choose.
Is there a refund if it doesn’t work for me?
Yes — contact us within 7 days of purchase for a refund if the template doesn’t match your needs. See our refund policy for details. Most customers get set up in under 10 minutes and keep it.


Reviews
There are no reviews yet.