

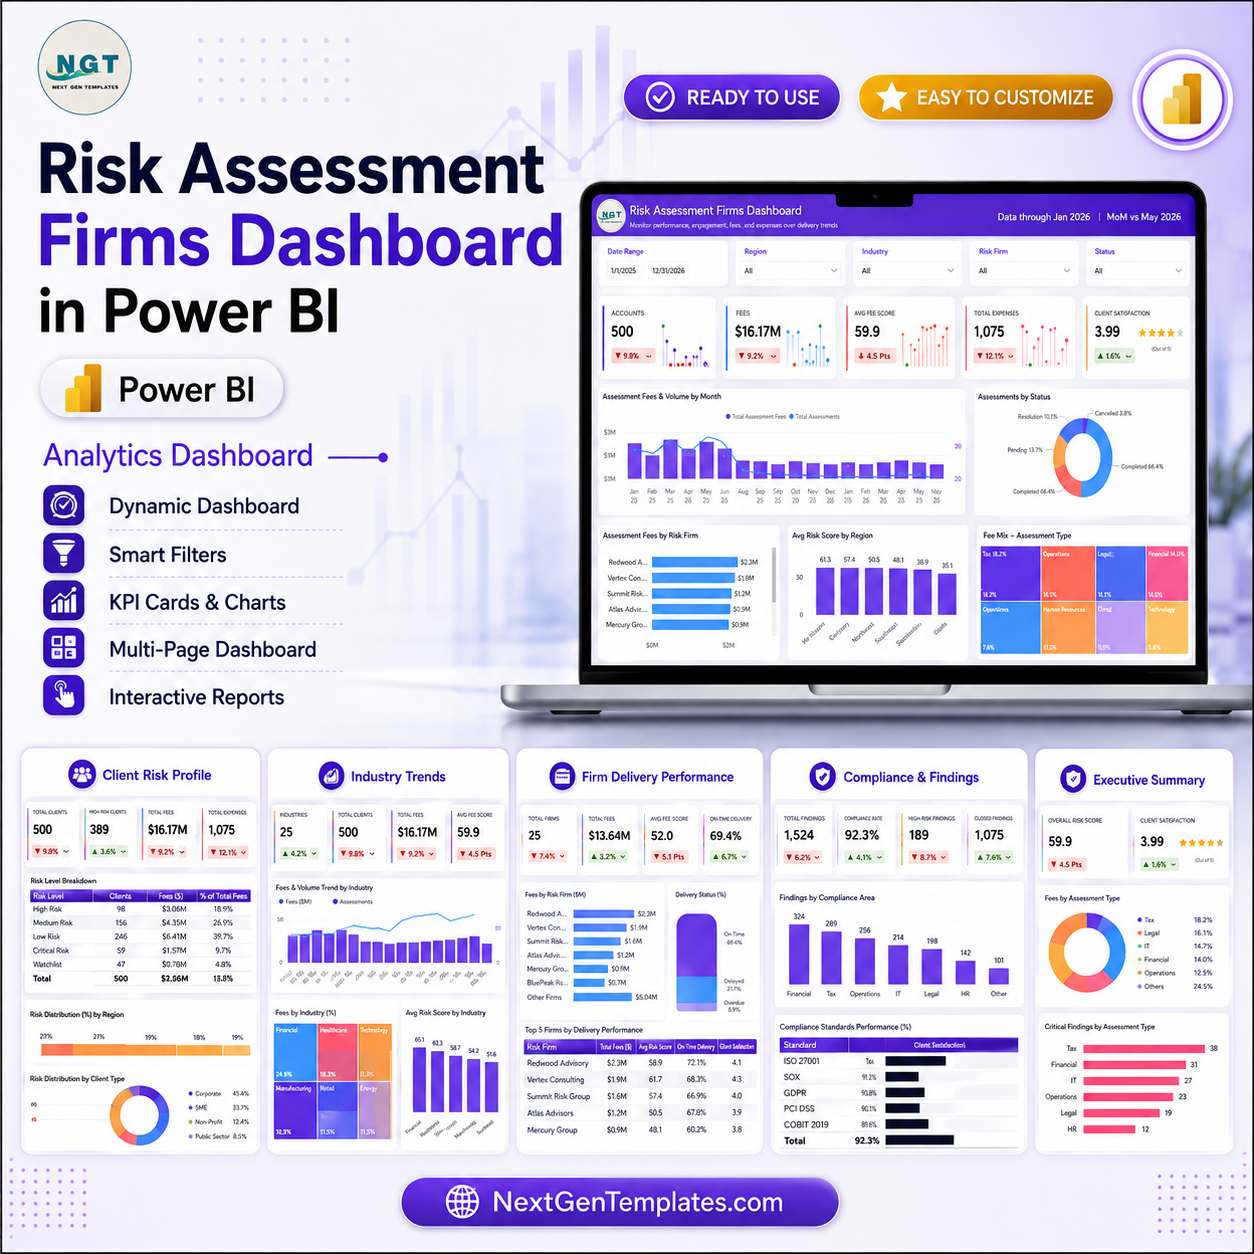
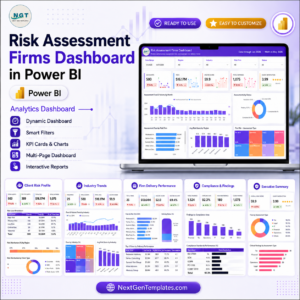
Last updated: August 5, 2026. Risk teams are under pressure to explain findings, remediation cost, client exposure, and delivery quality without waiting for a custom BI project. The Risk Assessment Firms Dashboard in Power BI gives consulting firms, audit teams, compliance analysts, GRC managers, and partner-level reviewers a 5-page PBIX report for tracking assessments, assessment fees, average risk score, critical findings, satisfaction, remediation cost, standards coverage, firm performance, and client risk patterns. Built by PK for a 300K+ subscriber learning audience, this is a one-time downloadable Power BI template with editable pages, measures, visuals, and slicers.
Key Features of Risk Assessment Firms Dashboard in Power BI
- 5 Power BI pages: Overview, Client Risk Profile, Industry Trends, Firm Delivery Performance, and Compliance and Findings.
- 5 KPI cards: Assessments, Assessment Fees, Avg Risk Score, Critical Findings, and Client Satisfaction.
- Risk and fee analysis: Review assessment volume, fees, risk score, remediation cost, findings, client profile, and satisfaction.
- Delivery performance views: Compare analyst hours, firm yield, and delivery scorecard results.
- Compliance coverage: Track standards, priority, critical finding rate, and compliance scorecard metrics.
What’s Inside the Risk Assessment Firms Dashboard in Power BI
Overview Page
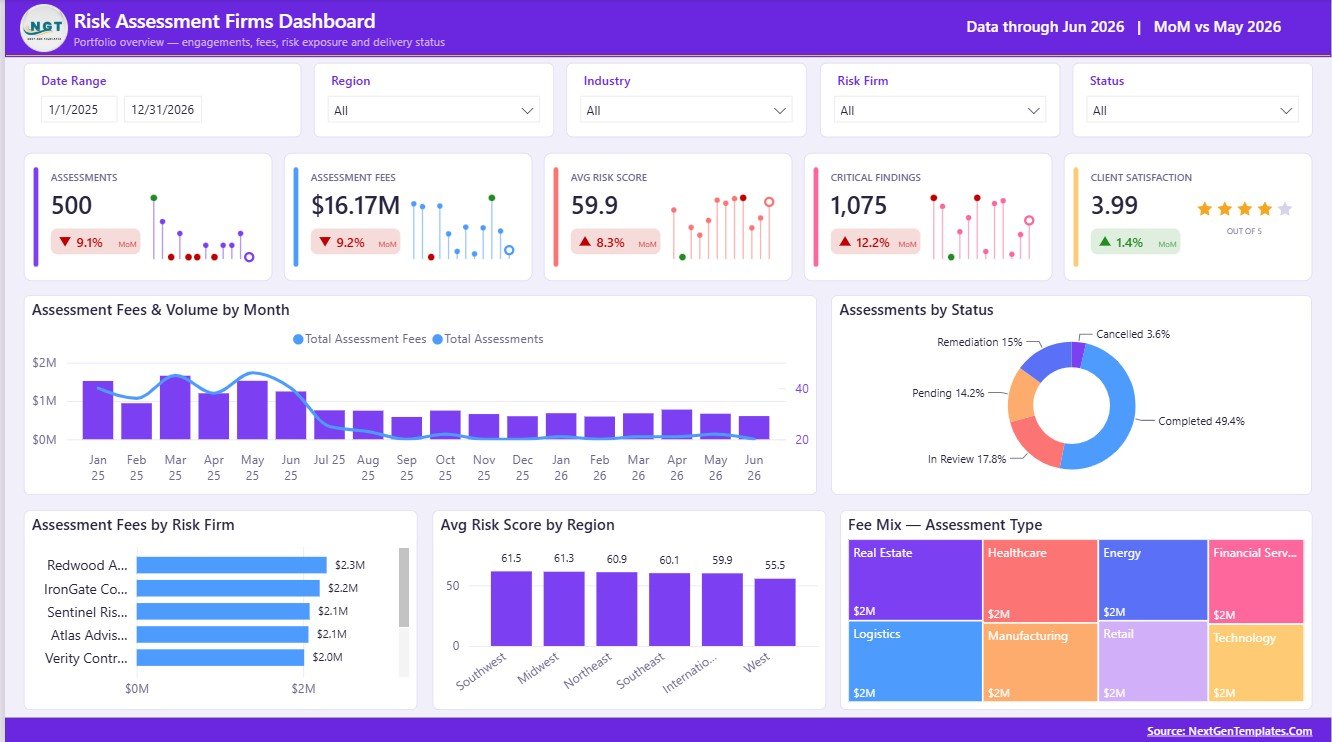
The Overview page gives decision-makers a high-level view of assessment activity and client risk. KPI cards summarize Assessments, Assessment Fees, Avg Risk Score, Critical Findings, and Client Satisfaction so users can review volume, revenue, risk, severity, and service experience together.
Assessment Fees and Volume by Month: This trend shows how fees and assessment count move over time. It helps partners spot seasonality, pipeline pressure, and months where revenue does not match workload.
Assessments by Status: This chart separates completed, active, pending, or similar workflow stages. It helps teams understand open workload and delivery progress.
Assessment Fees by Risk Firm: This visual compares fee contribution by firm. It helps leadership identify which risk firms or practice groups drive the highest billed assessment value.
Avg Risk Score by Region: This chart compares regional risk levels. It helps teams identify markets where clients may need deeper remediation planning or additional assessment coverage.
Fee Mix by Assessment Type: This visual breaks down fees by assessment type. It helps explain which service lines contribute most to total assessment revenue.
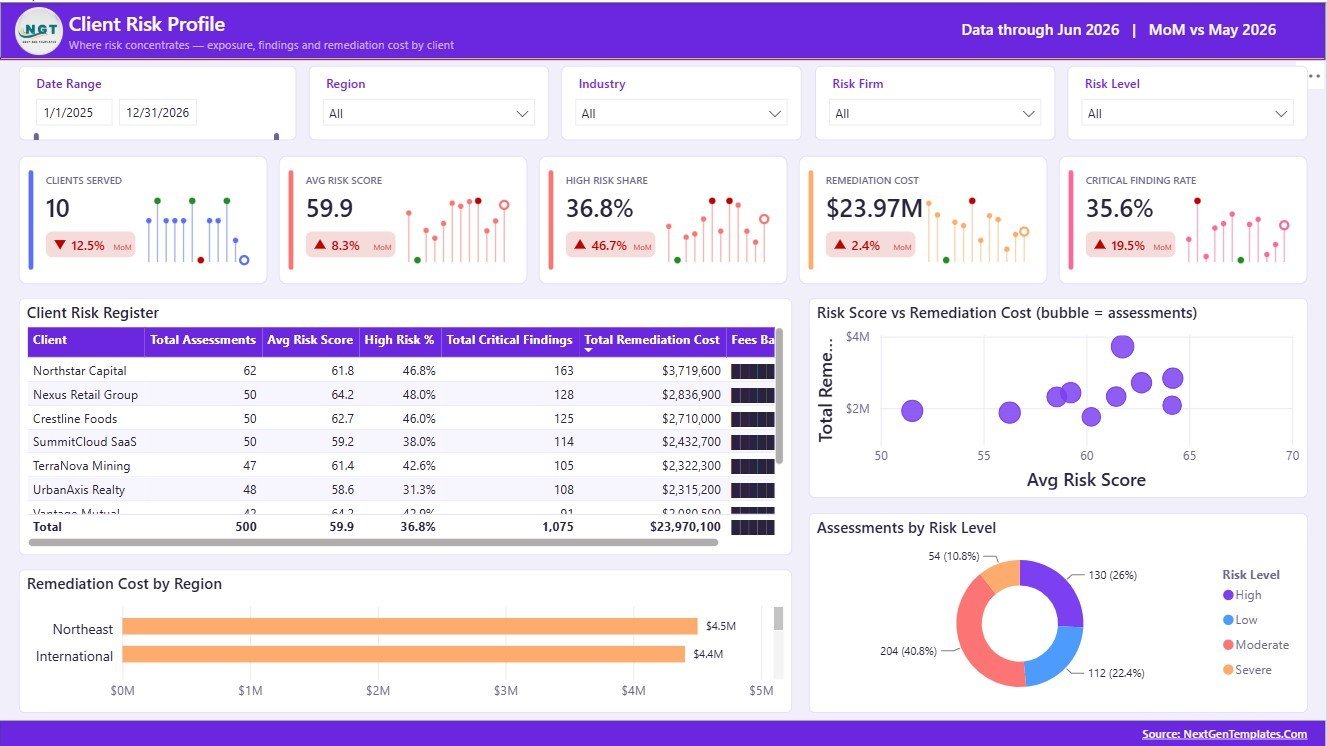
Client Risk Profile
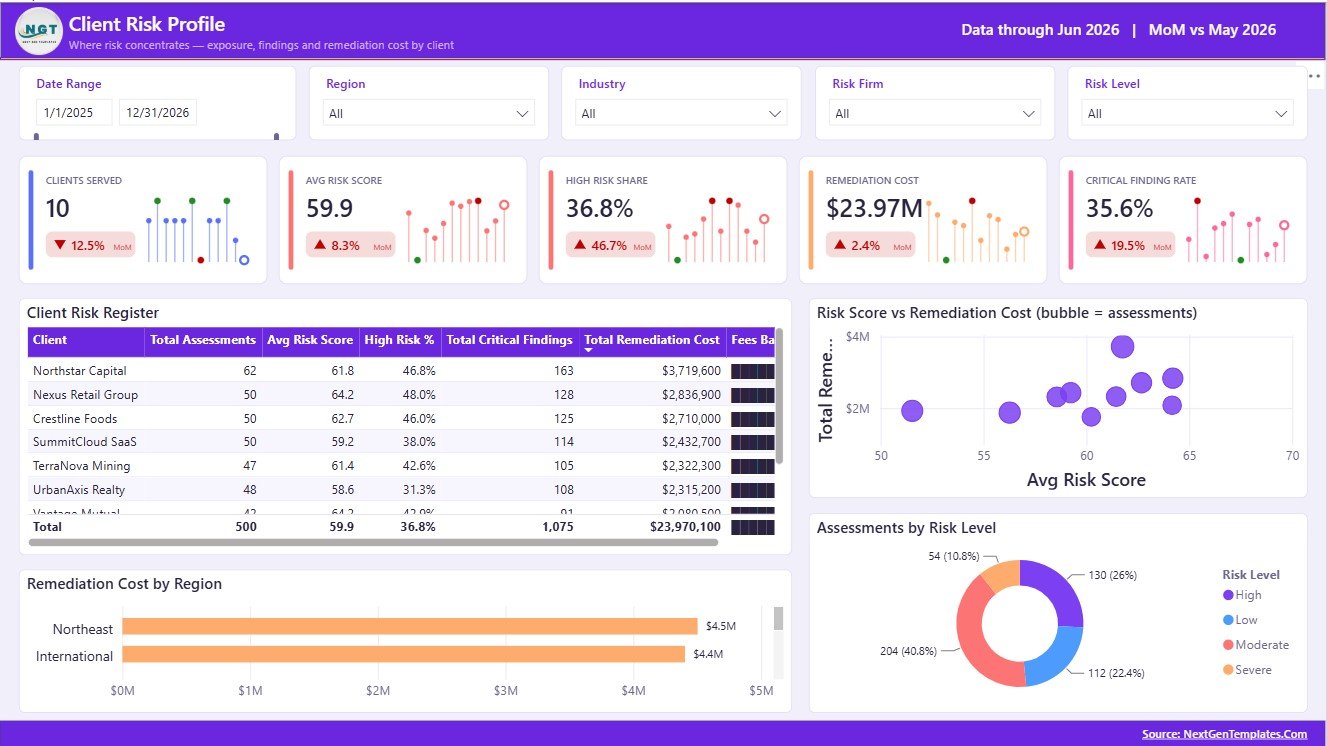
Client Risk Register by Client: This table-style view organizes each client with risk and assessment indicators. It is useful for client review meetings, follow-up prioritization, and account-level risk conversations.
Risk Score vs Remediation Cost by Assessment Volume: This scatter-style analysis connects risk score, remediation cost, and volume. It helps identify clients or segments where risk exposure is high and corrective action may be expensive.
Remediation Cost by Region: This chart compares expected remediation cost across regions. It helps leadership understand where compliance gaps may create the largest financial burden.
Assessments by Risk Level: This chart groups assessments into risk tiers. It helps users quickly see whether the current portfolio is weighted toward low, medium, high, or critical risk work.
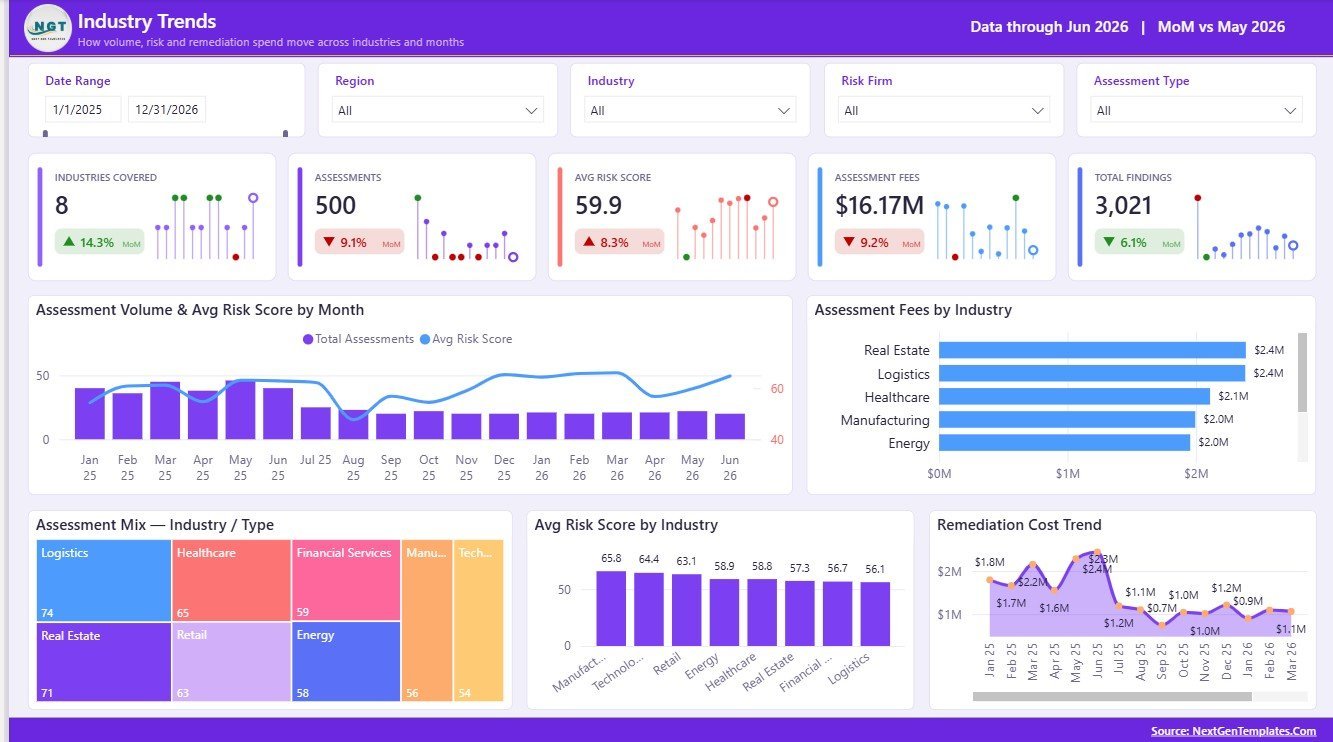
Industry Trends
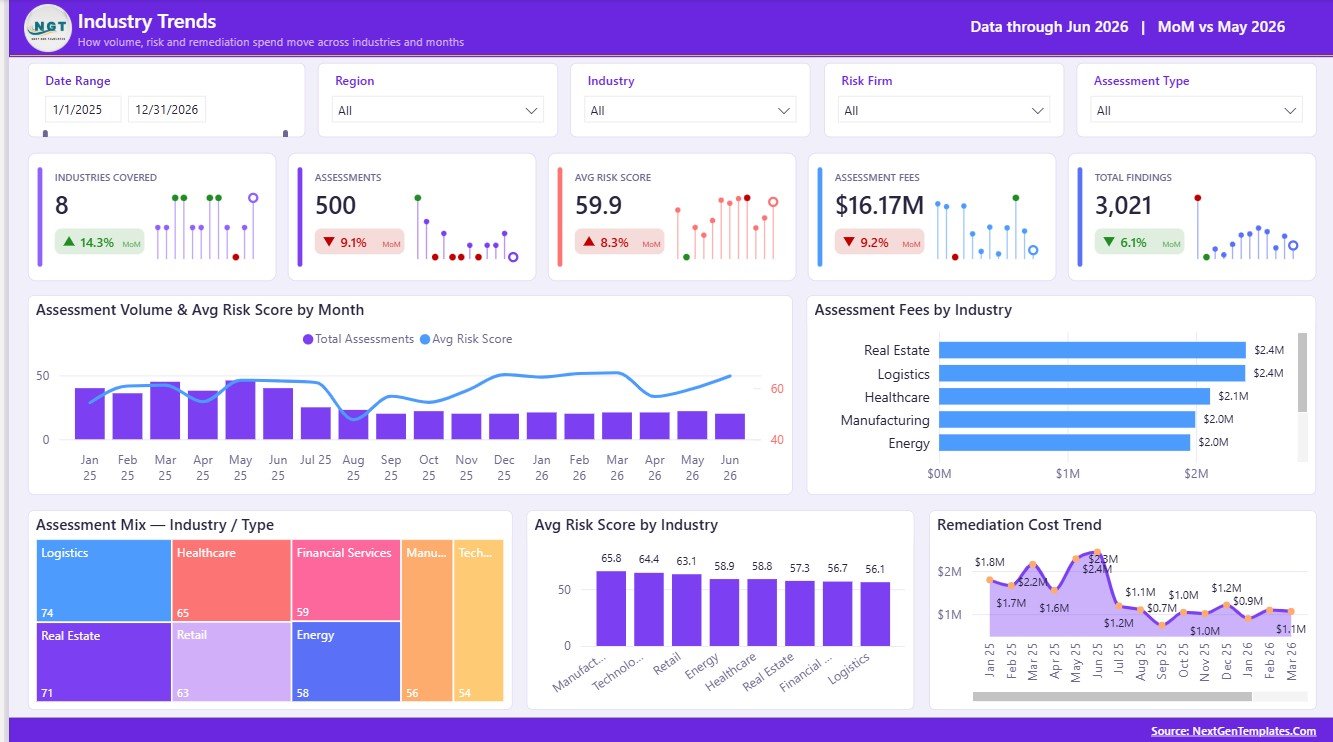
Assessment Volume and Avg Risk Score by Month: This view compares activity level with average risk score over time. It helps teams see whether busier months are also producing higher-risk findings.
Assessment Fees by Industry: This chart compares revenue by client industry. It helps firms understand which sectors are contributing the most assessment fees.
Assessment Mix by Industry and Type: This chart shows how assessment types vary across industries. It helps identify sector-specific demand for audits, controls, cyber, operational, or compliance assessments.
Avg Risk Score by Industry: This visual compares risk intensity by industry. It helps prioritize sector-specific advisory, remediation, and follow-up work.
Remediation Cost by Month: This trend shows how remediation cost changes over time. It supports budget discussions and helps spot periods with higher corrective action pressure.
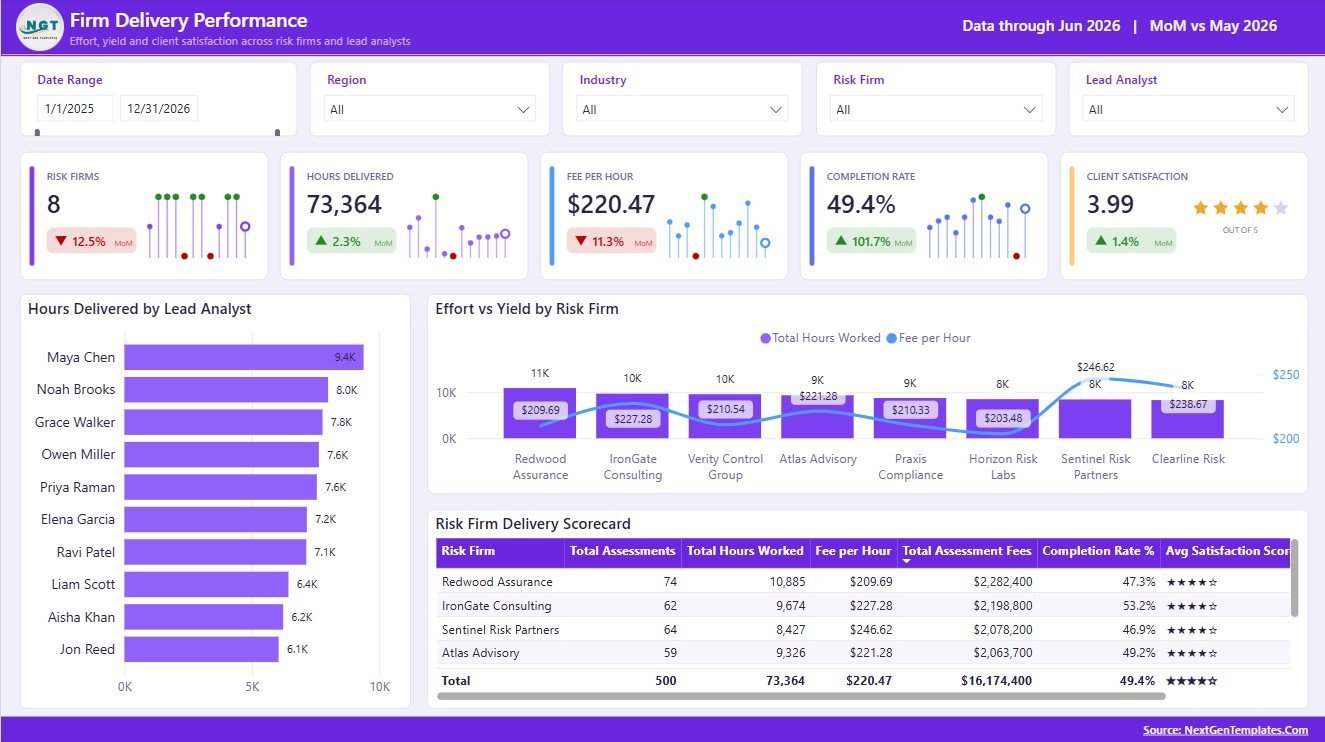
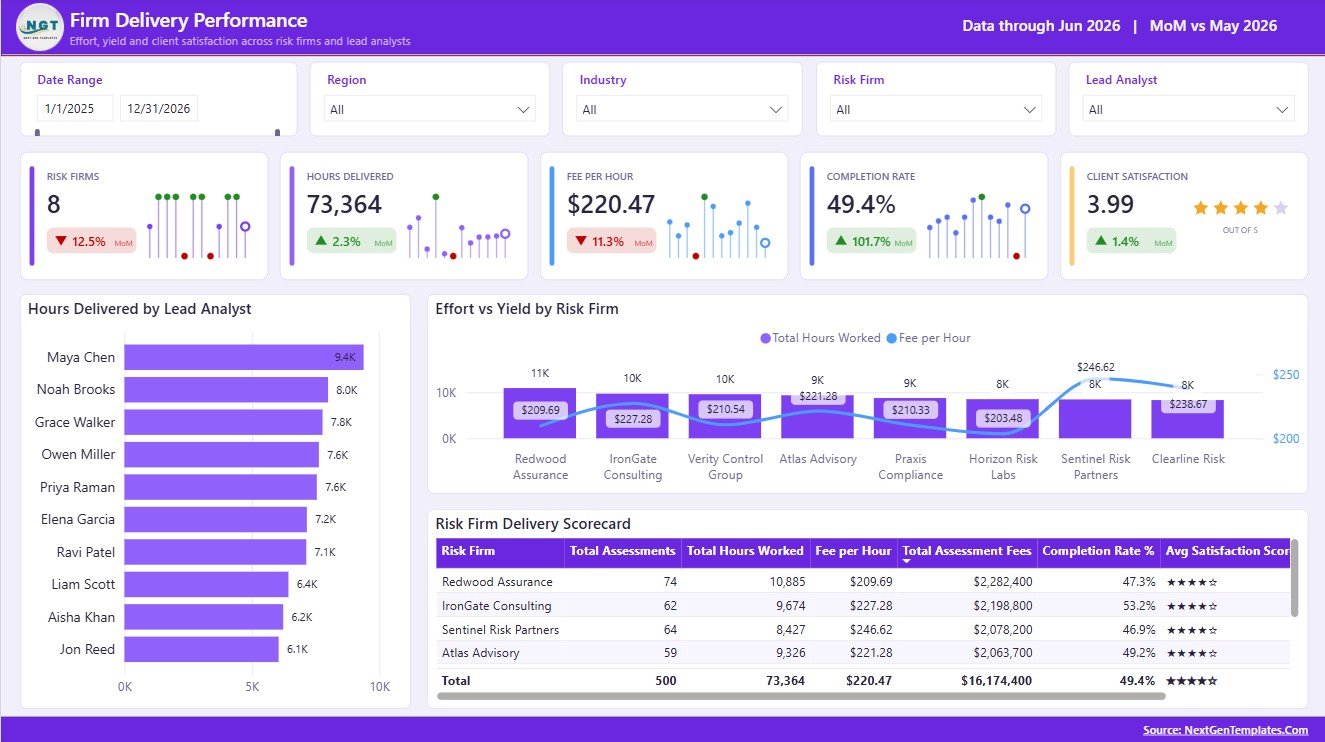
Firm Delivery Performance
Hours Delivered by Lead Analyst: This chart compares analyst effort. It helps managers balance workload, review utilization, and identify delivery bottlenecks.
Effort vs Yield by Risk Firm: This analysis compares delivery effort against fee or output yield. It helps leadership see which firms are efficient and which may need delivery process review.
Risk Firm Delivery Scorecard by Risk Firm: This scorecard gives a firm-level performance summary. It is useful for partner meetings, internal benchmarking, and recurring delivery reviews.
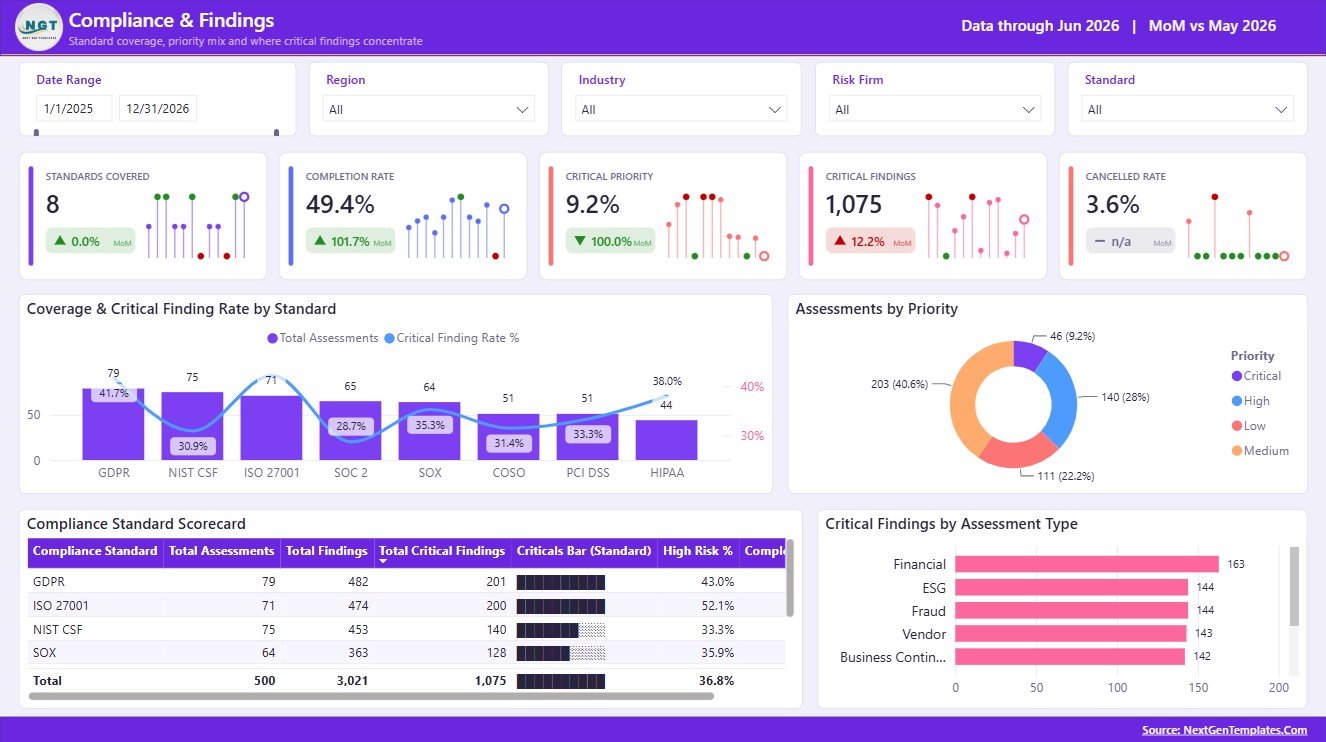
Compliance and Findings
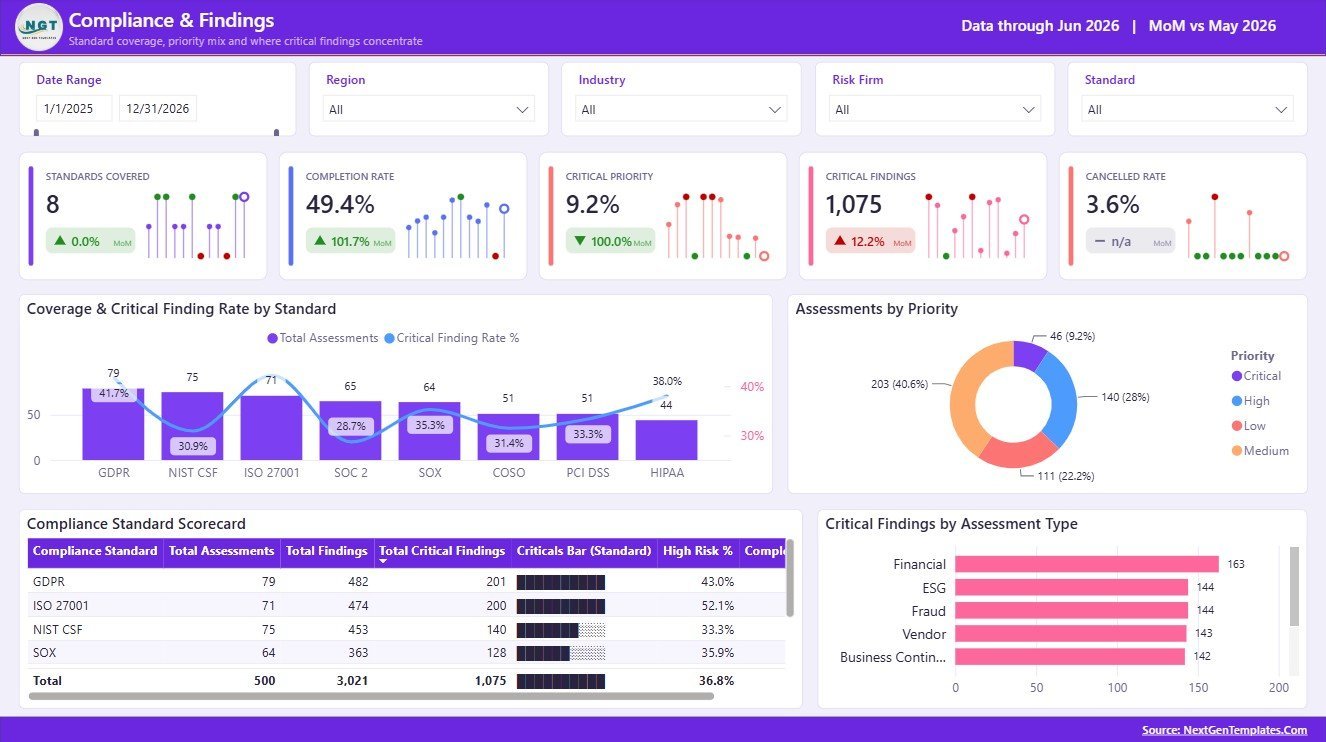
Coverage and Critical Finding Rate by Standard: This chart connects standard coverage with critical finding rate. It helps teams see whether certain standards require stronger control attention.
Assessments by Priority: This chart separates assessment workload by priority level. It helps leaders focus follow-up time on urgent and high-impact work.
Compliance Standard Scorecard by Compliance Standard: This scorecard summarizes performance by standard. It supports audit committees, GRC updates, and client compliance reporting.
Critical Findings by Assessment Type: This visual shows which assessment types produce the most critical findings. It helps firms improve scoping, staffing, and remediation guidance.
Risk Assessment Firms Dashboard in Power BI vs. Tableau vs. Paid GRC SaaS – Where This Fits
| Criteria | This Power BI template | Tableau or Qlik alternative | Paid GRC SaaS |
|---|---|---|---|
| Cost | $17.99 one-time sale price | License plus report build time | Recurring subscription or implementation pricing |
| Platform | Power BI Desktop and optional Power BI Service | Tableau, Qlik, or similar BI tool | Vendor-hosted GRC platform |
| Setup time | Open PBIX, replace data, refresh | Build model and visuals manually | Configuration, workflows, training, and rollout |
| Custom fields | Edit visuals, fields, relationships, slicers, and measures | Editable with analyst skills | Often limited by vendor configuration |
| Risk assessment reporting | Best for prepared assessment data | Best when the team already uses that BI stack | Best for live workflow and evidence management |
Who This Template Is For – and Who It’s Not For
This dashboard is for risk assessment firms, compliance consultants, internal audit teams, cyber risk reviewers, advisory partners, GRC analysts, client success managers, and Power BI developers who need a reporting layer for assessment records.
It is not a live audit management system, evidence collection portal, automated GRC workflow engine, document repository, ticketing system, or replacement for professional risk judgment. Use it when you need visual reporting, client-ready analysis, and editable Power BI pages.
How to Use the Risk Assessment Firms Dashboard in Power BI
- Download and unzip the product package.
- Open the PBIX file in Power BI Desktop.
- Review the sample pages, KPI cards, slicers, and chart logic.
- Replace the sample source with your own assessment records.
- Refresh the report and validate totals against your source file.
- Use slicers to analyze clients, firms, regions, industries, standards, assessment types, priority, status, and risk level.
- Publish to Power BI Service if your team needs browser sharing or scheduled refresh.
Real-World Use Cases
Anita, GRC consulting partner: reviews assessment fees, risk score, critical findings, and satisfaction before monthly client portfolio meetings.
Michael, lead analyst: uses delivery performance views to compare hours delivered, effort yield, and firm scorecard metrics.
Sofia, compliance manager: uses the standards and findings page to summarize priority assessments and critical finding rates for leadership.
Frequently Asked Questions
Do I need Power BI Desktop?
Yes. Open and edit the PBIX file in Power BI Desktop, which is available from Microsoft.
Can I use my own risk assessment data?
Yes. Replace or connect the sample data source with your own structured records and refresh the report.
Can I customize the dashboard pages?
Yes. You can edit visuals, measures, labels, slicers, relationships, and page names in Power BI Desktop.
Is this a GRC workflow system?
No. It is a Power BI reporting template. It does not manage evidence requests, automated controls testing, tickets, or approvals.
Can I share it with my team?
Yes. Publish the report to Power BI Service and share it according to your Microsoft licensing and workspace permissions.
Is this a subscription?
No. It is a one-time downloadable dashboard template.
About the Author
Built by PK – Microsoft Certified Professional with 15+ years of Excel, Google Sheets, and Power BI experience. Founder of NextGenTemplates, reaching 300K+ subscribers across YouTube channels. Every template is hand-built and tested before release.
Explore Related Templates
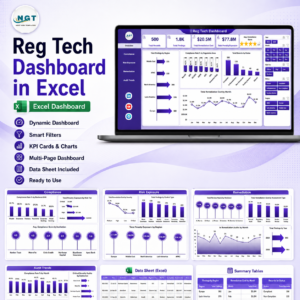
- Reg Tech Dashboard in Excel
- Cybersecurity Dashboard in Google Sheets
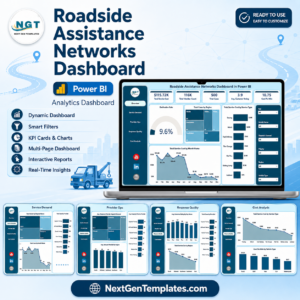
- Roadside Assistance Networks Dashboard in Power BI
- Power BI templates
- Power BI dashboard templates
Download the Risk Assessment Firms Dashboard in Power BI when you want a ready Power BI reporting layer for assessment fees, volume, risk score, critical findings, remediation cost, delivery performance, and compliance standards.
Last updated: August 5, 2026



























Reviews
There are no reviews yet.