

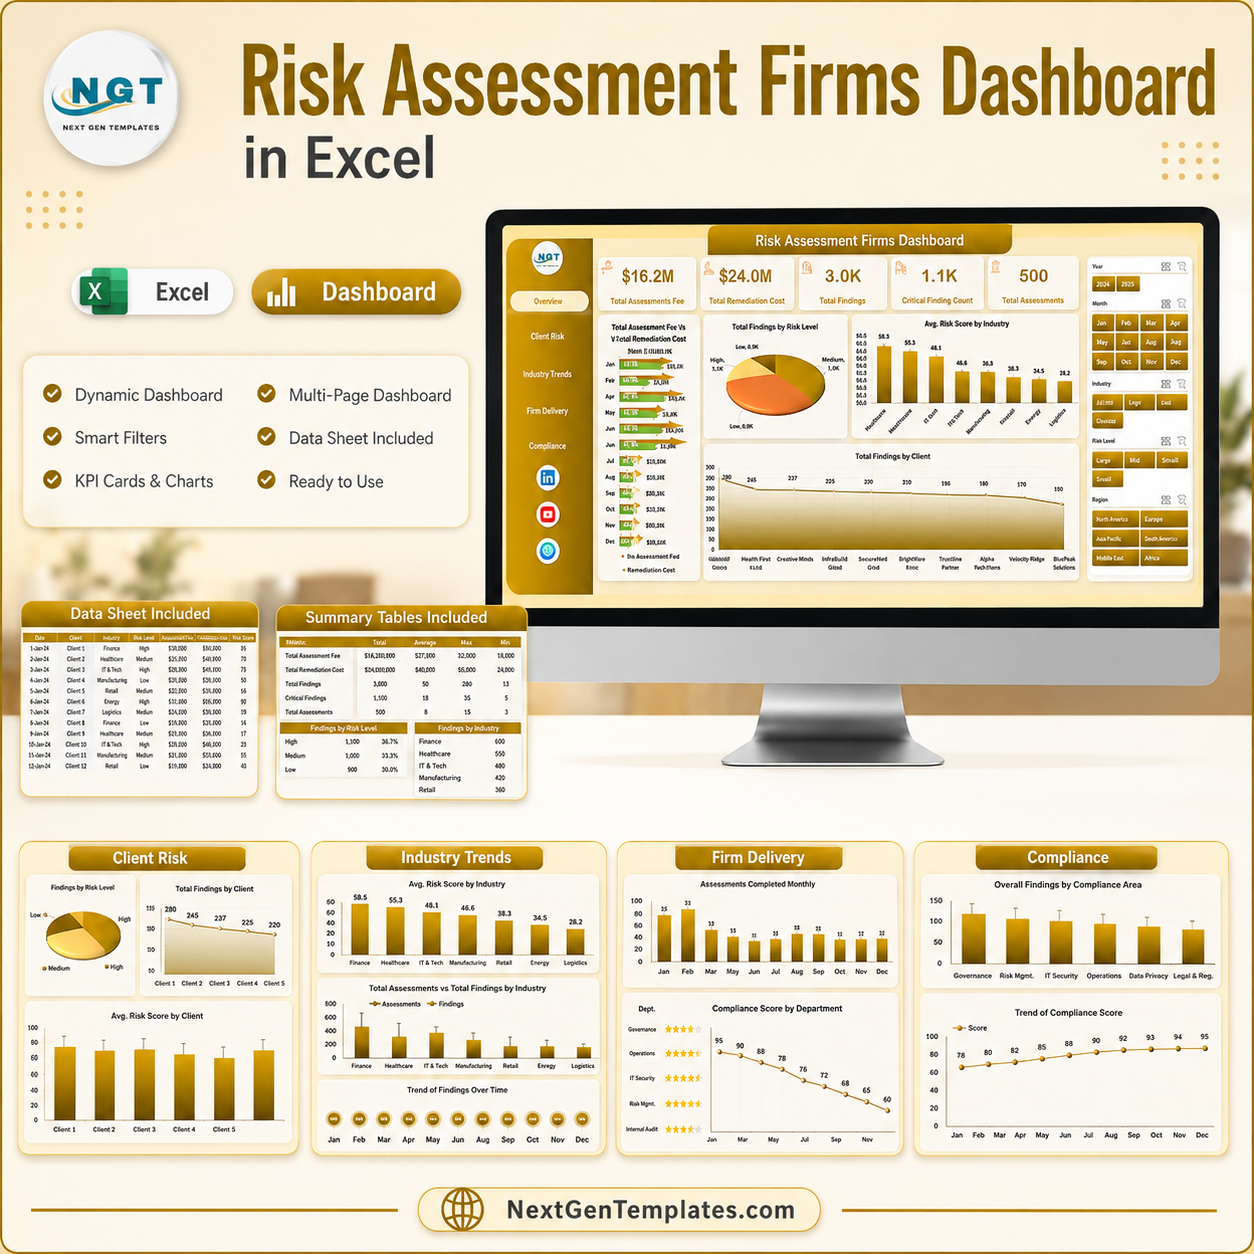


Risk Assessment Firms Dashboard in Excel gives risk consulting teams, GRC analysts, audit partners, and client delivery managers a ready Excel reporting workbook for assessment fees, remediation cost, findings, risk score, completion, satisfaction, industries, regions, firms, priorities, and compliance standards. Many risk teams still consolidate assessment records manually before client reviews; this template shortens that reporting cycle by giving you five dashboard pages, a structured Data sheet, and a Support sheet powered by pivots. Built by PK for a 300K+ subscriber learning audience, it is an instant download, one-time purchase, and practical reporting layer without monthly SaaS fees.
Key Features of Risk Assessment Firms Dashboard in Excel
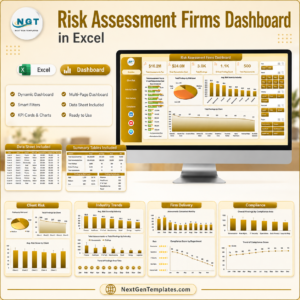
- Five dashboard pages: Overview, Client Risk, Industry Trends, Firm Delivery, and Compliance.
- Executive KPI cards: Total Assessment Fee, Total Remediation Cost, Total Findings, Critical Finding Count, and Total Assessments.
- Risk and cost analytics: Compare assessment fees, remediation cost, findings, critical finding percentage, and risk score across months, regions, industries, clients, and firms.
- Interactive slicers: Filter the workbook quickly during client reviews, audit meetings, and leadership updates.
- Excel refresh workflow: Replace sample rows in the Data sheet, click Refresh All from the Excel Data ribbon, and update all pivots and charts.
- Editable workbook: Change labels, slicers, formulas, charts, colors, and fields to match your firm reporting style.
- No subscription: Use Microsoft Excel and keep your workbook under your own control.
What’s Inside the Risk Assessment Firms Dashboard in Excel
1 – Overview Page
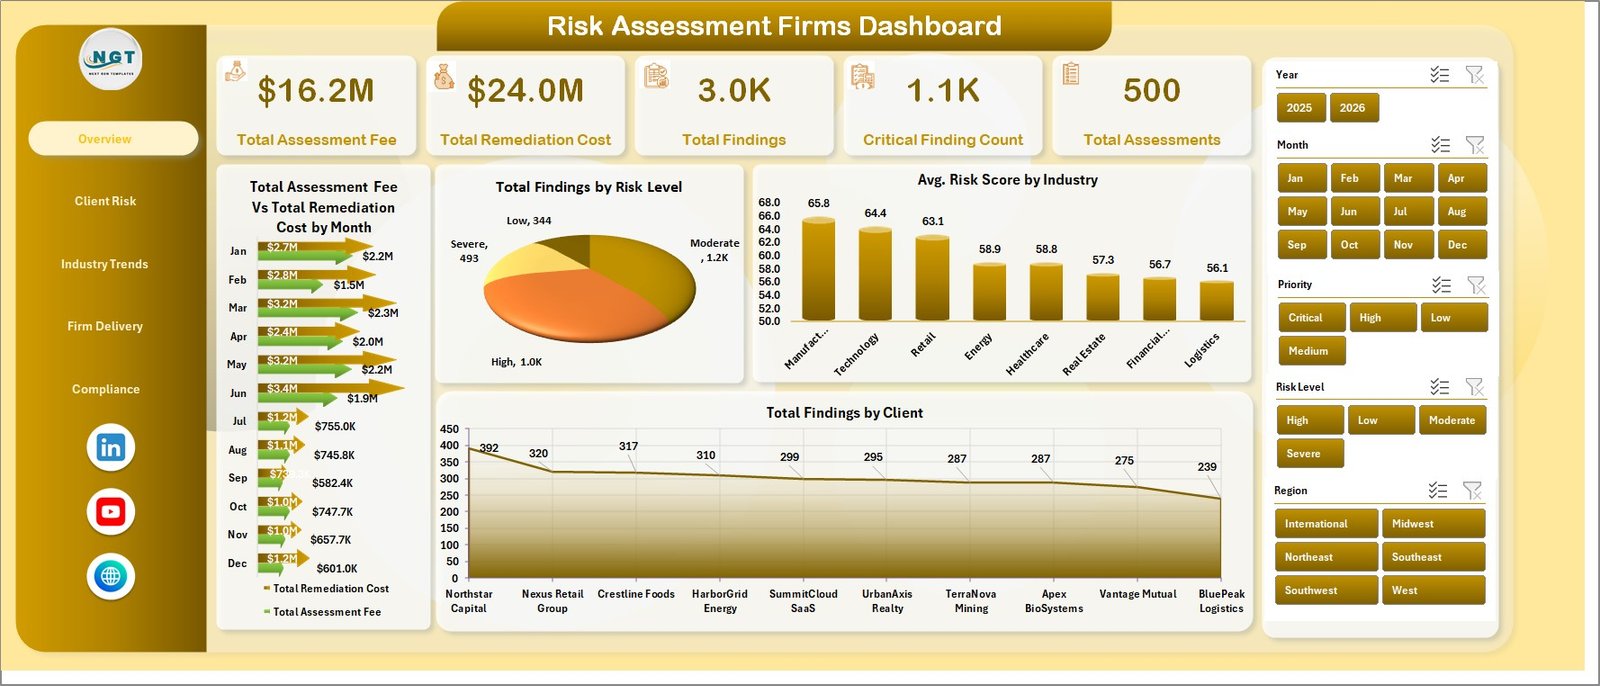
The Overview page gives a high-level view of fee volume, remediation cost, findings, critical findings, and assessment count. It also includes slicers so users can filter the dashboard quickly.
Total Assessment Fee Vs Total Remediation Cost by Month: This chart compares assessment revenue and expected remediation cost month by month. It helps firms see whether remediation exposure is rising faster than assessment billing.
Total Findings by Risk Level: This visual separates findings by severity. It helps teams identify whether the portfolio is dominated by low, medium, high, or critical issues.
Avg. Risk Score by Industry: This chart compares average risk score across industries. It helps consultants identify sectors that need stronger controls or deeper assessment follow-up.
Total Findings by Client: This chart ranks clients by findings count. It supports account reviews, remediation planning, and client prioritization.
2 – Client Risk
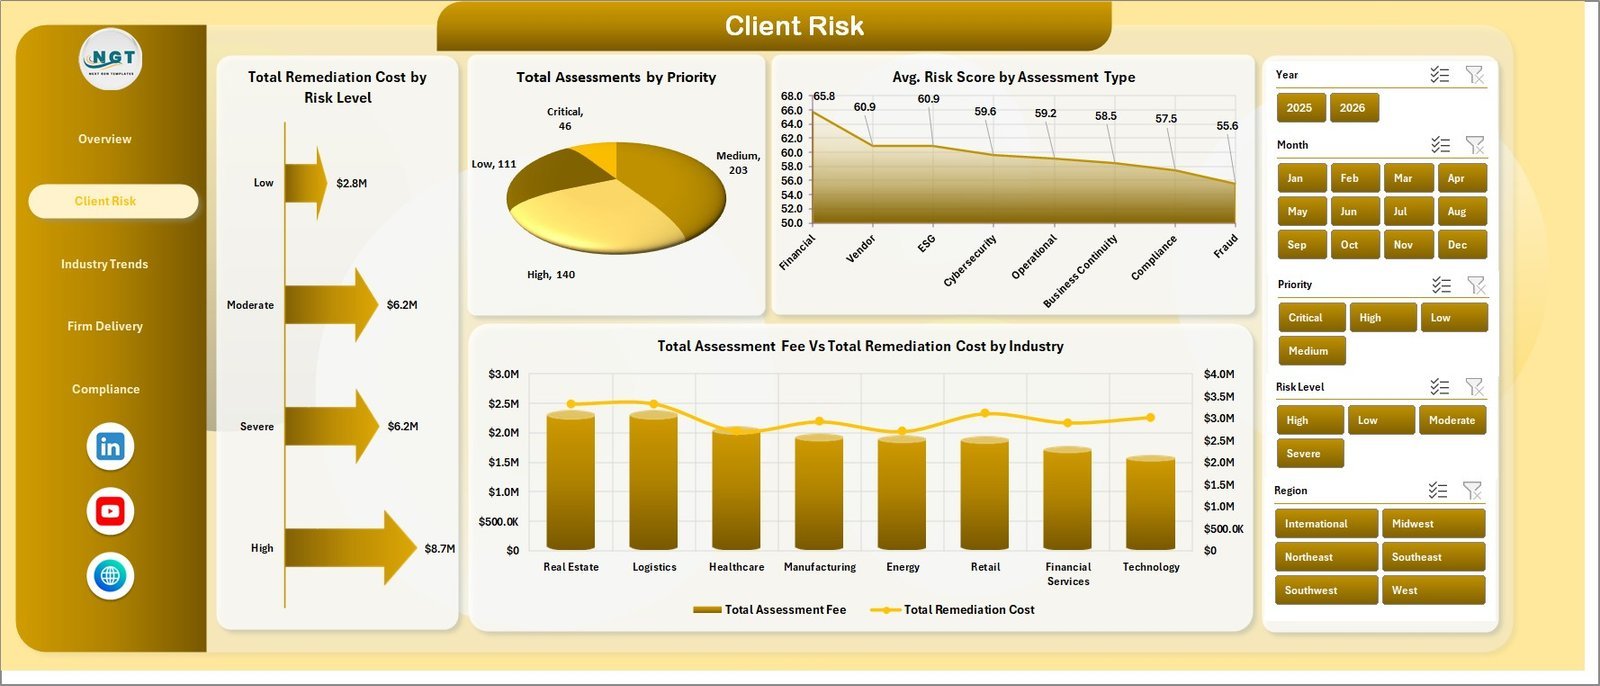
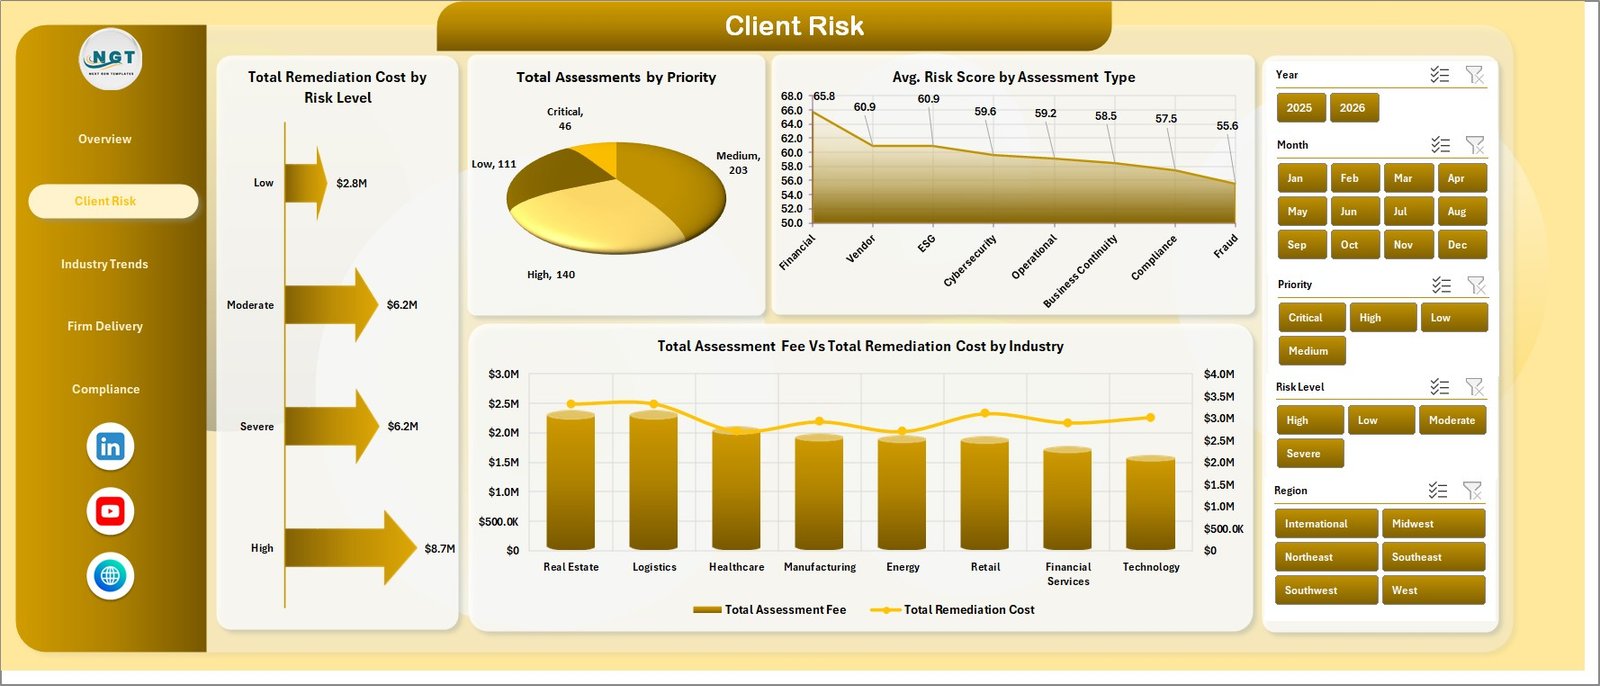
The Client Risk page focuses on client-facing exposure and workload. Charts include Total Remediation Cost by Risk Level, Total Assessments by Priority, Avg. Risk Score by Assessment Type, and Total Assessment Fee Vs Total Remediation Cost by Industry.
3 – Industry Trends
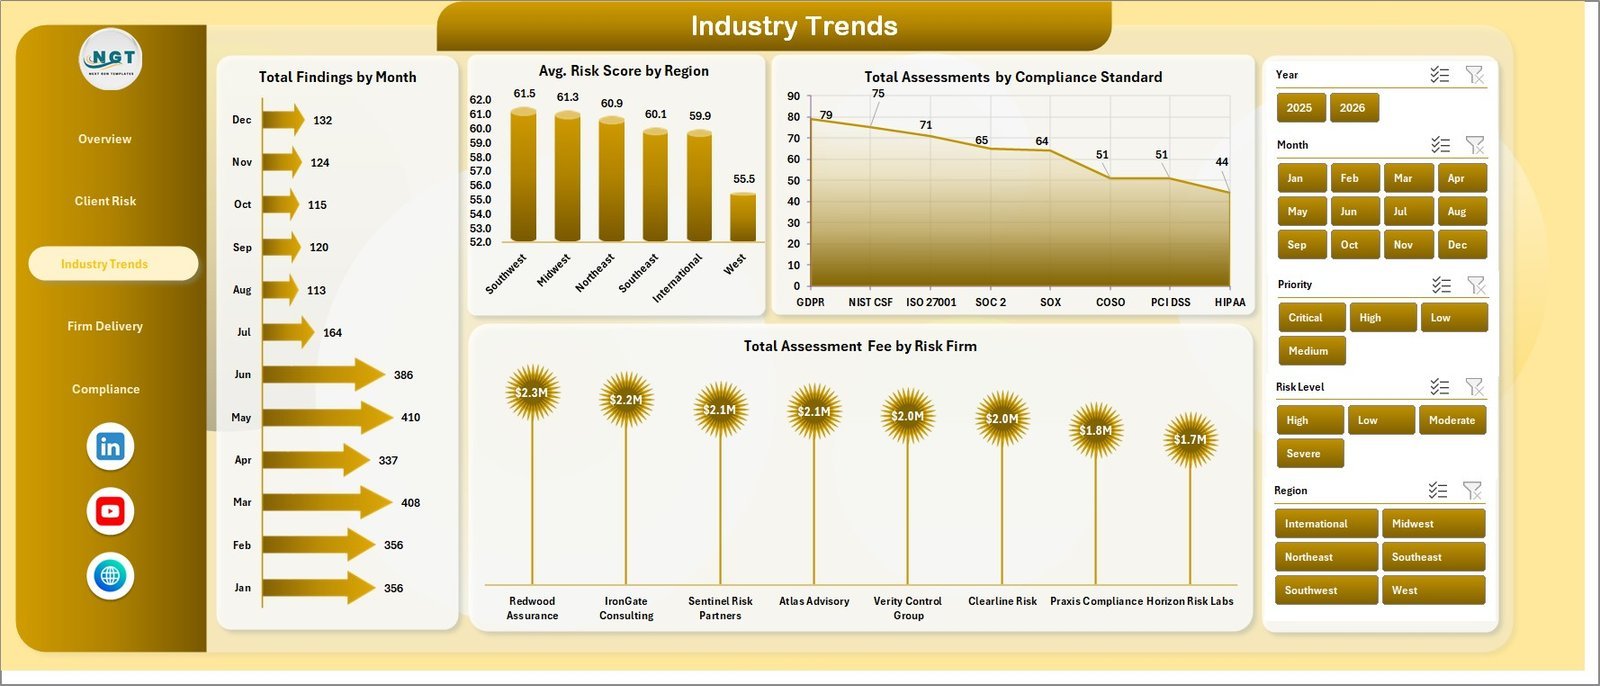
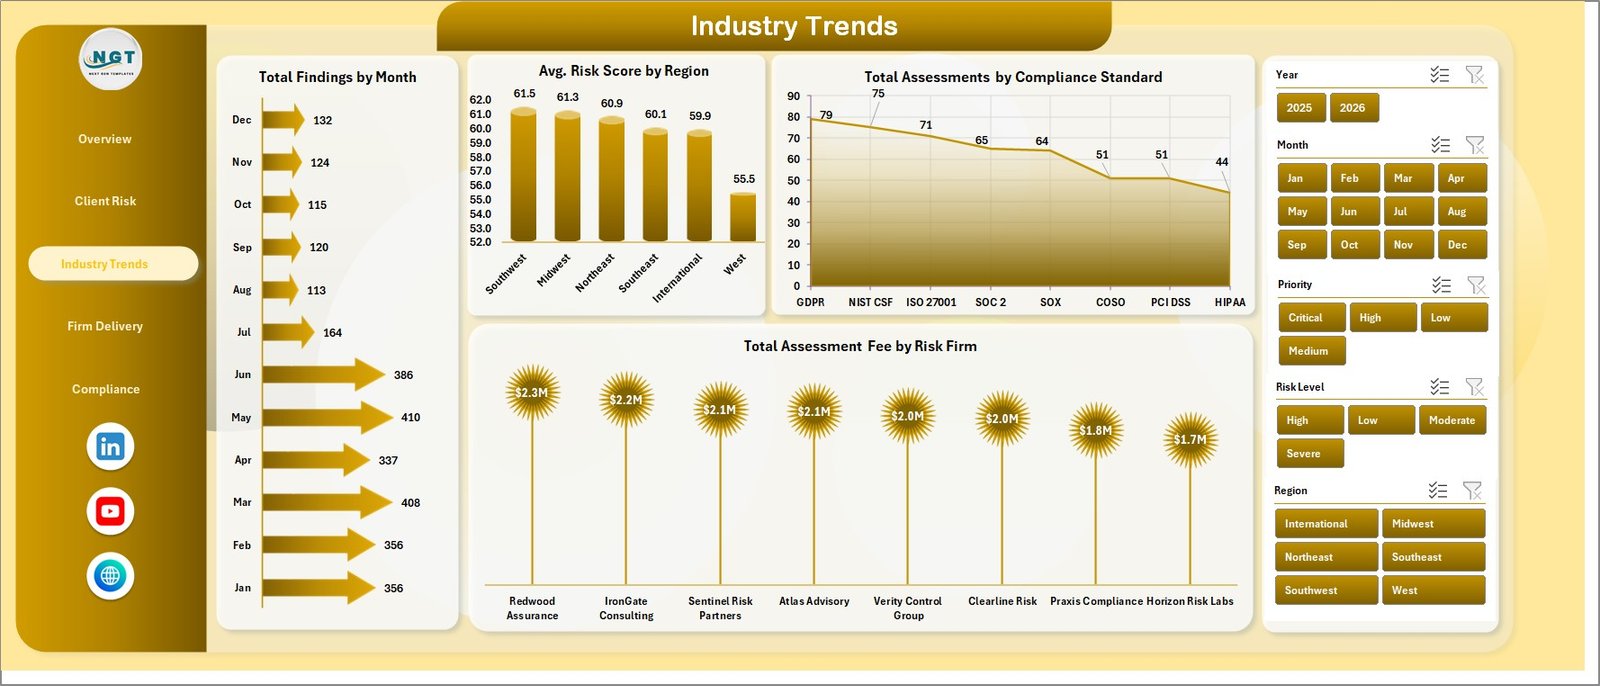
The Industry Trends page shows Total Findings by Month, Avg. Risk Score by Region, Total Assessments by Compliance Standard, and Total Assessment Fee by Risk Firm. It is useful for market-level and service-line reviews.
4 – Firm Delivery
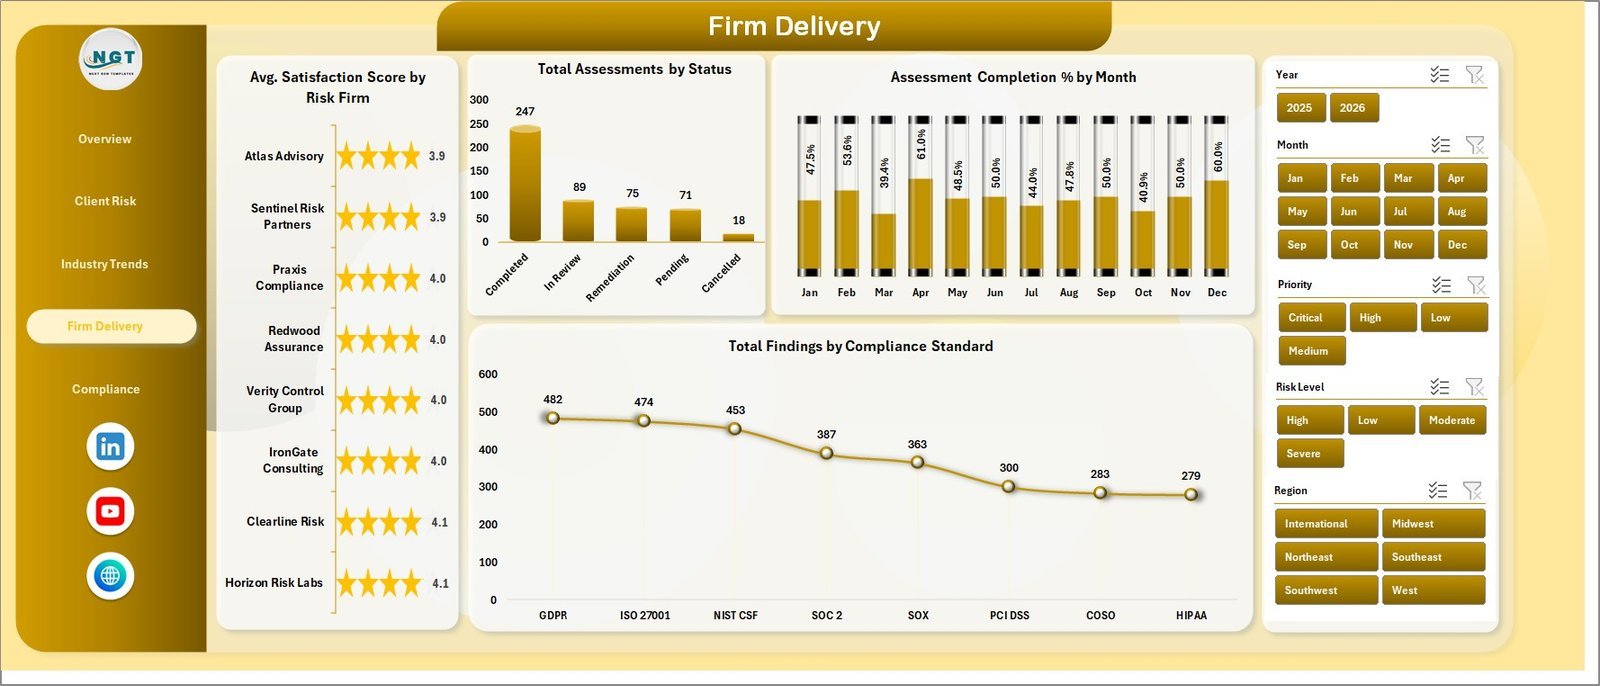
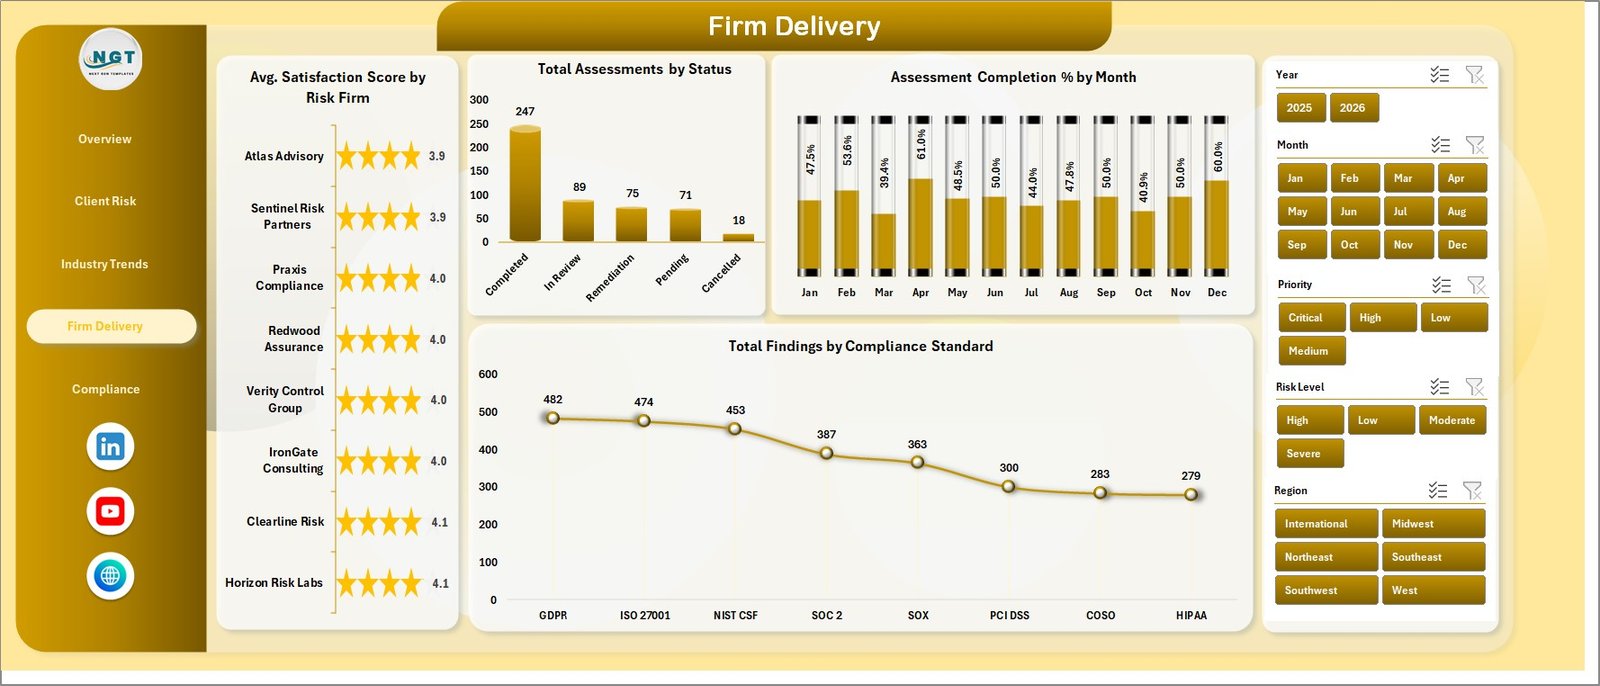
The Firm Delivery page measures how assessment firms are performing after the work begins. It includes Avg. Satisfaction Score by Risk Firm, Total Assessments by Status, Assessment Completion % by Month, and Total Findings by Compliance Standard.
5 – Compliance
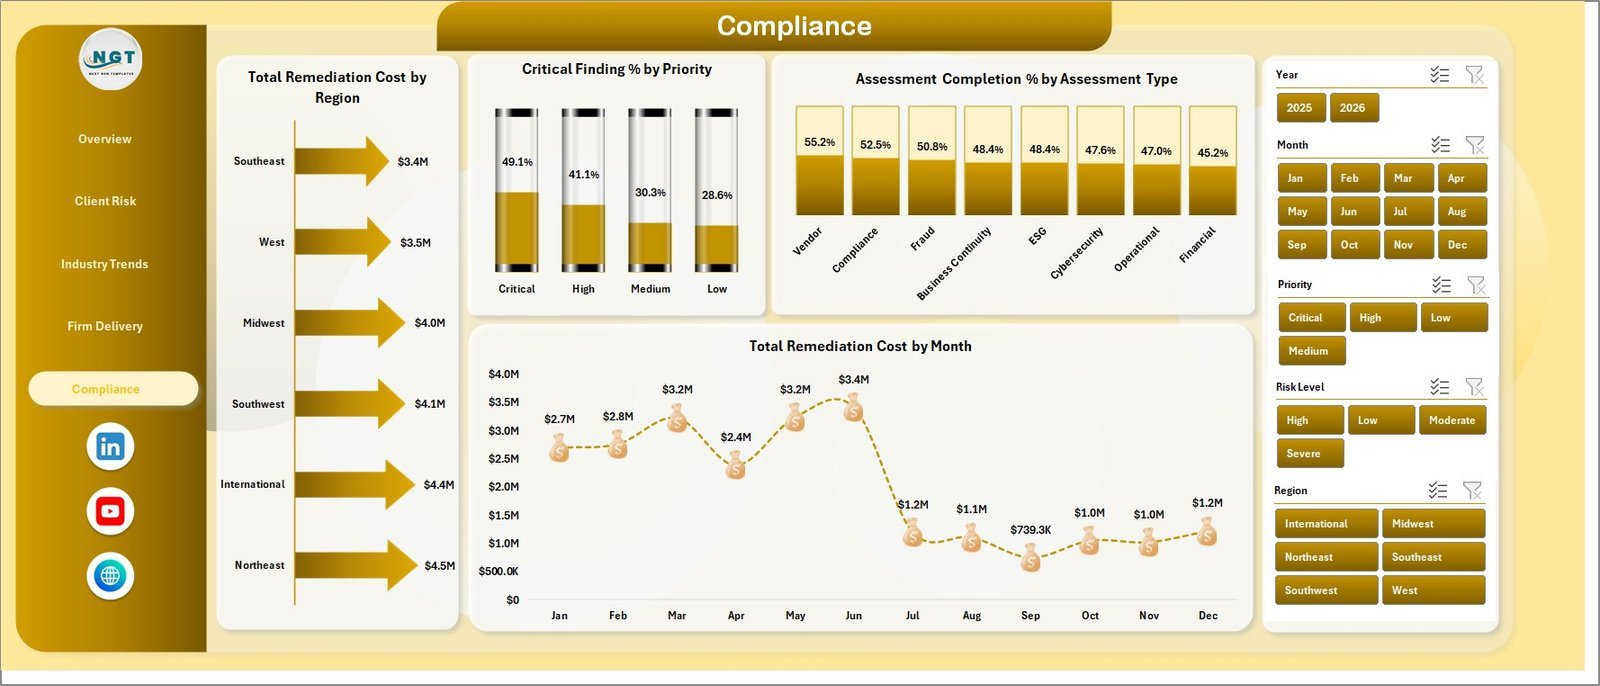
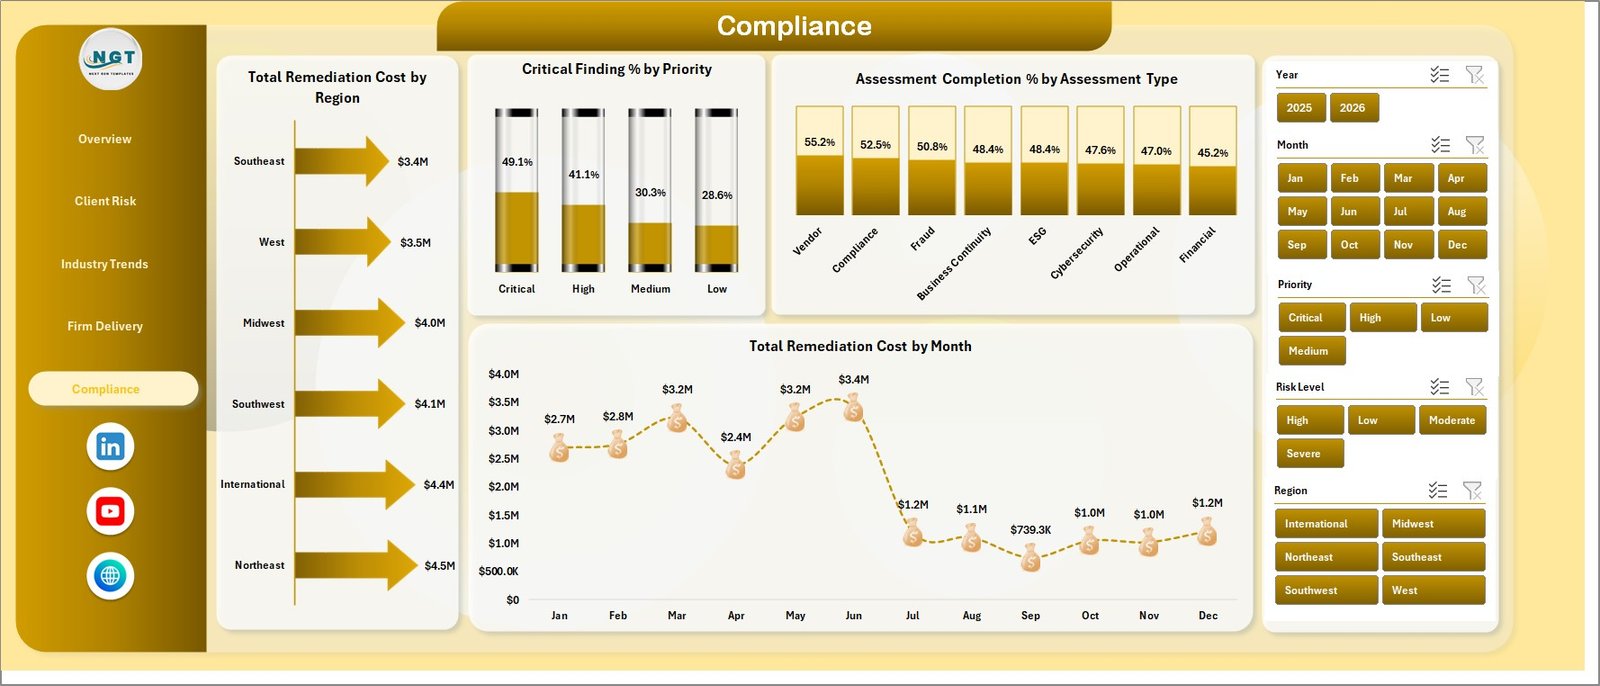
The Compliance page helps users track remediation and completion across regions, priorities, assessment types, and months. Charts include Total Remediation Cost by Region, Critical Finding % by Priority, Assessment Completion % by Assessment Type, and Total Remediation Cost by Month.
6 – Data Sheet Tab
The Data sheet is where users add assessment records in the same format as the sample data. Keep the columns consistent, paste new records, and refresh the workbook.

7 – Support Sheet
The Support sheet contains multiple pivot tables used to create the dashboard dynamically. After updating the Data sheet, go to the Excel Data ribbon and click Refresh All. All pivots and charts refresh together, and the sheet can be hidden for normal users.

Risk Assessment Firms Dashboard in Excel vs. Google Sheets vs. Paid GRC SaaS – Where This Fits
| Feature | This Excel dashboard | Google Sheets alternative | Paid GRC SaaS |
|---|---|---|---|
| Cost | $17.99 one-time sale price | Low software cost but manual build required | Recurring subscription and implementation cost |
| Platform | Microsoft Excel | Google Sheets | Vendor-hosted cloud platform |
| Setup time | Update data and refresh pivots | Build formulas, pivots, filters, and charts manually | Configure users, workflows, permissions, and fields |
| Real-time team collaboration | Available through OneDrive or SharePoint workflows | Native browser collaboration | Usually included |
| Mobile access | Limited through Excel mobile | Strong mobile access | Usually included |
| Customizable fields | Fully editable workbook | Editable when built manually | Often limited by admin settings |
| Share with link | Possible through Microsoft 365 sharing | Native link sharing | Role-based access |
| Year-1 cost at 5 users | Template cost plus Excel access | Workspace cost plus build time | Often hundreds or thousands per year |
| Best fit | Assessment reporting, client review packs, and risk analytics in Excel | Lightweight shared tracking | Workflow, approvals, audit trail, and evidence management |
Who This Template Is For – and Who It’s Not For
This template is built for risk assessment firms, consulting teams, compliance analysts, internal audit teams, cyber risk reviewers, finance risk analysts, GRC consultants, and client delivery managers who already have assessment records and need a practical Excel dashboard for reporting.
It is not a full GRC platform, evidence repository, regulatory filing tool, control testing workflow, incident response system, or automated risk scoring engine. Use it as a flexible reporting layer after your source data has been prepared.
How to Use the Risk Assessment Firms Dashboard in Excel
- Download and unzip the Excel dashboard file.
- Open the workbook in Microsoft Excel.
- Go to the Data sheet and replace the sample records with your own assessment data.
- Keep the same column structure so pivots and charts continue to work.
- Click Refresh All from the Excel Data ribbon.
- Review the Overview, Client Risk, Industry Trends, Firm Delivery, and Compliance pages.
- Use slicers to filter by client, industry, firm, region, priority, risk level, compliance standard, status, or assessment type.
Real-World Use Cases
Aditi, risk consulting manager: uses the Overview and Client Risk pages before client steering meetings to compare assessment fees, remediation cost, findings, and priority mix.
Marcus, GRC analyst: reviews Industry Trends to see which industries and regions are carrying higher average risk scores and where additional controls may be needed.
Priya, delivery lead: uses Firm Delivery to compare assessment status, completion percentage, satisfaction score, and findings by compliance standard across partner firms.
Frequently Asked Questions
What does the Risk Assessment Firms Dashboard in Excel track?
It tracks assessment fees, remediation cost, total findings, critical findings, total assessments, risk level, priority, risk score, client, industry, region, risk firm, compliance standard, status, completion percentage, and satisfaction score.
How many sheets are included?
The workbook includes Overview, Client Risk, Industry Trends, Firm Delivery, Compliance, Data, and Support sheet tabs.
Can I use my own assessment data?
Yes. Replace the sample rows in the Data sheet with your own records while keeping the same column format, then click Refresh All.
Does this dashboard require macros?
No macro workflow is required for the dashboard refresh. It uses Excel data, pivots, slicers, cards, and charts.
Can I customize the workbook?
Yes. You can edit fields, formulas, colors, chart titles, slicers, worksheets, and report layout in Excel.
Does this replace GRC software?
No. It is an Excel reporting dashboard, not a full governance, risk, and compliance workflow platform.
About the Author
Built by PK – Microsoft Certified Professional with 15+ years of Excel, Google Sheets, and Power BI experience. Founder of NextGenTemplates, reaching 300K+ subscribers across YouTube channels. Every template is hand-built and tested before release.
Explore Related Templates
You may also like Risk Management Dashboard in Power BI, Customer Service and Support Risk Management KPI Dashboard, and the Excel Dashboard Templates collection.
Click here to read the detailed blog post
Download the Risk Assessment Firms Dashboard in Excel and start reviewing fees, remediation cost, findings, risk levels, firm delivery, and compliance performance in one editable workbook.
Last updated: August 2026







Reviews
There are no reviews yet.