

Are your recruitment efforts paying off? Are you hiring the right people efficiently and cost-effectively? With the Recruitment KPI Dashboard in Google Sheets, you get the ultimate recruitment analytics solution at your fingertips. This powerful and user-friendly tool helps HR teams and hiring managers monitor, analyze, and improve their entire recruitment lifecycle — all in one place! 💼📈
Whether you want to reduce time to hire, lower hiring costs, or improve your candidate quality, this dashboard empowers you to make data-driven hiring decisions confidently and in real time.
🔑 Key Features of the Recruitment KPI Dashboard
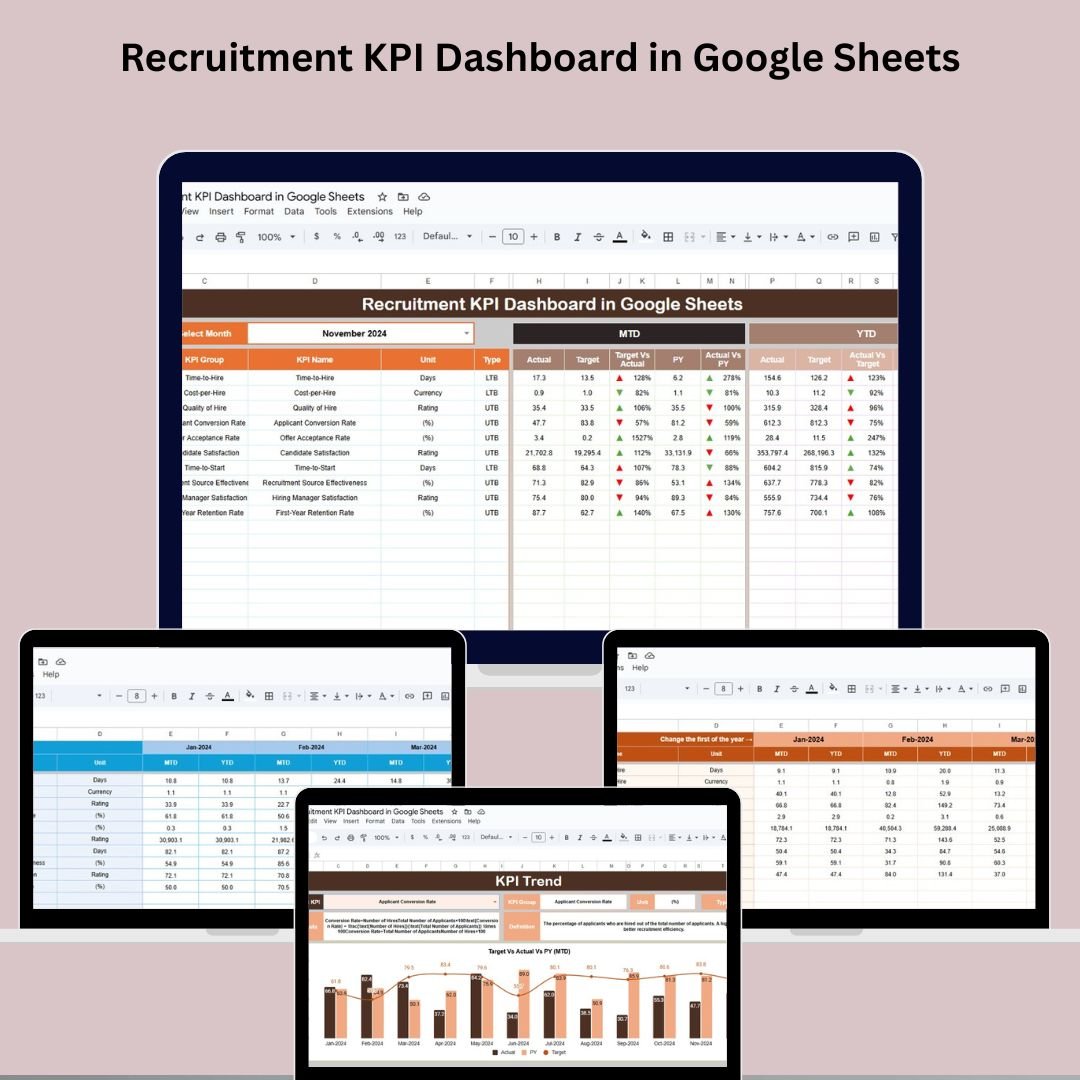
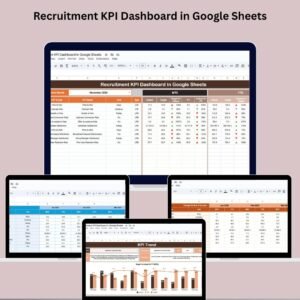
🖥️ Dashboard Sheet Tab – Your Recruitment Command Center
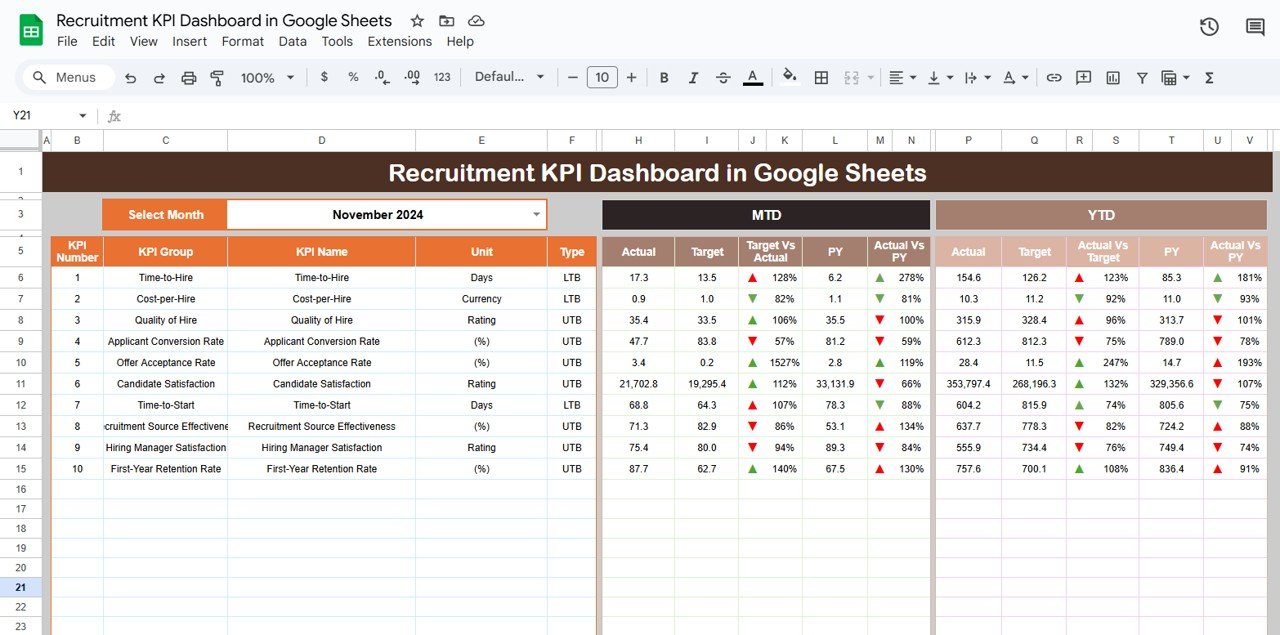
This is where it all comes together! On the Dashboard Sheet tab, select a month (D3), and instantly view:
📆 MTD & YTD Actuals – Track current recruitment performance.
🎯 MTD & YTD Targets – Compare against your hiring goals.
🔁 Previous Year Comparison – Analyze year-over-year progress.
📉 Target vs Actual – With up/down arrows for instant visual feedback.
These performance snapshots help you stay proactive and aligned with your hiring goals. No more guesswork!
📁 What’s Inside the Recruitment KPI Dashboard
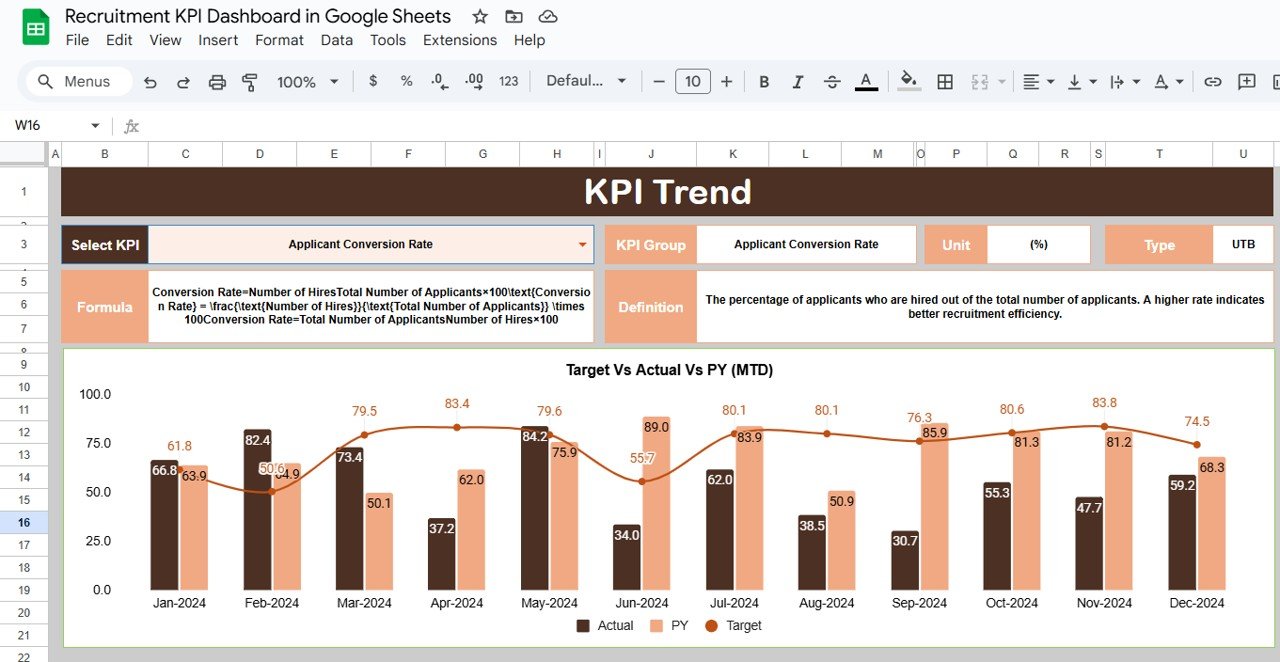
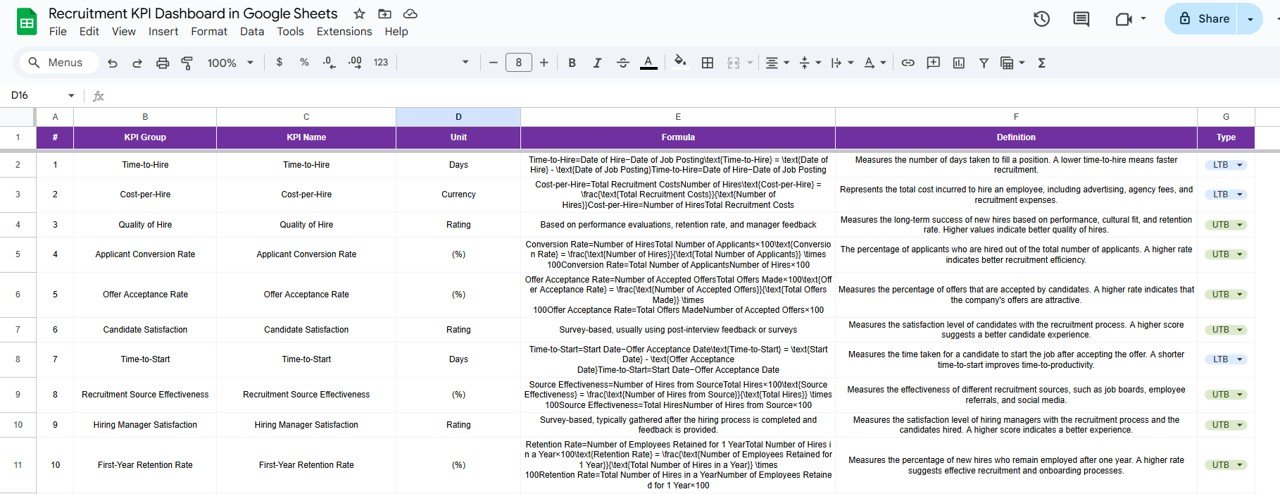
1️⃣ KPI Trend Sheet Tab – Deep Dive into Key Metrics
Select a KPI (cell C3), and discover:
KPI Group (Cost, Time, Quality, etc.)
Unit of Measure
KPI Type (Lower the Better or Upper the Better)
Formula & Definition
Know exactly what you’re tracking, how it’s calculated, and why it matters. 🔍
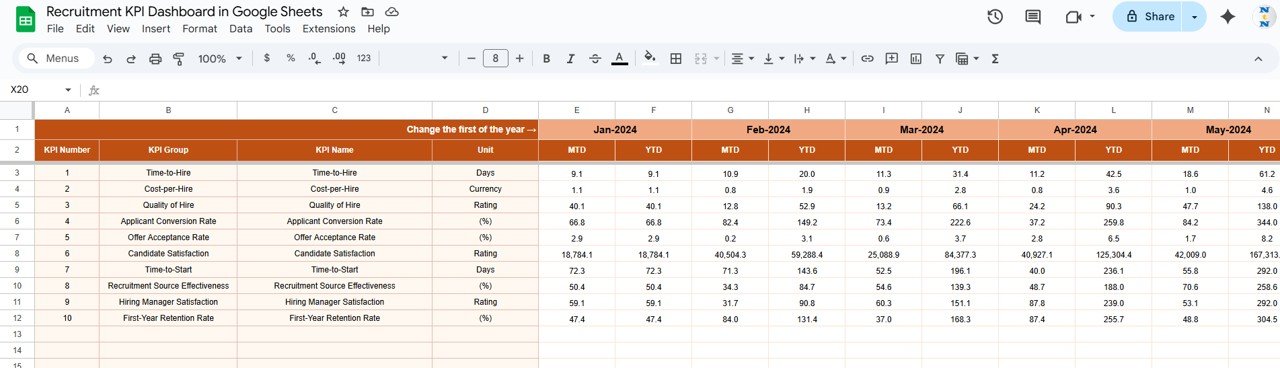
2️⃣ Actual Number Sheet Tab – Real-Time Recruitment Data
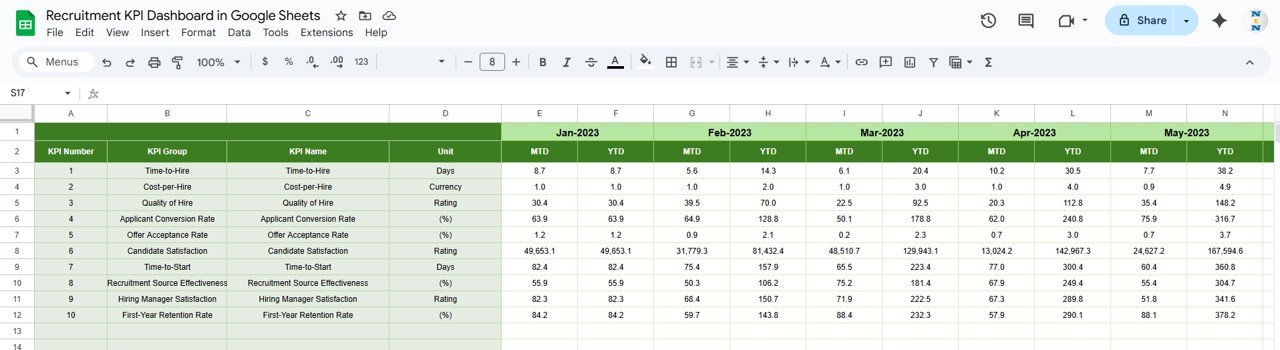
Input actual values for each KPI, month by month.
Change the Start Month in E1 to update the entire dashboard dynamically.
📊 It’s quick, efficient, and automatically reflects in all visuals.
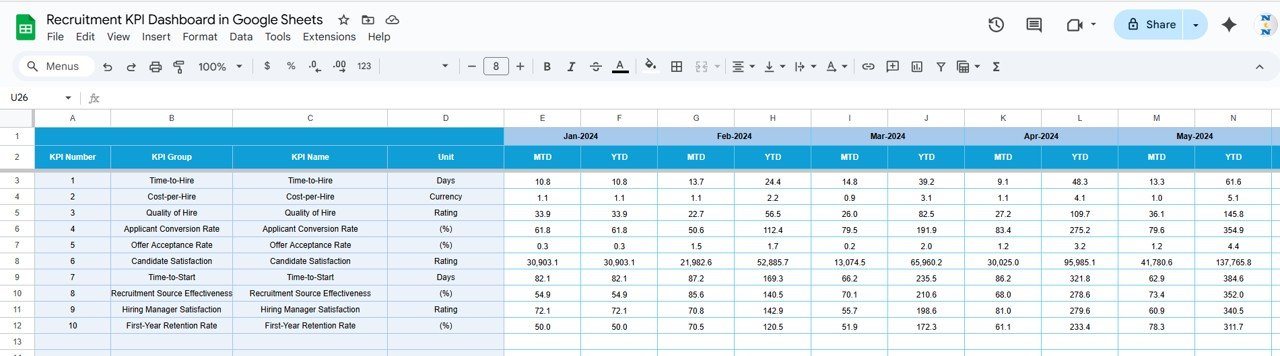
3️⃣ Target Sheet Tab – Set Your Hiring Goals
Plan smart by entering:
Monthly and yearly targets for every KPI.
Track performance gaps with real-time comparison.
4️⃣ Previous Year Sheet Tab – Track Long-Term Progress
Add last year’s data and see:
Which areas are improving.
Where efforts need boosting.
🔁 Stay ahead of trends and ensure continuous improvement.
5️⃣ KPI Definition Sheet Tab – Eliminate Ambiguity
Every KPI in one place with:
Definitions
Units
Formulas
Type (UTB/LTB)
📘 Ideal for team alignment and transparent reporting.
🚀 How to Use the Recruitment KPI Dashboard
📥 Enter your actual recruitment data in the “Actual Number” tab.
🎯 Define your targets in the “Target” sheet.
📆 Set the start month in E1 and watch the dashboard adjust.
🔎 Use the dashboard to track trends, compare with last year, and monitor key metrics.
👥 Share it with your HR team for collaborative, real-time tracking.
No tech skills needed – just open, enter, and analyze!
👥 Who Can Benefit from This Dashboard?
This template is perfect for:
🧑💼 HR Professionals tracking hiring efficiency
🏢 Recruitment Agencies analyzing client hiring trends
🧑🔬 Talent Acquisition Teams improving sourcing strategies
📈 Business Leaders monitoring workforce planning KPIs
📊 Analysts needing monthly and yearly recruitment analytics
Whether you’re a startup or a large enterprise, this dashboard scales with your needs.
💡 Why You’ll Love This Tool
📊 One-Stop Dashboard for all essential KPIs
⏱️ Track Time to Hire, Cost per Hire & More instantly
🔄 Compare Current vs Past Performance
🧩 Fully Customizable – Add your own KPIs
🧠 KPI Definitions Included – No confusion
👥 Google Sheets Friendly – Collaborate in real-time
📈 Visual Performance Arrows for intuitive analysis
📌 Best Practices for Using the Dashboard
🔄 Update monthly with fresh data
🎯 Set SMART goals using the Target tab
📊 Monitor gaps between Target vs Actual
📅 Review year-over-year changes
🧑💼 Share with your hiring team to stay aligned





Reviews
There are no reviews yet.