


Running a grocery store efficiently requires constant tracking of performance across sales, inventory, and customer engagement. The Grocery Store KPI Dashboard in Google Sheets is a ready-to-use, interactive tool designed to help store managers, owners, and analysts monitor key metrics and make data-driven decisions — all in one place.
Built entirely in Google Sheets, this dashboard automates performance tracking and provides visual insights into store operations, helping you enhance productivity, profitability, and customer satisfaction. 🌟
🔑 Key Features of the Grocery Store KPI Dashboard in Google Sheets
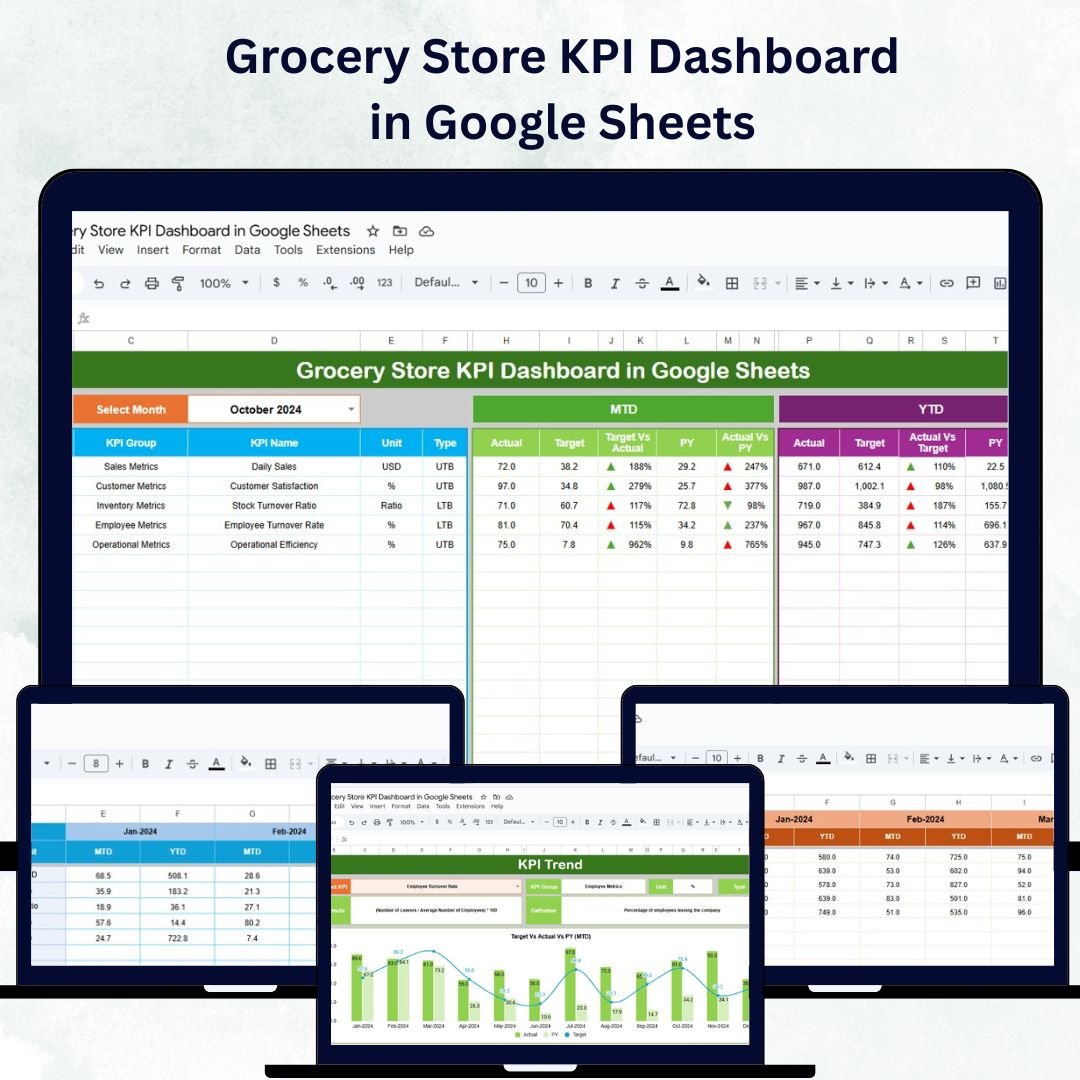
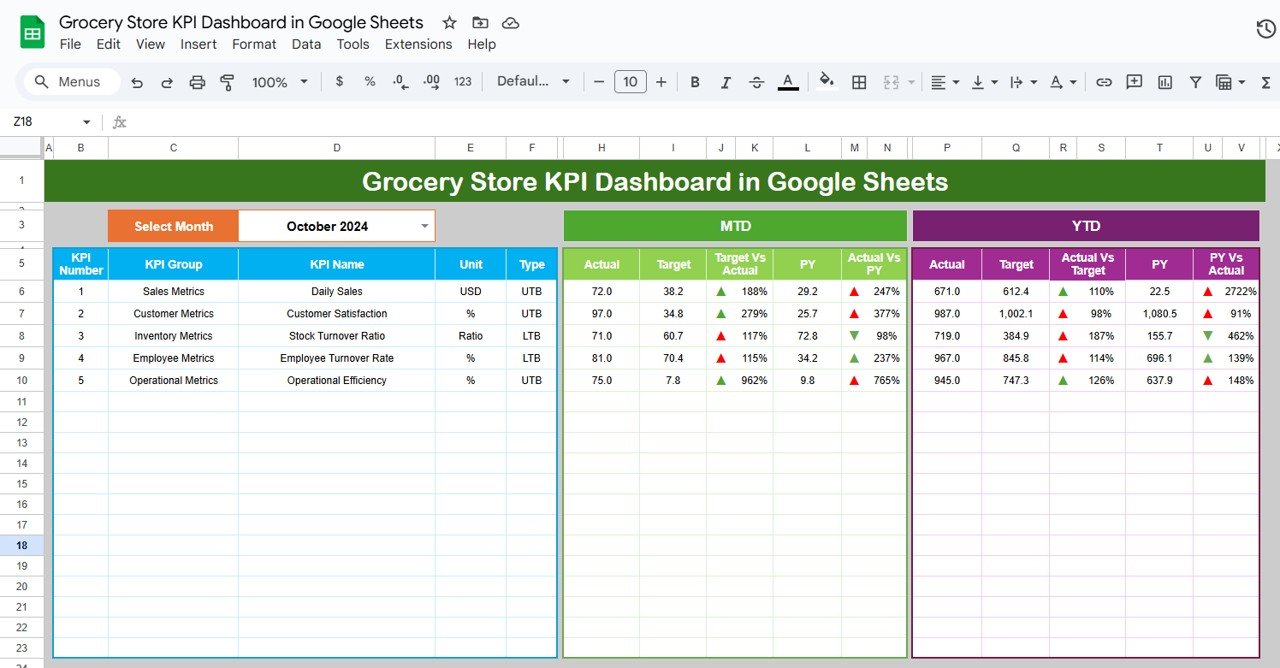
📊 Dashboard Sheet Tab
Get a complete overview of your store’s performance with dynamic visuals and real-time insights:
-
Month Selection (Range D3): Updates all KPIs for the chosen month
-
MTD Metrics: Displays Month-to-Date Actual, Target, and Previous Year data
-
YTD Metrics: Tracks Year-to-Date performance with conditional formatting
-
Visual Indicators: Arrows and color codes highlight trends and target achievement
This sheet acts as the control center for quick analysis of sales, operations, and inventory health.
📈 KPI Trend Sheet Tab
Dive deeper into KPI trends over time:
-
Select a KPI from the dropdown (Range C3)
-
Displays KPI Group, Unit, and Type (Upper-the-Better or Lower-the-Better)
-
Shows formulas and definitions for clarity
-
Visualizes monthly MTD and YTD trends
This tab helps identify seasonal trends, bottlenecks, and growth opportunities.
🧾 Actual Numbers Sheet Tab
Input your performance data for MTD and YTD metrics:
-
Update the first month (Range E1) to adjust all calculations
-
Data automatically syncs with the dashboard and charts
-
Supports multi-department or category tracking
🎯 Target Sheet Tab
Set clear performance benchmarks for your store:
-
Define monthly and yearly targets
-
Compare actual vs. target to identify shortfalls or overperformance
-
Helps maintain accountability and goal alignment across teams
📉 Previous Year Numbers Sheet Tab
Understand your growth trajectory:
-
Input last year’s values for comparative analysis
-
Assess progress against previous performance
-
Recognize seasonal fluctuations and long-term trends
📘 KPI Definition Sheet Tab
Maintain clarity for all team members:
-
Document KPI Name, Group, Unit, Formula, Definition, and Type
-
Ensures everyone understands how performance is measured
-
Provides a standardized approach for all reporting
🛍️ Example KPIs Tracked in the Dashboard
The Grocery Store KPI Dashboard comes with a predefined list of performance metrics suitable for any retail setup:
-
Total Sales ($): Tracks revenue generated per period
-
Average Basket Value ($): Measures the average spend per transaction
-
Inventory Turnover Rate: Evaluates how fast stock is sold and replenished
-
Customer Footfall: Monitors total store visitors
-
Stock-Outs: Tracks instances when items are unavailable (Lower-the-Better)
-
Employee Performance Score: Assesses productivity and service quality
-
Sales per Category ($): Analyzes which product lines drive the most revenue
Each KPI includes:
-
Unit of Measurement (e.g., $, %, count)
-
Formula for Calculation
-
Performance Type (UTB/LTB)
🌟 Advantages of Using the Grocery Store KPI Dashboard
✅ Centralized Data Management: Track all store metrics in one Google Sheet
📈 Real-Time Insights: Charts and cards update automatically with new data
🧠 Trend Analysis: Compare MTD, YTD, and Year-over-Year performance
💡 Identify Opportunities: Spot underperforming categories and improve stock management
🛒 Customer-Centric Optimization: Use KPIs to enhance service quality and retention
👥 Collaborative Access: Multiple users can edit and view in real time
⚙️ Customizable: Add, modify, or remove KPIs easily based on store requirements
🧠 Best Practices for Using the Dashboard
-
Update Regularly: Input fresh data monthly or weekly for accurate tracking
-
Segment KPIs: Analyze performance by store section or product category
-
Leverage Conditional Formatting: Highlight top and low-performing areas
-
Monitor Inventory: Track stock-outs and turnover for supply optimization
-
Compare with Past Data: Identify growth patterns and recurring issues
-
Engage Teams: Share the dashboard with department leads for collaboration
🧾 How This Dashboard Helps Grocery Store Managers
-
Improve Decision-Making: Use KPIs to guide pricing, promotions, and inventory strategy
-
Boost Profit Margins: Track basket value and sales by category
-
Reduce Waste: Identify fast- and slow-moving products
-
Enhance Customer Experience: Monitor footfall and satisfaction trends
-
Optimize Workforce Performance: Evaluate team efficiency through HR-linked KPIs
With this tool, grocery stores can turn data into insights — driving smarter decisions, improved efficiency, and sustainable growth. 🚀


Reviews
There are no reviews yet.