



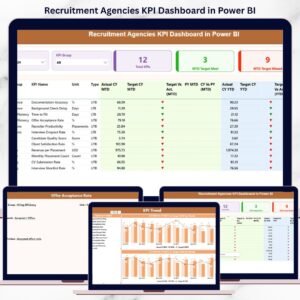
The Recruitment KPI Dashboard in Power BI is an essential tool for human resources teams, recruitment managers, and businesses looking to optimize their hiring process. This powerful dashboard helps track key recruitment metrics in real time, providing clear insights into recruitment performance, efficiency, and the quality of hires. With visually appealing charts and real-time updates, this dashboard makes it easy to analyze and monitor your recruitment efforts, ensuring you make data-driven decisions for improving your hiring process.
By using the Recruitment KPI Dashboard, you can track essential recruitment KPIs such as time-to-hire, cost-per-hire, candidate quality, and more. The dashboard allows you to segment your data by different hiring stages, departments, or even locations, offering a comprehensive view of your recruitment process. With this tool, HR professionals can stay on top of recruitment performance and identify areas for improvement.

Key Features of the Recruitment KPI Dashboard in Power BI
📌 Comprehensive Recruitment KPIs
Track essential recruitment KPIs such as time-to-hire, cost-per-hire, source of hire, and candidate quality. The dashboard gives you a comprehensive view of how your recruitment efforts are performing against your goals.
🛠 Customizable Data Views
The dashboard is fully customizable, allowing you to filter and segment your recruitment data based on various criteria such as job position, department, location, or hiring stage. This flexibility ensures that the dashboard meets the specific needs of your business or recruitment strategy.
💡 Real-Time Data Updates
The Recruitment KPI Dashboard provides real-time updates as you input new data. Whether you’re tracking ongoing hiring efforts or reviewing completed hiring cycles, the dashboard dynamically adjusts to reflect the latest information, ensuring you always have up-to-date insights.
🔢 Visual and Intuitive Charts
The dashboard features visually appealing charts, including bar graphs, pie charts, and line graphs, to help you understand your recruitment performance at a glance. The intuitive design ensures that key metrics and trends are clear and easy to interpret.
🚀 Actionable Insights
The Recruitment KPI Dashboard highlights key trends, areas for improvement, and bottlenecks in the recruitment process. By analyzing these insights, HR professionals can make informed decisions to streamline their hiring process and improve the quality of candidates.
📊 Department and Location Breakdown
Track recruitment data by department, location, or job role, allowing you to see how different parts of the organization are performing in terms of recruitment. This feature is especially useful for large organizations with multiple hiring teams.
⚙ Easy to Use and Set Up
Setting up the Recruitment KPI Dashboard is easy, even for users with limited experience in Power BI. With clear instructions and a user-friendly interface, HR professionals can quickly start using the dashboard to monitor their recruitment efforts.
🚀 Why You’ll Love the Recruitment KPI Dashboard in Power BI
✅ Comprehensive KPI Tracking – Monitor all essential recruitment metrics in one place. ✅ Customizable and Flexible – Tailor the dashboard to fit your organization’s needs and recruitment strategy. ✅ Real-Time Data Updates – Get up-to-date insights as your data changes. ✅ Visually Engaging – Attractive charts and graphs make data interpretation easy and quick. ✅ Actionable Insights – Identify trends and bottlenecks to improve your recruitment process.
📂 What’s Inside the Recruitment KPI Dashboard in Power BI?
- Recruitment KPIs: Track time-to-hire, cost-per-hire, candidate quality, and more.
- Customizable Filters: Segment data by department, location, or job role.
- Real-Time Updates: Stay on top of recruitment efforts with automatic data updates.
- Visually Appealing Charts: Bar graphs, pie charts, and line graphs for clear data visualization.
- Clear Setup Instructions: Simple, step-by-step guide to setting up the dashboard.
🔍 How to Use the Recruitment KPI Dashboard in Power BI
1️⃣ Download the Dashboard – Instant access to the Power BI file upon purchase. 2️⃣ Input Your Recruitment Data – Enter your recruitment data into the provided fields. 3️⃣ Customize the Dashboard – Adjust filters and settings to match your recruitment strategy. 4️⃣ Analyze Your Recruitment Performance – Use the charts and graphs to gain insights into your hiring process. 5️⃣ Present and Share – Share the dashboard with stakeholders or HR teams for collaborative analysis.
🎯 Who Can Benefit from the Recruitment KPI Dashboard in Power BI? 🔹 HR Managers
🔹 Recruitment Teams
🔹 Talent Acquisition Professionals
🔹 Business Analysts
🔹 Operations Managers
🔹 Anyone involved in recruitment or talent acquisition
Optimize your recruitment process and make data-driven decisions with the Recruitment KPI Dashboard in Power BI. This dynamic tool ensures you track and analyze key recruitment metrics effectively.
Click here to read the Detailed blog post
https://www.pk-anexcelexpert.com/recruitment-kpi-dashboard-in-power-bi/
Visit our YouTube channel to learn step-by-step video tutorials
Watch the step-by-step demo video:
Compatibility and Requirements
- Open the .pbix file in Power BI Desktop, which is free. Microsoft explains how to install it in Get Power BI Desktop.
- You can publish the report to the Power BI Service if you want to share it with your HR team.
Frequently Asked Questions
Which recruitment KPIs does the dashboard track?
Time-to-hire, cost-per-hire, source of hire and candidate quality, among others.
Can I filter by department or location?
Yes. You can segment the data by job position, department, location or hiring stage.
What kinds of charts are included?
Bar graphs, pie charts and line graphs that show recruitment performance at a glance.
Do I need Power BI experience?
Limited experience is enough. The dashboard comes with setup instructions.
Related Recruitment Templates
- Recruitment KPI Dashboard in Excel: the same KPIs in Excel.
- Recruitment KPI Dashboard in Google Sheets: the Google Sheets edition.
- Recruitment Pipeline Dashboard in Power BI: follow candidates through each stage.
- Recruitment and Hiring Dashboard in Power BI: hiring analytics in Power BI.
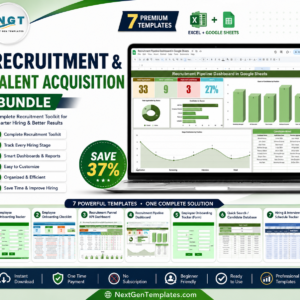
- Recruitment & Talent Acquisition Bundle: 7 recruitment templates in one bundle.
Browse all Power BI KPI dashboards.
















Reviews
There are no reviews yet.