


Running a bakery isn’t just about creating delicious treats — it’s about managing sales, production, inventory, and staff performance with precision. The Bakery KPI Dashboard in Google Sheets is a ready-to-use performance tracking tool that simplifies this process. It transforms raw bakery data into insightful visual dashboards, allowing owners and managers to make data-driven decisions that improve efficiency, reduce waste, and increase profitability.
Built entirely in Google Sheets, this dashboard helps you monitor Month-to-Date (MTD) and Year-to-Date (YTD) performance, compare actuals with targets and previous year data, and visualize trends for sales, production, and customer satisfaction — all in one place. 🥐💼
🔑 Key Features of the Bakery KPI Dashboard in Google Sheets
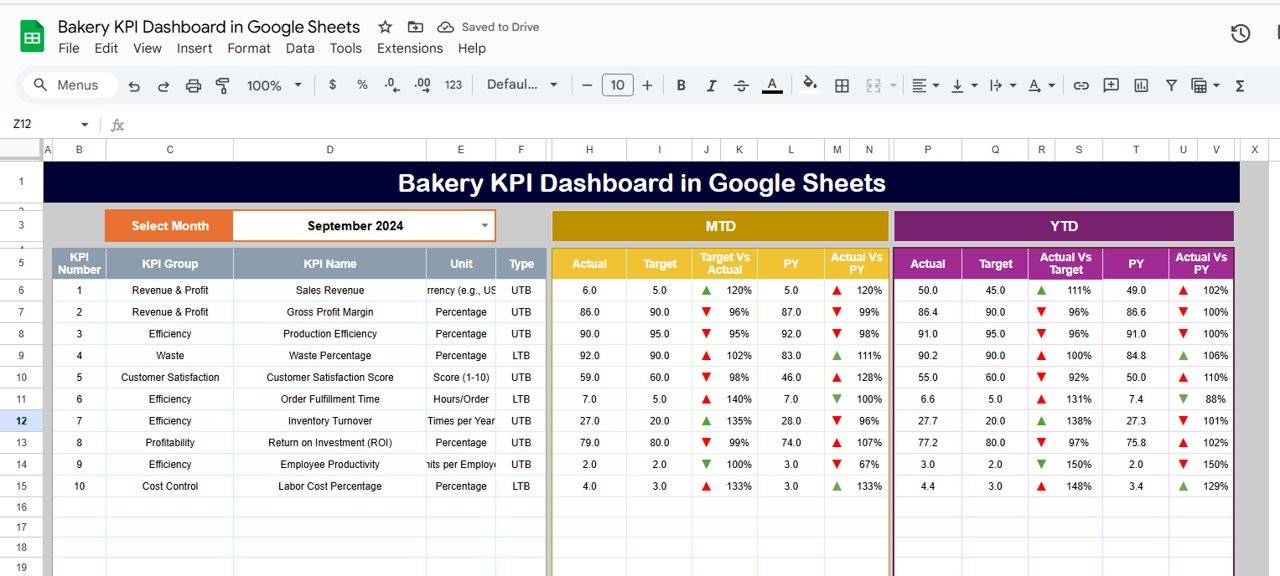
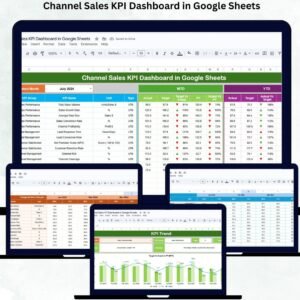
📊 Dashboard Sheet Tab
Your bakery’s performance at a glance!
-
Month Selection Dropdown (Range D3): Choose any month and see all dashboard data update automatically
-
MTD Metrics: Track actual, target, and previous year data with up/down performance arrows
-
YTD Metrics: View cumulative yearly performance for long-term insights
-
Dynamic Visuals: Charts highlight sales growth, production efficiency, and customer satisfaction
This tab acts as the control center of your bakery operations, showing all vital metrics in one easy-to-read view.
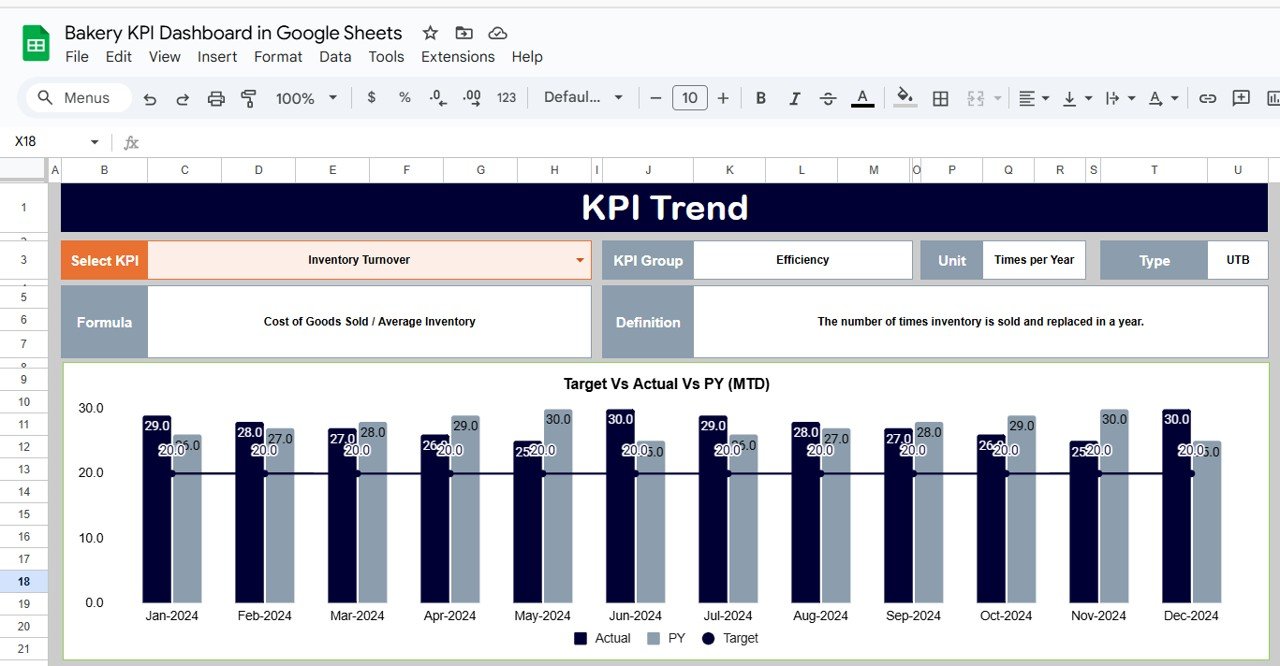
📈 KPI Trend Sheet Tab
Dive deep into performance analysis:
-
Select a KPI from the dropdown (Range C3)
-
View details like KPI Group, Unit, Type (UTB or LTB), Formula, and Definition
-
Analyze trend charts that display MTD, YTD, and previous year comparisons
Perfect for identifying seasonal performance patterns or improvement areas in sales and production.
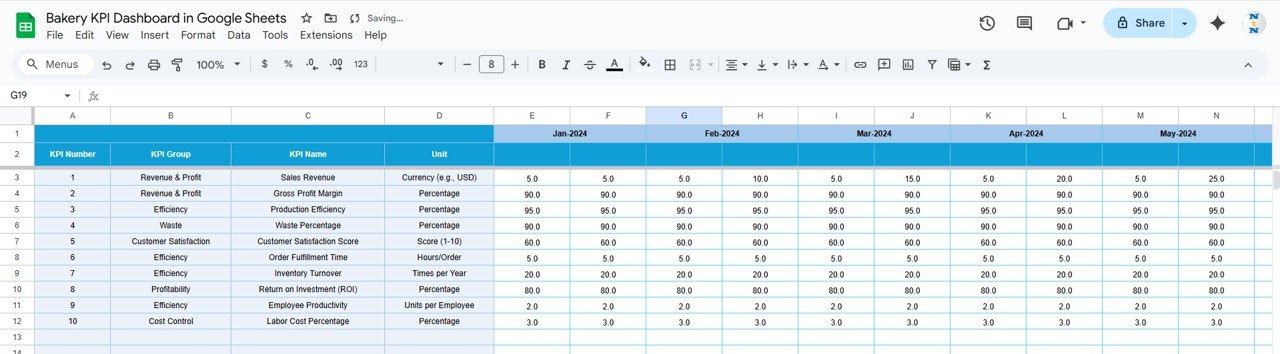
🧾 Actual Numbers Sheet Tab
Keep your metrics current with accurate data entry:
-
Input monthly MTD and YTD actuals
-
Adjust the first month of the year (Range E1) to update calculations automatically
-
Real-time updates reflect across all charts and dashboards
🎯 Target Sheet Tab
Plan your bakery goals effectively:
-
Enter monthly and yearly targets for every KPI
-
Compare actual results with these targets to evaluate performance
-
Stay aligned with business objectives throughout the year
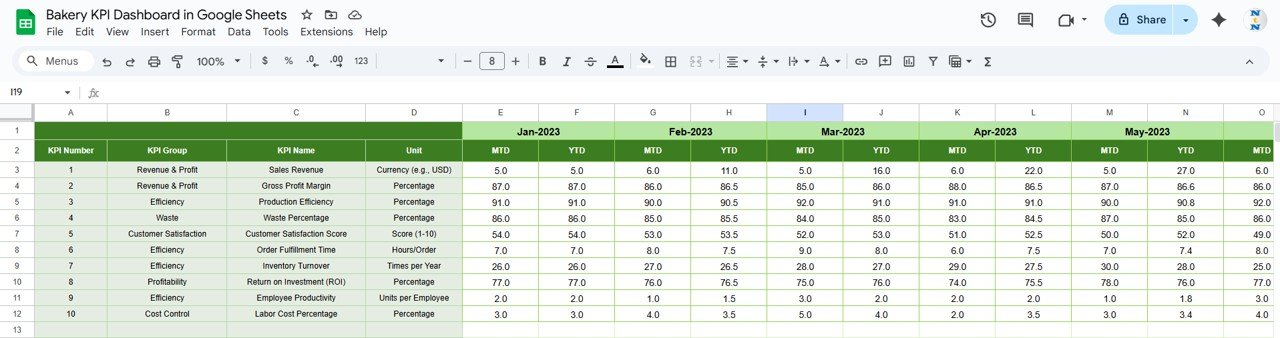
📉 Previous Year Numbers Sheet Tab
Track your growth and progress over time:
-
Enter last year’s KPI values for easy comparison
-
Analyze year-over-year improvements or seasonal changes
📘 KPI Definition Sheet Tab
Keep your performance indicators transparent and standardized:
-
Includes KPI Name, Group, Unit, Formula, Definition, and Type (UTB/LTB)
-
Ensures consistent understanding of every metric among team members
🍰 Examples of KPIs to Track in a Bakery
Here are some essential metrics your dashboard can track:
-
Total Sales ($): Total revenue from bakery items
-
Units Produced: Total number of goods baked
-
Waste %: Percentage of production wasted (Lower-the-Better)
-
Customer Satisfaction Score: Feedback ratings from customers
-
Orders Fulfilled On-Time (%): Measures timely delivery and reliability
-
Average Revenue per Customer ($): Indicates sales performance per transaction
-
Inventory Turnover: Tracks stock efficiency and product freshness
Each KPI includes a formula, unit, and performance type, helping bakery managers stay consistent in analysis.
💡 Advantages of Using the Bakery KPI Dashboard
✅ Centralized Data: Track all bakery operations in one Google Sheet
📊 Visual Insights: Interactive charts and color-coded visuals make performance clear
📈 Performance Tracking: Monitor MTD, YTD, and previous year results effortlessly
💰 Informed Decisions: Identify low-performing areas and take corrective action
⚙️ Customizable Design: Add or remove KPIs to suit your bakery’s unique structure
🕒 Time-Saving: Automated calculations and visualizations reduce manual reporting
🌍 Collaborative Access: Google Sheets allows real-time updates from multiple users
🧠 Best Practices for Using the Bakery KPI Dashboard
-
Update Regularly: Enter sales, production, and inventory data frequently
-
Segment KPIs by Product or Location: Analyze performance across multiple outlets or items
-
Monitor Historical Trends: Use trend charts to spot recurring issues or seasonal boosts
-
Set Smart Targets: Define realistic goals to track achievable progress
-
Use Conditional Formatting: Highlight underperforming KPIs automatically
-
Review with Team: Conduct monthly performance meetings using dashboard visuals
🎯 Who Can Benefit from This Dashboard?
👩🍳 Bakery Owners & Managers – Get a complete operational view
🏢 Operations Teams – Track efficiency and reduce waste
📈 Finance Managers – Analyze sales vs. expenses for profitability
🧁 Marketing Teams – Understand which products drive higher revenue
👨👩👧 Franchise Owners – Manage multiple bakery branches seamlessly
Whether you run a small local bakery or a large chain, this dashboard is your ultimate data management assistant.
🔗 Click here to read the Detailed blog post
Watch the step-by-step video Demo:


Reviews
There are no reviews yet.