


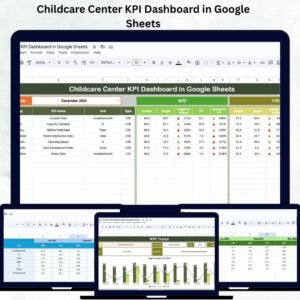
Running a childcare center requires balancing care quality, staff performance, and financial stability — all while ensuring a safe, nurturing environment for children. The Childcare Center KPI Dashboard in Google Sheets brings all these metrics together in one intuitive, ready-to-use tool.
This dynamic dashboard helps administrators, directors, and educators monitor key performance indicators (KPIs), visualize progress, and make informed, data-driven decisions. With built-in charts, dropdown filters, and automated calculations, it simplifies performance tracking while saving hours of manual reporting work.

🔑 Key Features of the Childcare Center KPI Dashboard in Google Sheets
🏠 1. Dashboard Sheet Tab
The Dashboard Sheet provides a complete snapshot of your childcare center’s monthly and yearly performance.
Highlights:
📅 Month Selection (Cell D3): Choose a month to view data dynamically.
📈 MTD (Month-to-Date) & YTD (Year-to-Date) Metrics: See performance at a glance.
📊 Actual vs Target vs Previous Year: Compare progress instantly.
🔺 Conditional Formatting: Up (↑) or Down (↓) arrows indicate improvement or decline.
⚡ Automatic Updates: All metrics refresh in real time when data changes.
This tab gives administrators immediate visibility into operational health, enrollment trends, and satisfaction levels.
📉 2. KPI Trend Sheet Tab
The KPI Trend Sheet allows you to dive deeper into performance analytics over time.
Features:
🎯 Select a KPI in cell C3 to view trends visually.
📘 Displays KPI Group, Unit, Formula, and Type (UTB or LTB).
📅 Monthly line or combo charts track progress throughout the year.
This view helps management identify long-term improvements and anticipate challenges early.
📋 3. Actual Number Sheet Tab
Use this tab to record MTD and YTD actual values for each KPI.
Define the fiscal year in cell E1.
Update data monthly for accurate tracking.
Auto-integrated with Dashboard and Trend views for real-time analysis.
Perfect for maintaining organized and up-to-date performance data.
🎯 4. Target Sheet Tab
Set measurable performance goals and track them effortlessly.
Define monthly and annual targets for each KPI.
Automatically compares Actual vs Target data.
Visual alerts for underperformance or goal achievement.
Helps align operational goals with strategic objectives.
📊 5. Previous Year Numbers Sheet Tab
This sheet holds prior-year data for year-over-year comparisons.
Measure growth rates, efficiency, and improvement patterns.
Quickly identify seasonal or recurring performance variations.
Ideal for evaluating progress and forecasting future performance.
🧾 6. KPI Definition Sheet Tab
This sheet serves as your KPI library, ensuring clarity and consistency across reporting.
Includes Columns For:
KPI Name
KPI Group (Operations, Finance, HR, Education, etc.)
Unit (% / $ / Count)
Formula
Definition
Type (UTB – Upper the Better / LTB – Lower the Better)
Maintaining a standardized KPI definition system enhances transparency across your team.
🌟 Advantages of Using the Childcare Center KPI Dashboard
📊 Centralized Data Tracking: Monitor financial, operational, and satisfaction metrics in one place.
⏱️ Real-Time Insights: Instantly analyze MTD, YTD, and YoY trends.
🎯 Target Comparison: Identify performance gaps with automatic variance indicators.
💡 Data Transparency: Consistent KPI definitions ensure aligned understanding.
🧠 Decision Support: Turn complex data into clear visuals for quick action.
🌐 Collaborative Access: Teams can view and update the dashboard simultaneously through Google Sheets.
💡 Best Practices for Using the Dashboard
✅ Update Data Monthly: Keep entries consistent for accurate reporting.
✅ Set SMART Targets: Define Specific, Measurable, Achievable, Relevant, and Time-bound goals.
✅ Review Quarterly Trends: Detect issues early and plan strategic improvements.
✅ Customize KPIs: Adjust metrics based on your center’s goals and scale.
✅ Engage Staff: Share dashboard insights to encourage accountability and collaboration.
✅ Use Conditional Formatting: Visualize KPIs that need immediate attention.
👩🏫 Who Can Use This Dashboard
🏫 Childcare Center Directors: Oversee operations and performance holistically.
👩💼 Administrators & Finance Teams: Monitor budget allocation and profitability.
🧑🏫 Teachers & Coordinators: Track training, compliance, and classroom performance.
👨👩👧 Parent Committees: Maintain transparency on quality metrics and satisfaction scores.
🚀 How This Dashboard Helps Childcare Centers
Tracks enrollment rates and capacity utilization.
Measures staff-to-child ratios for compliance and efficiency.
Monitors parent satisfaction to improve engagement.
Evaluates financial health with cost vs. revenue metrics.
Ensures training and safety standards are consistently met.
🔗 Click here to read the detailed blog post
Watch the step-by-step video Demo:





Reviews
There are no reviews yet.