

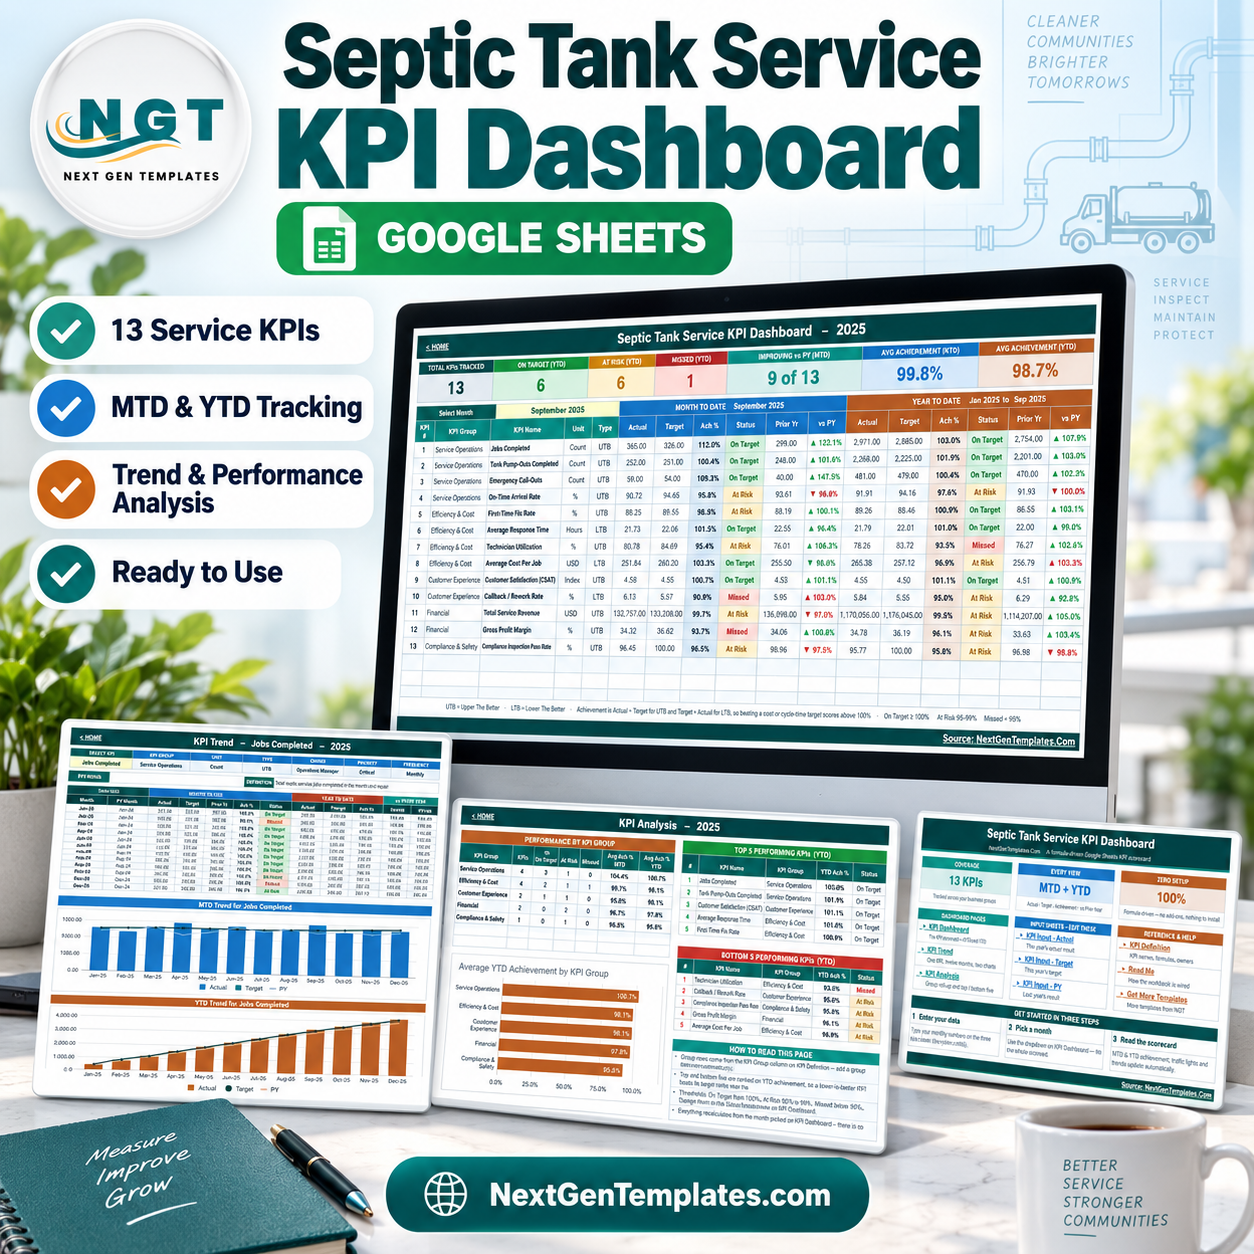

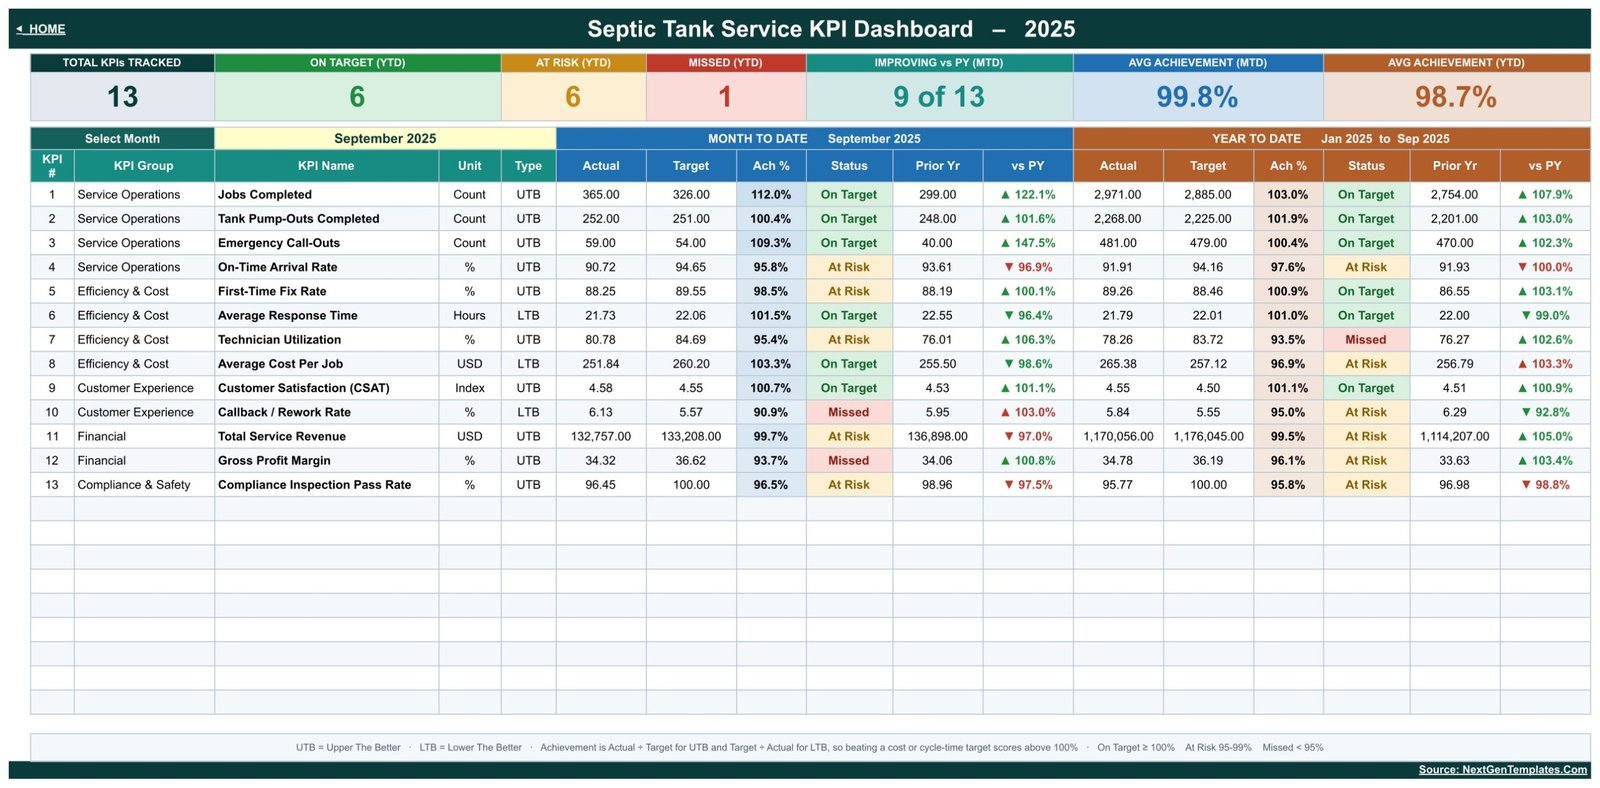
The Septic Tank Service KPI Dashboard in Google Sheets turns 13 monthly service metrics into one meeting-ready view. In the included September sample, 6 KPIs are on target YTD, 6 are at risk, 1 is missed, and 9 of 13 are improving against the prior year; average achievement is 99.8% MTD and 98.7% YTD. It covers operations, cost, customer experience, finance, and compliance without an add-on or subscription. Copy it to your own Google Drive, replace the sample numbers, and keep full control of the file. One-time purchase, instant download, and no recurring software fee.
Key Features of the Septic Tank Service KPI Dashboard in Google Sheets
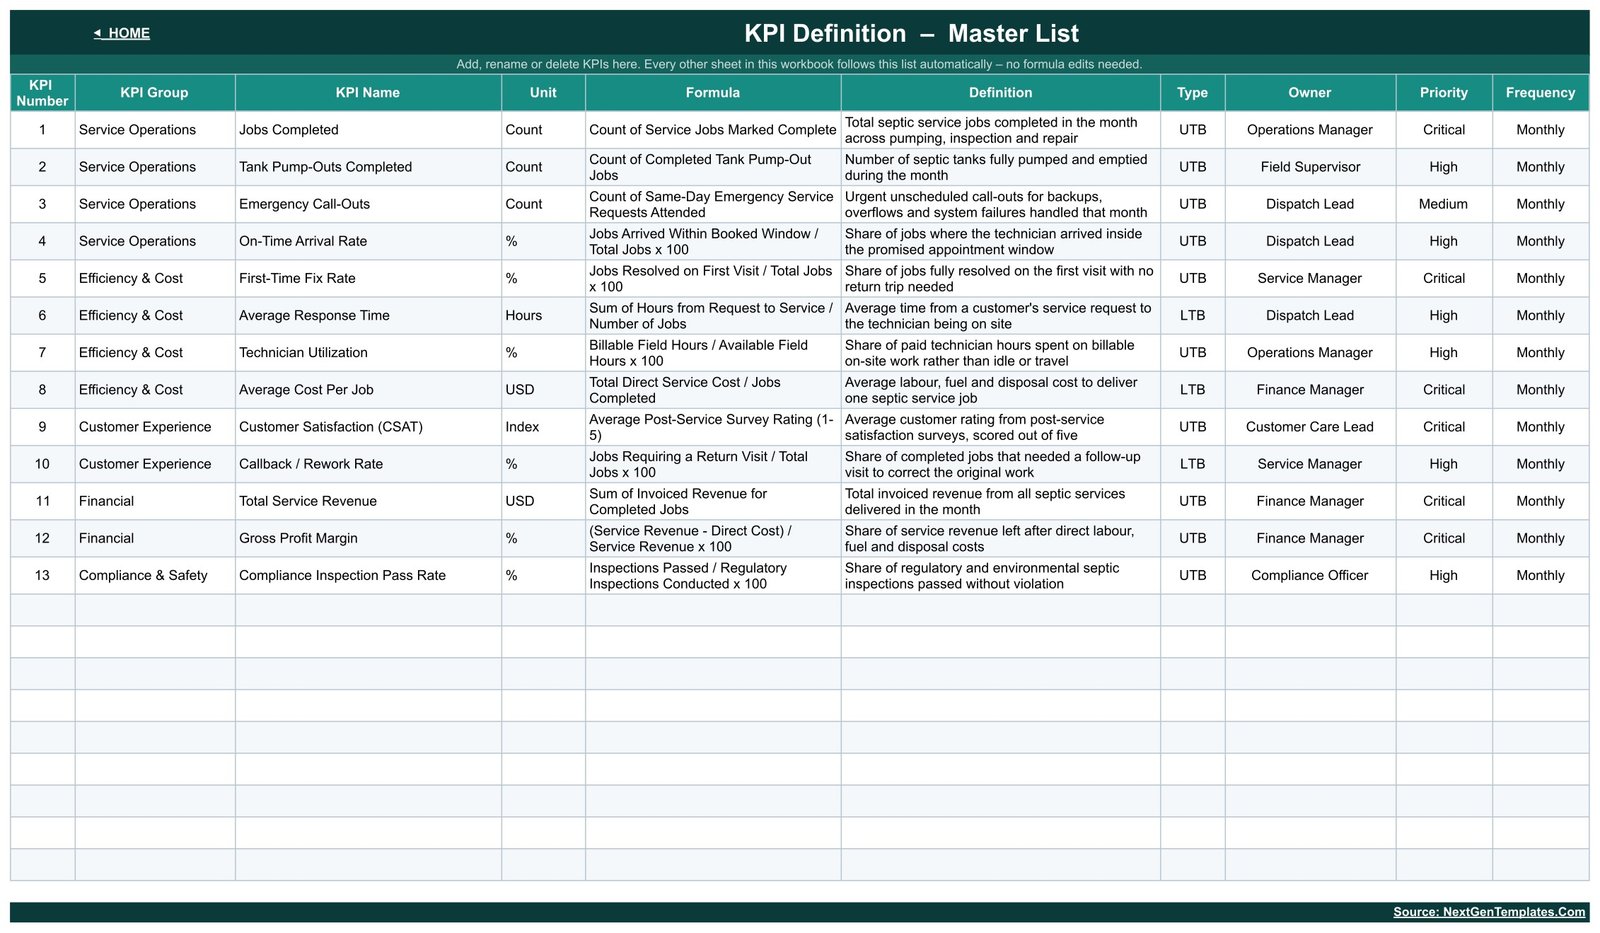
- 13 industry-specific KPIs across five business groups, with names, units, formulas, owners, priorities, frequencies, and plain-English definitions.
- Month-driven scorecard showing MTD and YTD actual, target, achievement, status, prior-year value, and comparison for every KPI.
- Direction-aware scoring for upper-the-better and lower-the-better metrics, including response time, cost per job, and callback rate.
- Automatic traffic-light status: On Target at 100% or above, At Risk from 95% to 99%, and Missed below 95%.
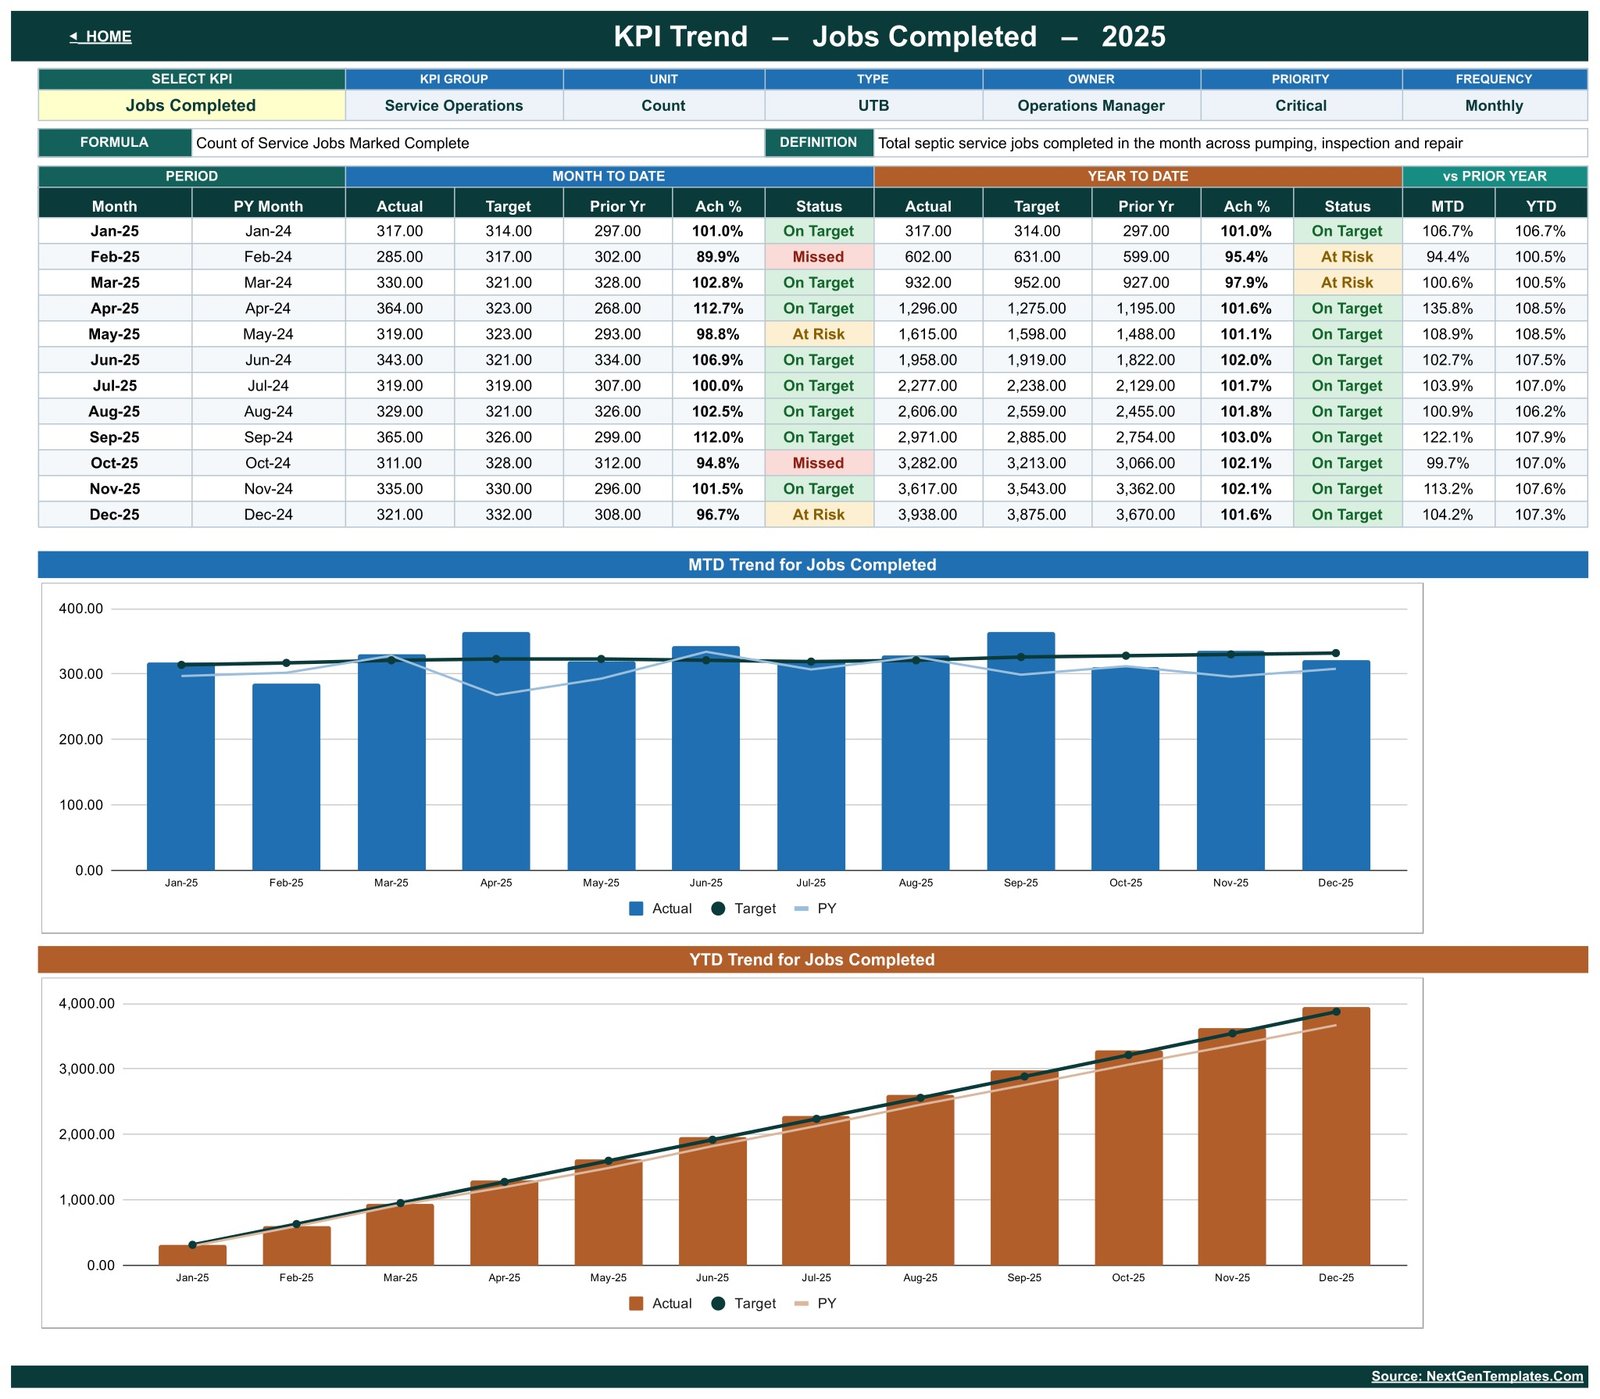
- Dedicated KPI Trend page with twelve-month MTD and YTD charts for a selected metric.
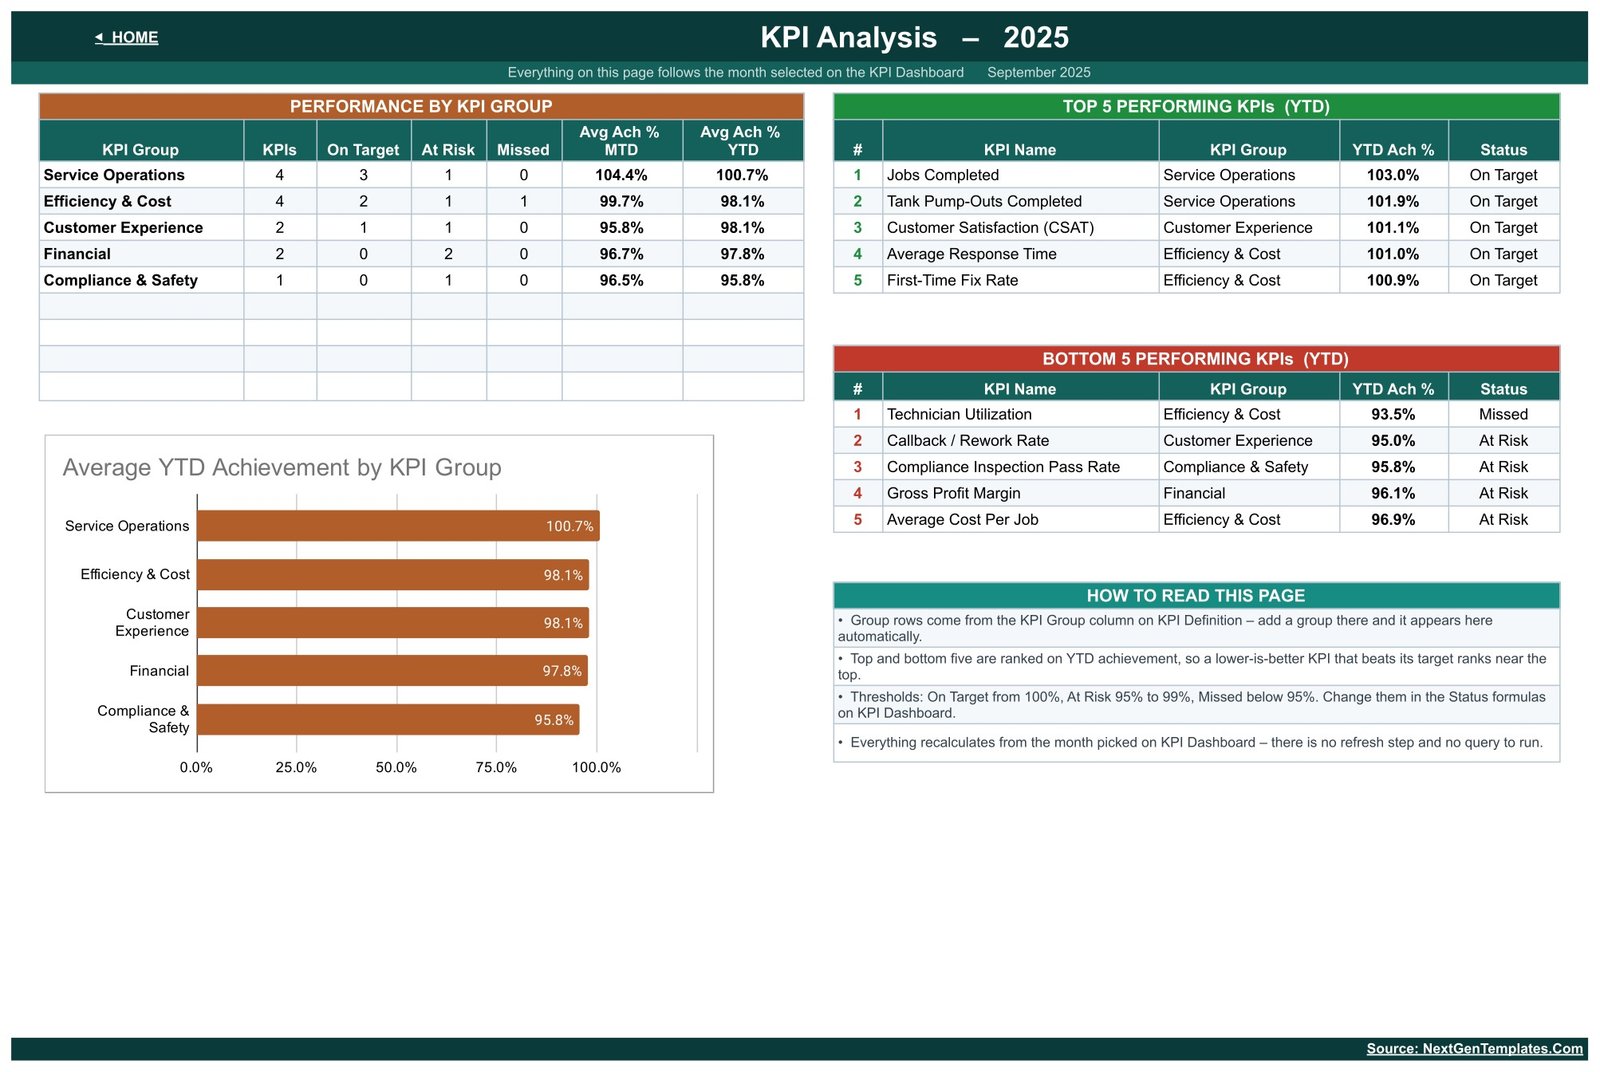
- KPI Analysis page with group roll-ups, average achievement, and top/bottom-five YTD rankings.
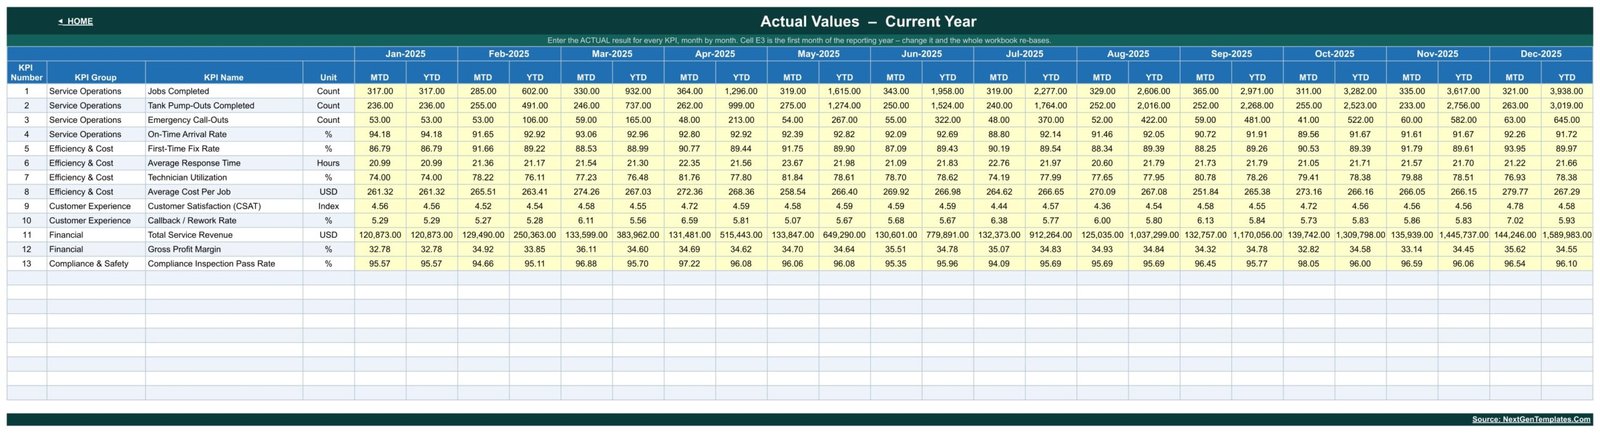
- Separate editable inputs for actuals, targets, and previous-year figures.
- Formula-driven Google Sheets design with no macros, scripts, add-ons, or refresh step.
What’s Inside the Septic Tank Service KPI Dashboard in Google Sheets
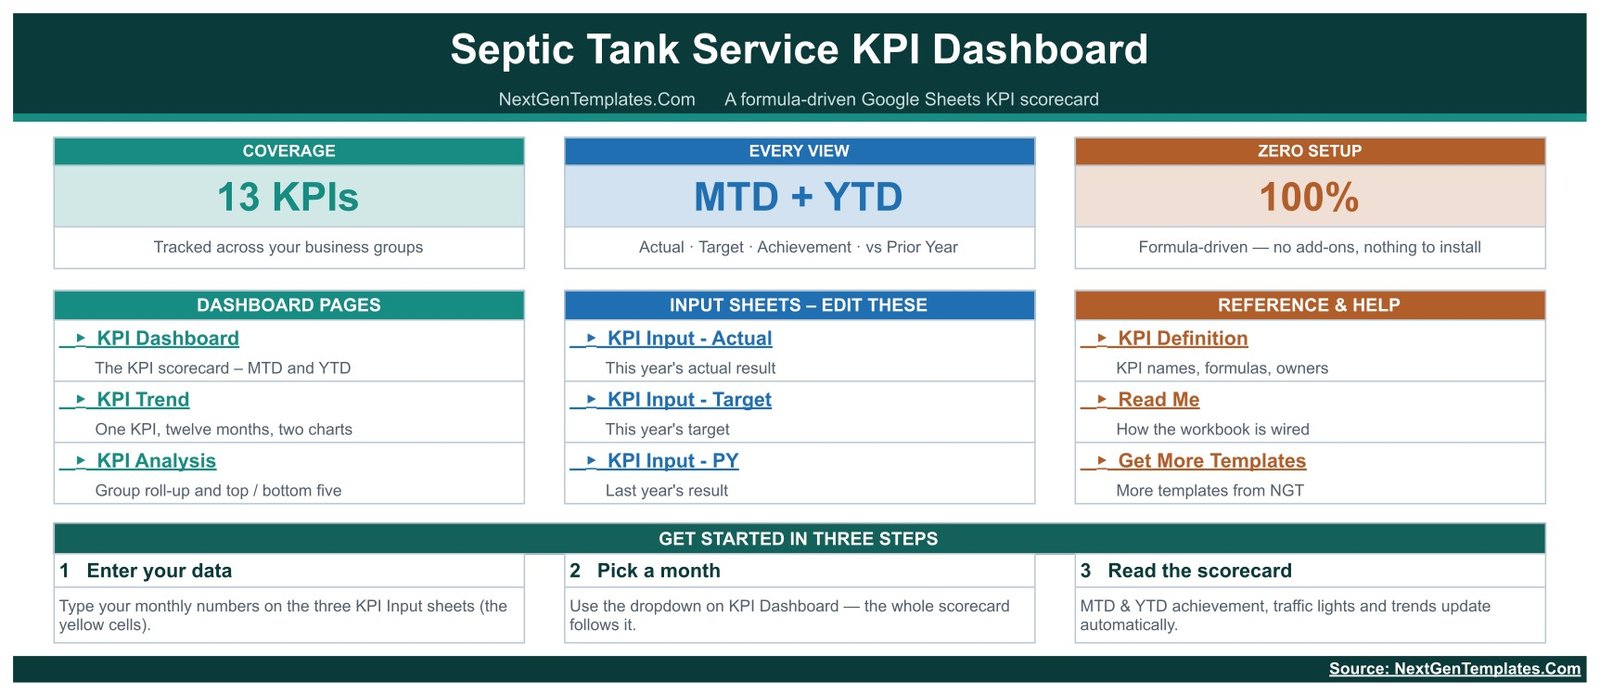
The file is organized around three dashboard pages, three input sheets, and reference/help tabs. KPI Dashboard is the main monthly scorecard. KPI Trend follows one selected metric across all twelve months. KPI Analysis rolls results up by group and ranks the best and weakest YTD results. The editable KPI Input – Actual, KPI Input – Target, and KPI Input – PY sheets keep data entry separate. KPI Definition is the master list, supported by Read Me and navigation tabs.
The 13 supplied metrics are Jobs Completed, Tank Pump-Outs Completed, Emergency Call-Outs, On-Time Arrival Rate, First-Time Fix Rate, Average Response Time, Technician Utilization, Average Cost Per Job, Customer Satisfaction (CSAT), Callback / Rework Rate, Total Service Revenue, Gross Profit Margin, and Compliance Inspection Pass Rate.
Septic Tank Service KPI Dashboard in Google Sheets vs. Excel vs. Paid Field-Service SaaS – Where This Fits
| Decision point | This Google Sheets dashboard | Excel dashboard | Paid field-service SaaS |
|---|---|---|---|
| Cost | One-time 13.99, 8.99 on sale | One-time purchase | Recurring monthly subscription |
| Platform | Browser-based Google Sheets | Microsoft Excel desktop | Vendor web/mobile app |
| Setup | Copy, replace monthly figures, select a month | Download and edit locally | Configuration and data migration |
| Team collaboration | Native real-time sharing | Depends on OneDrive setup | Usually included by paid seat |
| Custom fields | Editable KPI master list | Editable workbook structure | Limited by vendor plan |
| Dispatch, routing, invoicing | No | No | Often yes |
| Best use | Monthly company-level KPI review | Offline reporting | Live operational management |
Who This Template Is For – and Who It’s Not For
It fits septic pumping owner-operators, operations managers, dispatch leads, service managers, and finance staff who review company-level performance monthly. It is especially useful when the figures already exist in dispatch, accounting, inspection, or survey systems but the team needs one consistent scorecard.
It is not dispatch software, a customer database, an accounting integration, or a regulatory log. It does not schedule trucks, calculate routes, store permit records, or certify environmental compliance. If you need live job-level automation or regulator-ready records, use purpose-built software and retain the records required in your jurisdiction.
How to Use the Septic Tank Service KPI Dashboard in Google Sheets
- Open the downloaded PDF and use its link to create your own editable Google Sheets copy.
- Review the KPI Definition sheet; rename metrics, owners, units, and UTB/LTB types if your operation uses different definitions.
- Replace the yellow sample cells on the Actual, Target, and Previous Year input sheets.
- Select the reporting month on KPI Dashboard; the MTD/YTD scorecard updates automatically.
- Open KPI Trend for the metric that needs discussion, then use KPI Analysis to compare groups and priorities.
- Share the file with view or edit access using Google Sheets permissions.
Real-World Use Cases
Owner-operator monthly review
Priya runs four pump trucks and uses the headline cards to separate volume wins from service-quality risk before the first Monday meeting.
Dispatch and operations follow-up
Marcus sees On-Time Arrival Rate at risk and Average Response Time on target, then opens the trend page before changing staffing or routing decisions.
Finance and compliance summary
Elena reviews cost per job, service revenue, margin, and inspection pass rate together while retaining detailed accounting and compliance records in their proper systems.
Frequently Asked Questions
Do I need paid Google Workspace?
No. A standard Google account can make and edit a copy.
Does it update automatically?
Dashboard formulas update when you replace input values or change the selected month. It does not connect automatically to external systems.
Can I change the 13 KPIs?
Yes. Edit the KPI Definition master list and keep the same row structure; also check each metric’s UTB or LTB direction.
Can several people use it?
Yes. Use Google Sheets sharing and choose view, comment, or edit access.
Does this replace compliance records?
No. It is a management dashboard, not a permit, inspection, disposal, effluent, or regulatory record.
What do I receive?
You receive a PDF containing the link used to create your own editable Google Sheets copy.
About the Author
Built by PK – Microsoft Certified Professional with 15+ years of Excel, Google Sheets, and Power BI experience. Founder of NextGenTemplates, reaching 300K+ subscribers across YouTube channels. Every template is hand-built and tested before release.
Explore Related Templates
Compare the Septic Tank Service KPI Scorecard, Plumbing Business KPI Scorecard, HVAC Contractor KPI Scorecard, and Swimming Pool Service KPI Scorecard. Browse more Google Sheets KPI dashboards and the full Google Sheets template collection.
Ready to replace scattered monthly reports? Download the Septic Tank Service KPI Dashboard in Google Sheets, make your private copy, and start with the included 13-metric framework today.
Watch the step-by-step video Demo:
Last updated: September 2026.
Compatibility and Requirements
- Works in Google Sheets. You need a free Google account and a web browser.
- The file has no macros, scripts or add-ons, and you pick the reporting month on the KPI Dashboard sheet. Google explains getting started with Google Sheets.
More Questions About This Template
Is there an Excel or Power BI version?
Yes. See the Septic Tank Service KPI Dashboard in Excel and the Septic Tank Service KPI Dashboard in Power BI.
How are the three statuses decided?
A KPI is On Target at 100% achievement or above, At Risk from 95% to 99%, and Missed below 95%. Lower-the-better metrics such as Average Response Time, Average Cost Per Job and Callback / Rework Rate are scored in the right direction.
Which sheets do I edit each month?
Enter your figures on the KPI Input – Actual sheet, and update the KPI Input – Target and KPI Input – PY sheets when your goals or prior-year numbers change. The dashboard, trend and analysis pages read from those sheets.
Related Septic and Field Service Templates
- Septic Tank Service KPI Dashboard in Excel: the same 13 KPIs in Excel
- Septic Tank Service KPI Dashboard in Power BI: the Power BI edition
- Septic Tank Service KPI Scorecard in Google Sheets: a scorecard view of the same metrics
- Customer Service Performance Dashboard in Google Sheets: a service-quality view for customer-facing teams
Browse all Google Sheets KPI dashboards and the template bundles.

















Reviews
There are no reviews yet.