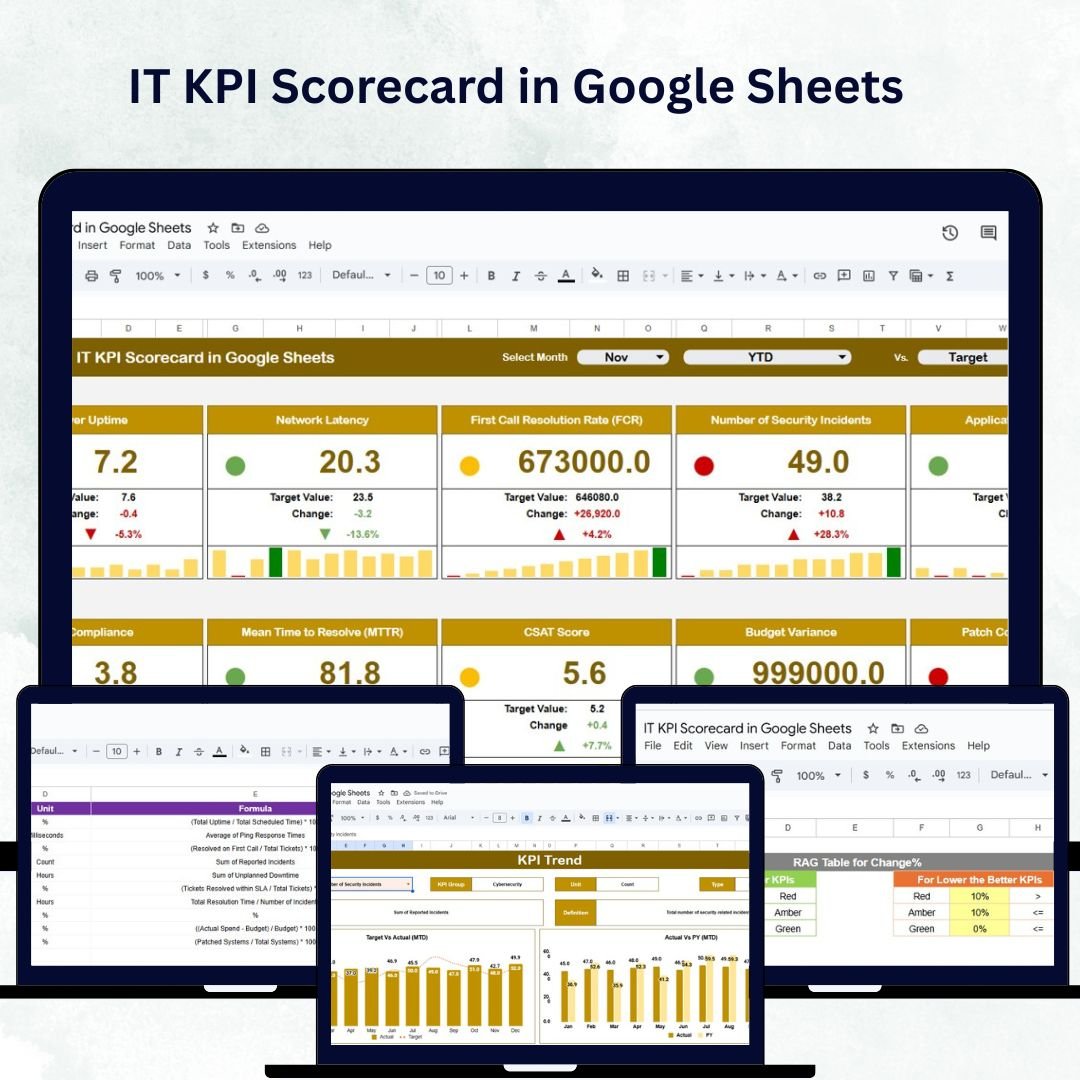
In today’s data-driven business world, IT departments are the backbone of efficiency, innovation, and security. However, tracking IT performance manually can be time-consuming and error-prone. The IT KPI Scorecard in Google Sheets is a ready-to-use, data-driven dashboard that empowers IT managers and business leaders to monitor performance metrics, analyze trends, and make informed decisions — all within one collaborative Google Sheets file. ⚙️📈
Designed for clarity, automation, and visual impact, this scorecard consolidates your IT performance data into color-coded dashboards, trend charts, and interactive views — helping you ensure that your IT strategy aligns perfectly with business goals.
🔑 Key Features of the IT KPI Scorecard in Google Sheets
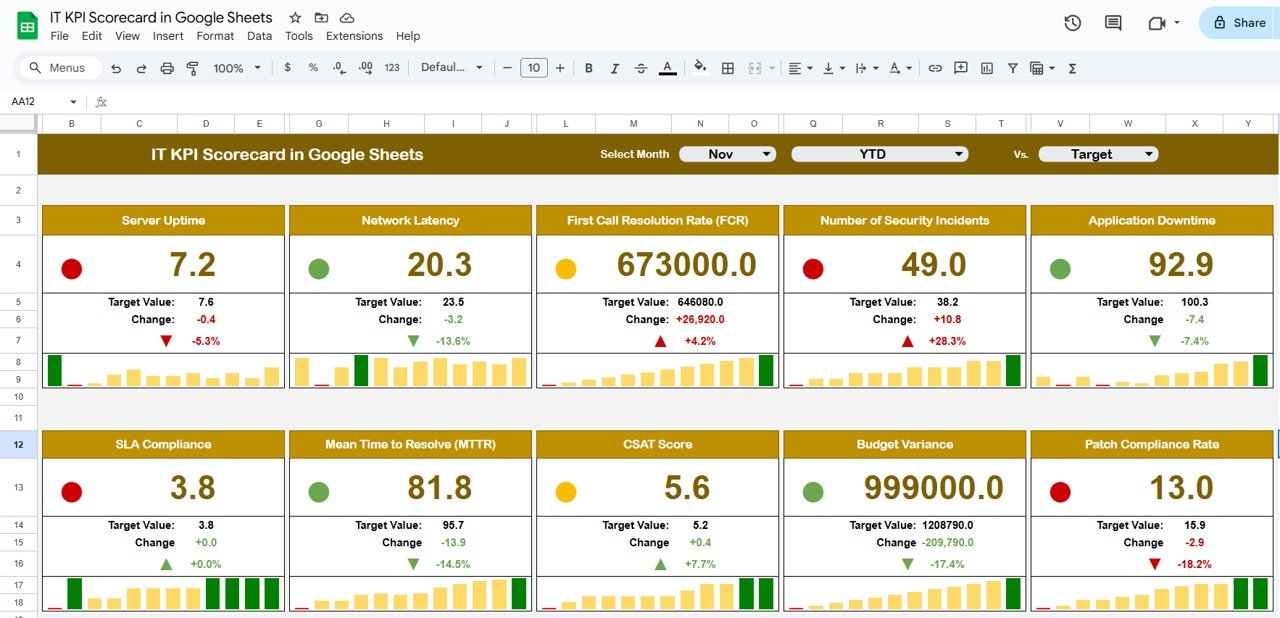
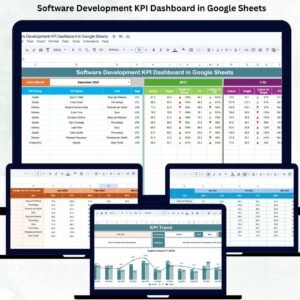
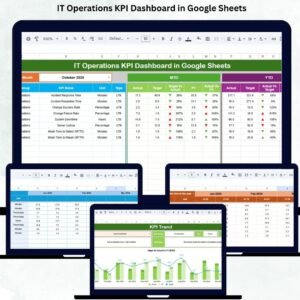
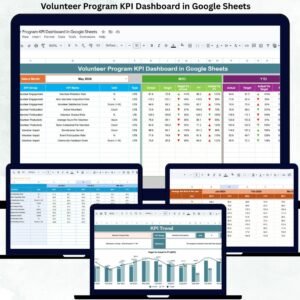
📋 Scorecard Sheet Tab
The central hub of your IT performance tracking system.
-
Month Dropdown (Cell D3): Select a month and see the entire dashboard update automatically.
-
Dynamic Indicators: Red, Yellow, and Green lights provide instant performance insights.
-
MTD vs YTD Toggle: Switch between Month-to-Date (MTD) and Year-to-Date (YTD) performance in one click.
-
Actual vs Target vs Previous Year: Quickly identify deviations and achievements.
-
Visual Performance Arrows: Green ▲ for improvement, Red ▼ for decline.
This interactive view allows IT teams to monitor performance at a glance — boosting awareness and accountability.
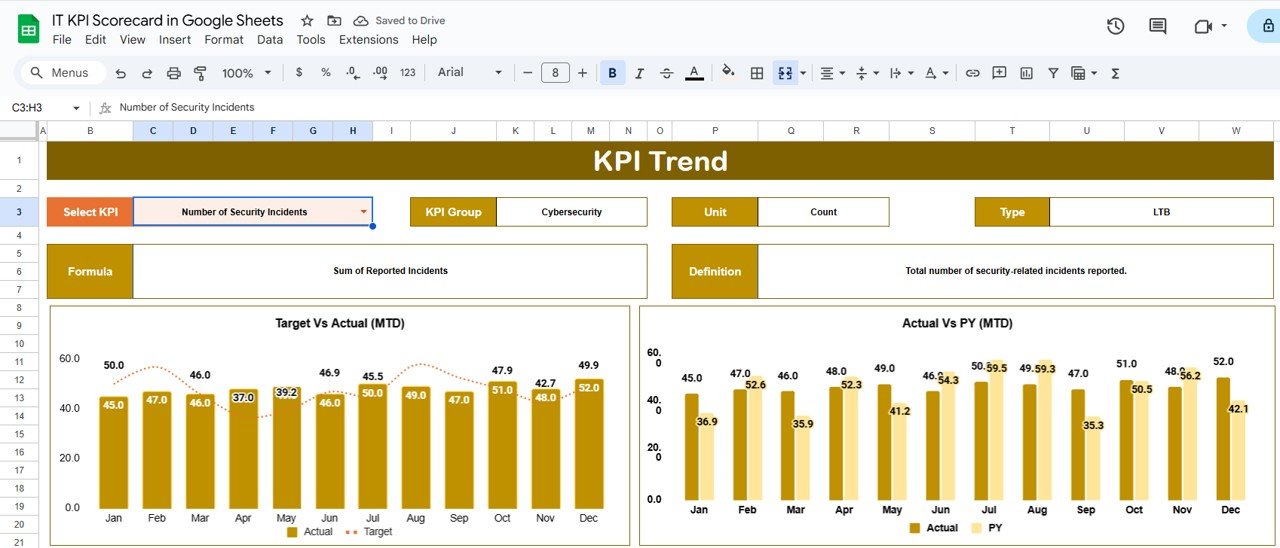
📈 KPI Trend Sheet Tab
Dive deeper into your KPI performance trends.
-
Choose a KPI from the dropdown (Cell C3).
-
View the KPI Group, Unit, Formula, and Type (UTB/LTB).
-
Analyze historical data and visual trend lines for both MTD and YTD.
-
Detect recurring issues or consistent improvements with precision.
Ideal for long-term IT performance reviews and root-cause analysis.
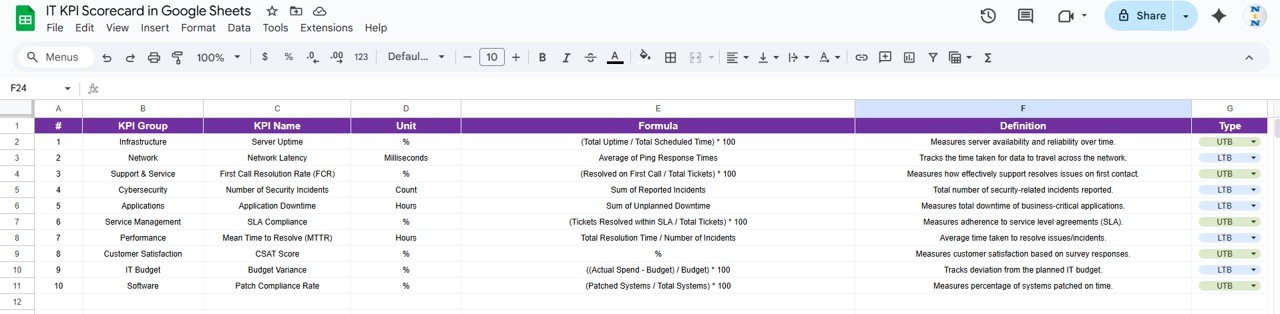
📖 KPI Definition Sheet Tab
Ensure every team member interprets metrics consistently.
-
Clearly defines each KPI — including Name, Group, Unit, Formula, and Definition.
-
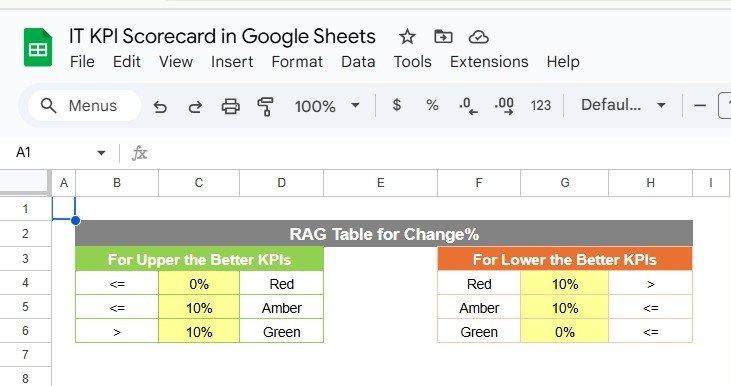
Identifies whether the KPI is Upper the Better (UTB) or Lower the Better (LTB).
-
Promotes alignment across teams and simplifies stakeholder reporting.
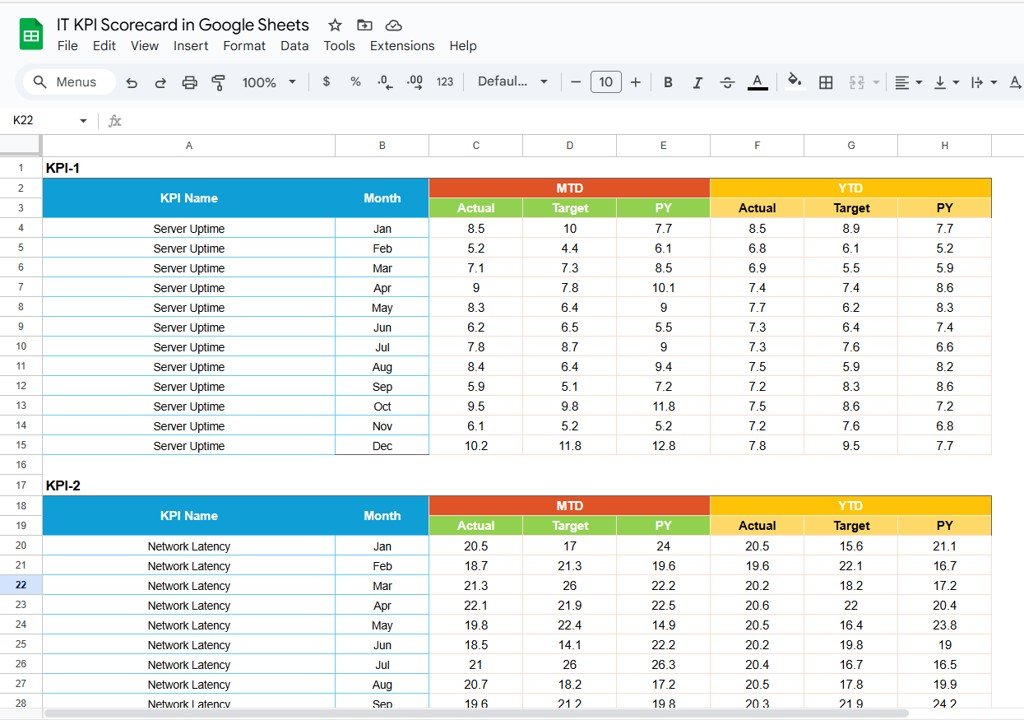
🧾 Data Input Sheet Tab
Where the performance data lives.
-
Record monthly Actual, Target, and Previous Year values for each KPI.
-
Data automatically flows into charts and dashboards.
-
Maintains consistency and eliminates manual calculation errors.
🎨 Color Settings Sheet Tab
Fully customizable visual settings.
-
Adjust thresholds for Red (Below Target), Yellow (Near Target), and Green (Above Target).
-
Modify arrow icons and background colors to suit your visual preference.
-
Keep your scorecard clean, branded, and easy to interpret.
📦 What’s Inside the IT KPI Scorecard Package?
✅ Scorecard Dashboard Sheet – Real-time visual overview of IT performance
✅ KPI Trend Sheet – In-depth analysis of KPI trends and variances
✅ KPI Definition Sheet – Transparent KPI structure for clarity and consistency
✅ Data Input Sheet – Centralized data entry and management
✅ Color Settings Sheet – Customizable appearance for professional reporting
✅ Sample Data Included – Preloaded example to demonstrate dashboard functionality
Everything is automated, intuitive, and ready to go — just plug in your IT metrics and start analyzing instantly. 🚀
👨💻 Who Can Benefit from This Scorecard?
💼 IT Managers & CIOs – Track performance, uptime, and system health.
⚙️ Network & Infrastructure Teams – Monitor incident resolution and response times.
📊 Project Management Offices (PMOs) – Analyze IT performance across projects.
🧠 Data Analysts & Consultants – Visualize performance trends across multiple KPIs.
🏢 Corporate Leaders – Get a clear snapshot of IT’s contribution to organizational success.
Perfect for both small IT teams and enterprise-level organizations managing multiple departments or service categories.
🧪 How to Use the IT KPI Scorecard in Google Sheets
-
Input Data: Add actual, target, and previous year numbers in the Data Input sheet.
-
Select Month: Use the dropdown in the Scorecard sheet to choose a reporting month.
-
Review Performance: Instantly view MTD/YTD comparisons and color-coded KPIs.
-
Analyze Trends: Use the KPI Trend sheet to examine progress over time.
-
Customize Settings: Adjust visuals and thresholds in the Color Settings tab.
Within minutes, your data transforms into a clear, professional, and interactive scorecard.
🌟 Why Choose This Scorecard?
-
Centralized view of IT metrics and performance
-
Real-time updates with built-in automation
-
Color-coded visuals for instant clarity
-
Flexible design for any IT department
-
Supports both MTD and YTD performance tracking
-
Fully collaborative through Google Sheets
-
No complex formulas or coding required
The IT KPI Scorecard in Google Sheets helps your IT department stay proactive, transparent, and aligned with organizational goals — all while saving hours of manual reporting. 🖥️📊
🔗 Click here to read the Detailed blog post
Watch the step-by-step video Demo:


Reviews
There are no reviews yet.