

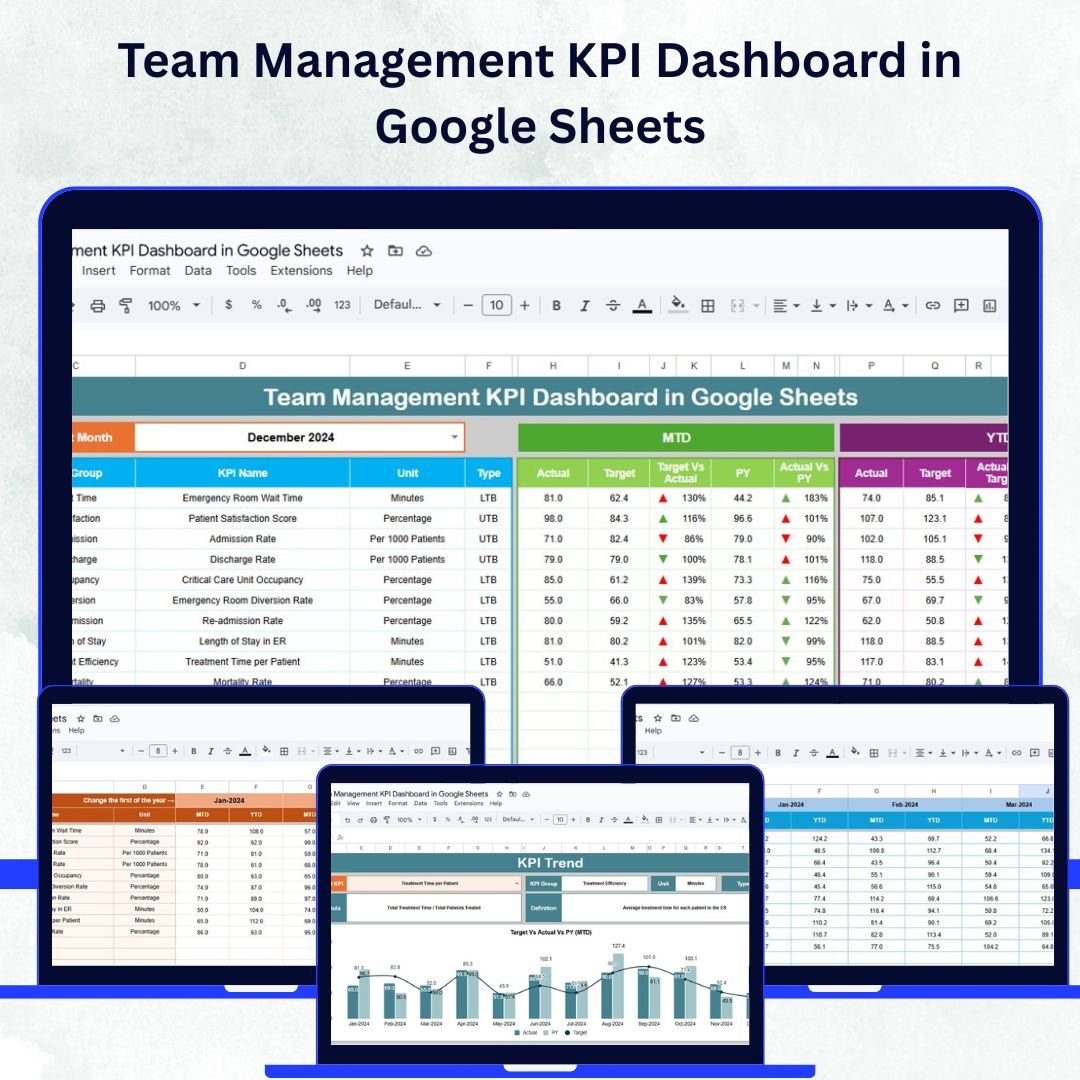

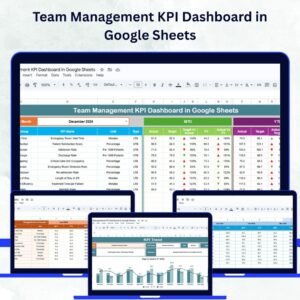
Managing a team effectively means understanding performance trends, spotting challenges early, and celebrating success through measurable results. The Team Management KPI Dashboard in Google Sheets is a ready-to-use solution that empowers managers to track, compare, and analyze team performance using real-time data and visual insights.
This interactive dashboard helps you consolidate all key metrics—such as productivity, attendance, response time, and project success—into a single, easy-to-read platform. With built-in charts, dynamic drop-downs, and automated comparisons, it simplifies complex reporting and supports smarter decision-making. 🚀
🔑 Key Features of the Team Management KPI Dashboard
📋 Dashboard Sheet Tab
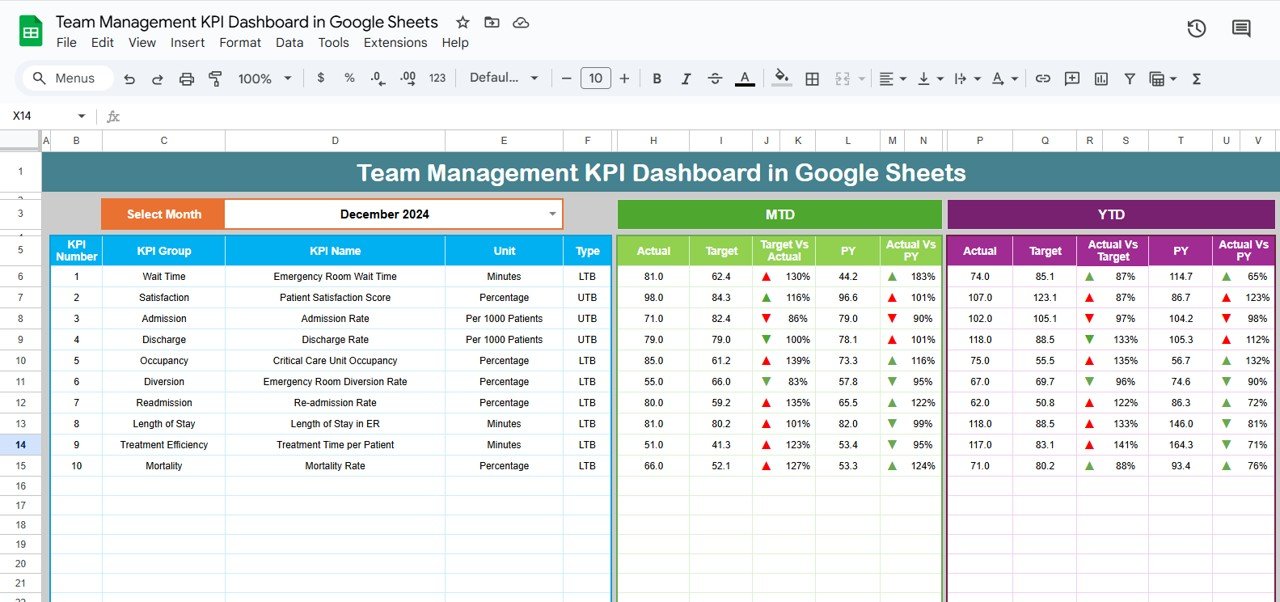
Dynamic Month Selector (D3): Automatically updates all KPI data for the chosen month.
MTD (Month-to-Date) & YTD (Year-to-Date) Metrics: Displays Actual, Target, and Previous Year values.
Visual Indicators: Conditional formatting arrows instantly highlight performance vs. target and prior year.
Comprehensive Overview: Quickly identify progress, challenges, and performance gaps in one view.
📊 KPI Trend Sheet Tab
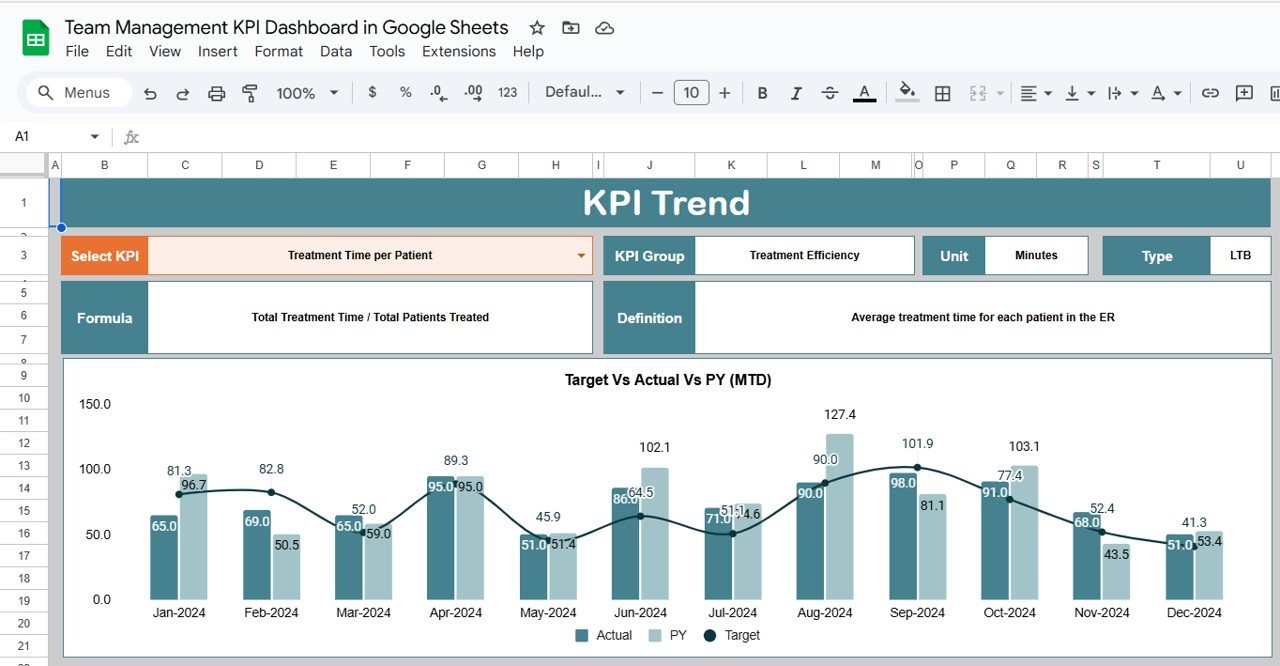
Select any KPI from a dropdown (C3) to view detailed performance data.
Displays KPI Group, Unit, Formula, and Type (Upper-the-Better or Lower-the-Better).
Provides trend charts to visualize improvement or decline over time.
📈 Actual Numbers Sheet Tab
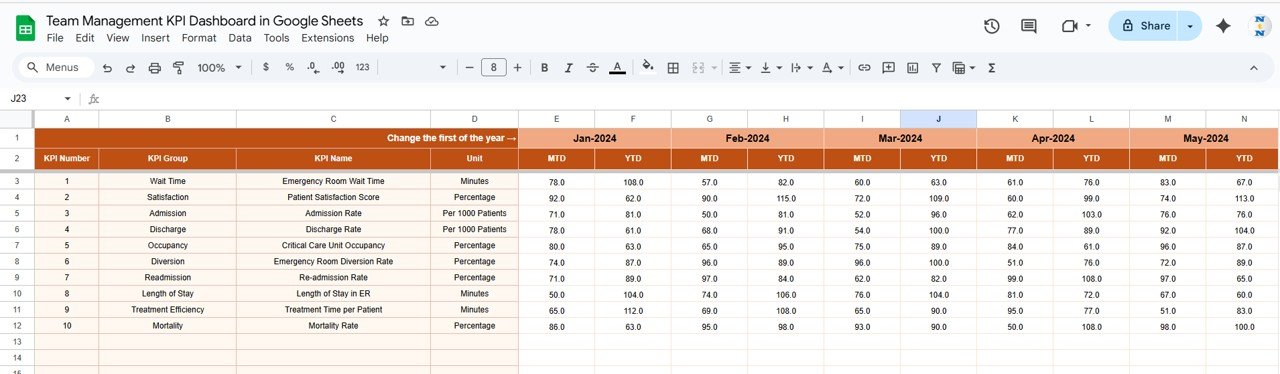
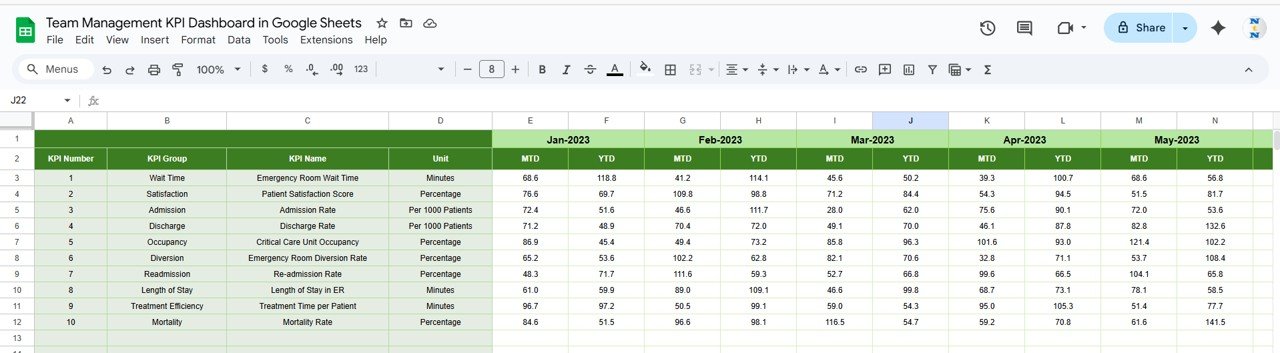
Input monthly and yearly performance figures for every KPI.
Changing the first month (E1) updates calculations across the dashboard.
Real-time reflection ensures accurate reporting and trend analysis.
🎯 Target Sheet Tab
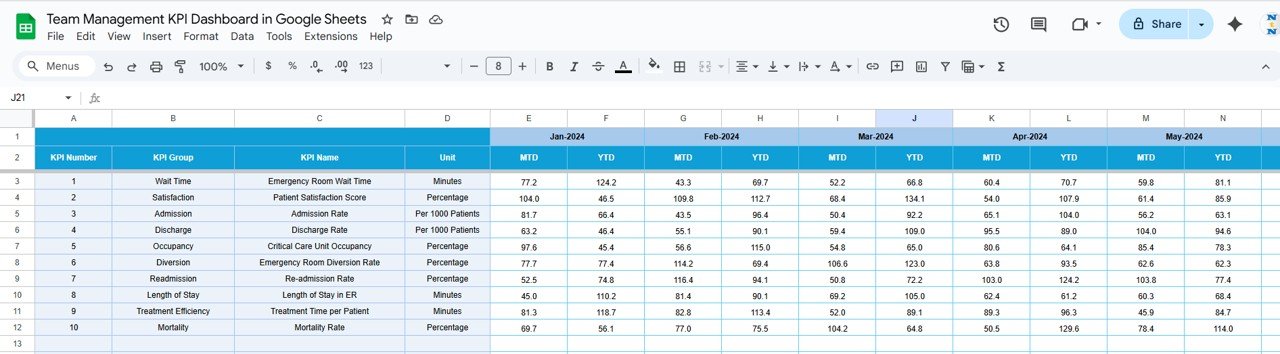
Enter monthly and YTD targets for each KPI.
Compare targets vs. actuals to identify achievement gaps.
Helps in goal-setting, resource planning, and progress tracking.
📉 Previous Year Numbers Sheet Tab
Record last year’s KPI values for comparison.
Track year-over-year growth or decline.
Understand seasonal trends and long-term improvements.
📖 KPI Definition Sheet Tab
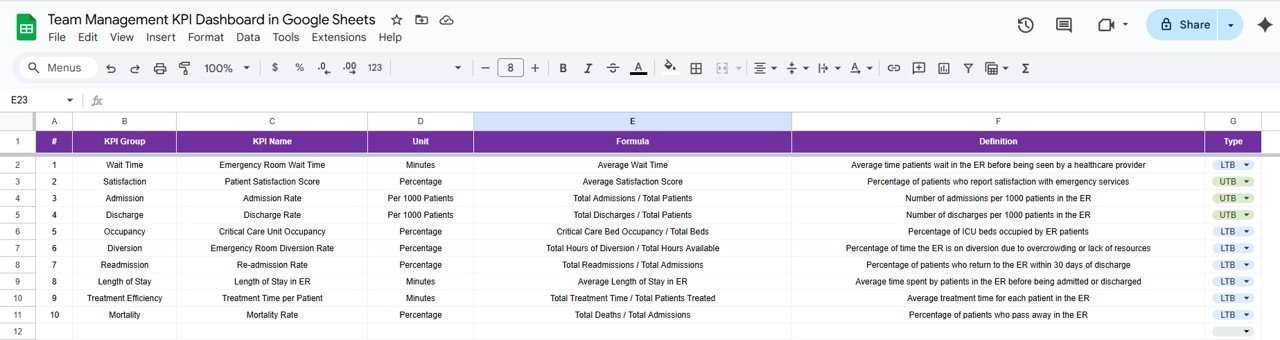
Maintain a standardized list of all KPIs with name, unit, formula, and type.
Ensures team-wide clarity on how each KPI is calculated.
Avoids confusion and keeps reporting consistent across teams.
📦 What’s Inside the Dashboard?
When you download this Google Sheets template, you’ll get:
✅ A fully automated KPI Dashboard with charts and indicators
✅ KPI Trend Tracker to visualize monthly performance
✅ Actual, Target, and Previous Year sheets for structured analysis
✅ A KPI Definition guide for standardization
✅ Pre-filled sample data for quick setup
✅ A customizable layout to fit your organization’s needs
🧑💼 Who Can Benefit from This Dashboard?
🎯 Team Managers – Track performance and identify productivity gaps
🎯 HR & Operations Leaders – Evaluate attendance, engagement, and training metrics
🎯 Project Managers – Monitor project success rates and task completion
🎯 Executives – Gain a clear view of department-level performance
🎯 Startups & SMEs – Simplify team tracking without costly BI tools
🧪 How to Use the Team Management KPI Dashboard
Enter Actual Data: Update the Actual Numbers Sheet regularly with team performance metrics.
Set Monthly Targets: Define targets in the Target Sheet for clear performance goals.
Add Previous Year Data: Include last year’s figures for year-over-year tracking.
View Dashboard: Select the desired month to see MTD and YTD results with auto-updated visuals.
Analyze Trends: Explore the KPI Trend Sheet to identify improvement opportunities.
Review KPI Definitions: Ensure all users understand the KPIs for consistency.
It’s intuitive, collaborative, and requires no technical skills — simply update the data and let the dashboard do the analysis! ⚡
🌟 Why Choose This Dashboard?
Centralized tracking for all key team metrics
Real-time MTD and YTD performance comparisons
Visual progress indicators for quick insights
Fully customizable and scalable for any team size
Enables smarter, data-driven leadership decisions
Google Sheets-based — no installations or complex software needed
With the Team Management KPI Dashboard in Google Sheets, you can enhance visibility, boost accountability, and turn performance data into actionable insights. 🌟
🔗 Click here to read the Detailed blog post
Watch the step-by-step video Demo:
🔗 Visit our YouTube channel to learn step-by-step video tutorials
Compatibility and Requirements
- Works in Google Sheets. You need a free Google account and a web browser.
- The month and KPI selectors are dropdowns. Google explains them in Create an in-cell dropdown list.
Frequently Asked Questions
Which sheet tabs are included?
Dashboard, KPI Trend, Actual Numbers, Target, Previous Year Numbers and KPI Definition.
How do I review a month?
Pick the month in the selector on the Dashboard tab. MTD and YTD actual, target and previous year values update for that month.
Which team metrics can I track?
Metrics such as productivity, attendance, response time, project success, task completion and training completion.
How do I see a single KPI over time?
Select the KPI from the dropdown on the KPI Trend tab to see its group, unit, formula, type and trend charts.
Is it available for other platforms?
Yes. The same dashboard is available in Excel and Power BI.
Related Team Management Templates
- Team Management KPI Dashboard in Excel: the same KPIs in Excel
- Team Management KPI Dashboard in Power BI: the same KPIs in Power BI
- Team Availability Calendar in Google Sheets: plan who is available when
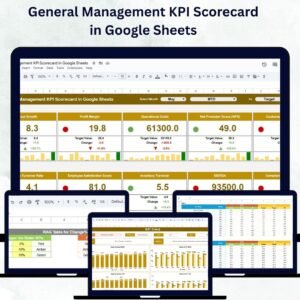
- General Management KPI Scorecard in Google Sheets: a wider management scorecard
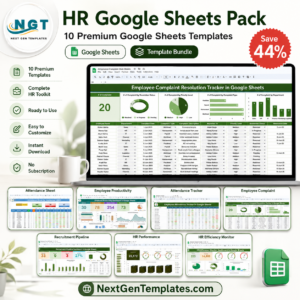
- HR Google Sheets Pack: 10 HR templates for Google Sheets in one download
Browse all Google Sheets KPI dashboards or the Google Sheets HR and Payroll templates.





Reviews
There are no reviews yet.