


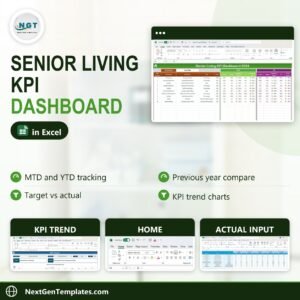
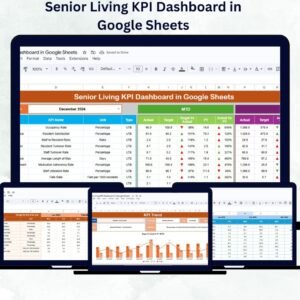
Running a senior living facility involves balancing compassionate care with operational excellence. The Senior Living KPI Dashboard in Google Sheets is a ready-to-use, data-driven tool that empowers administrators and managers to monitor performance metrics across resident care, staffing, occupancy, and finances—all from a single, easy-to-navigate dashboard.
Built entirely in Google Sheets, this dashboard offers automated calculations, dynamic visuals, and month-to-date (MTD) and year-to-date (YTD) insights, helping decision-makers take timely and informed actions. It’s the perfect blend of simplicity, functionality, and precision for senior living operations.
🔑 Key Features of the Senior Living KPI Dashboard in Google Sheets
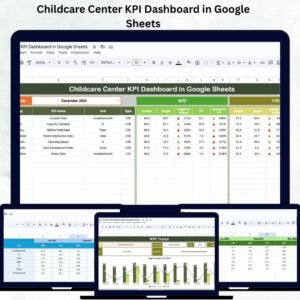
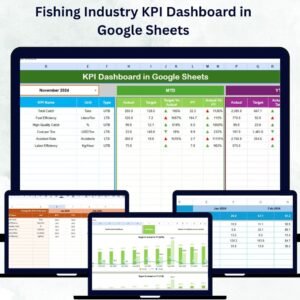
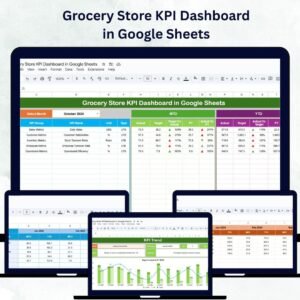
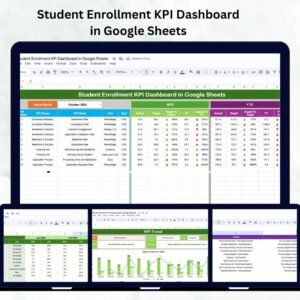
📊 Dashboard Sheet Tab
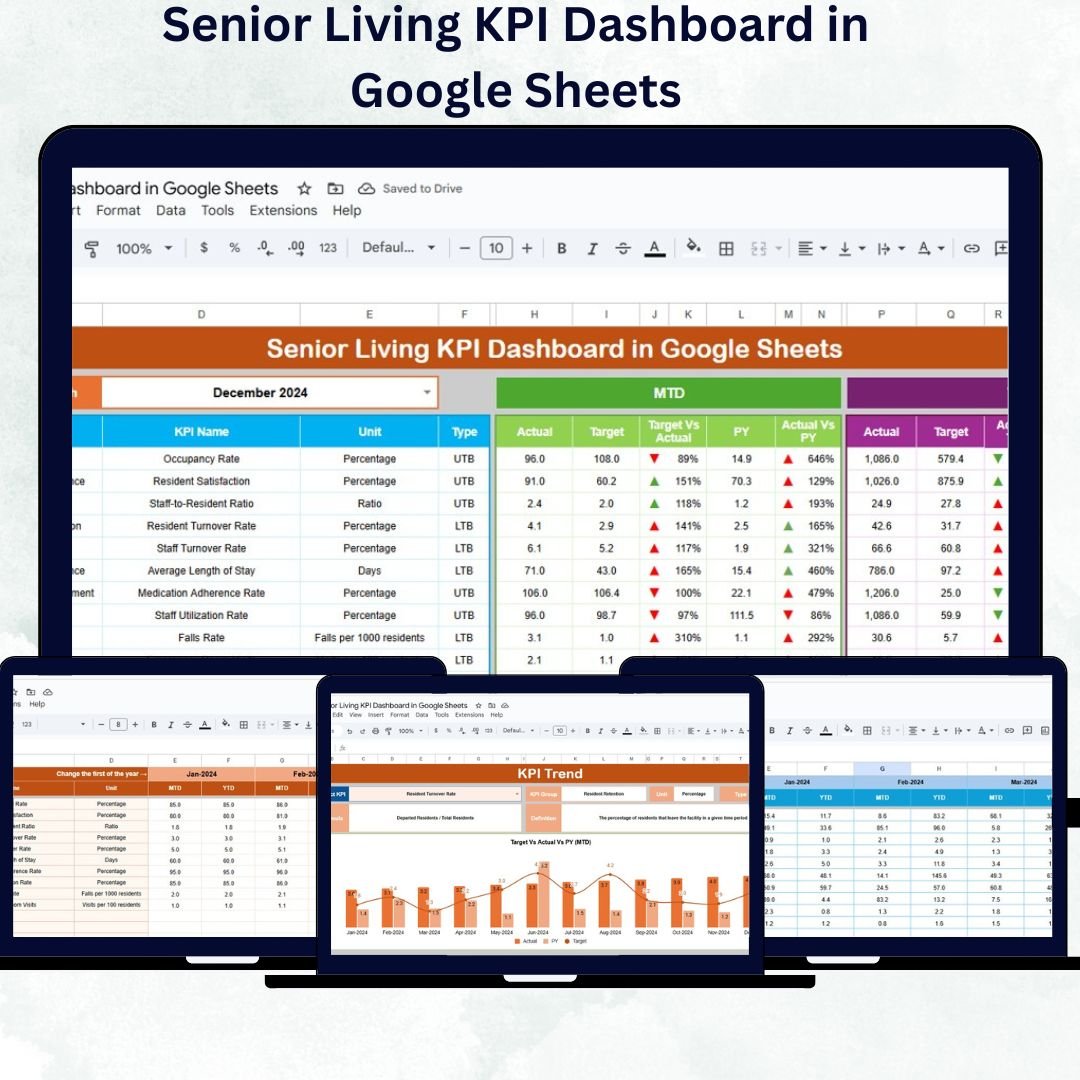
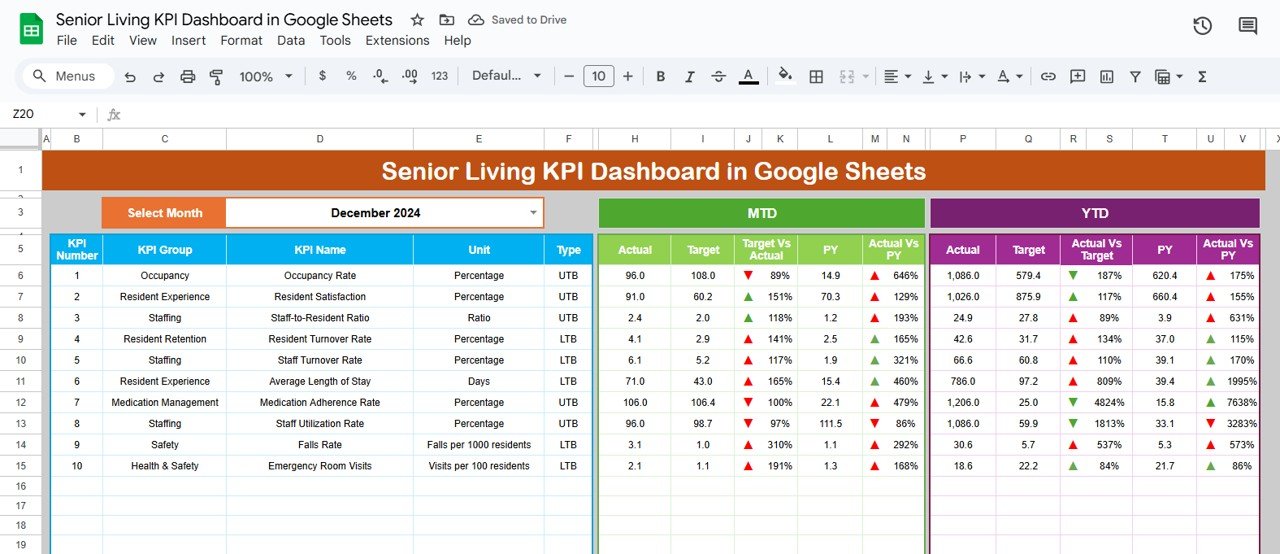
The main dashboard brings all your performance data together in one clean, visual layout.
Month Selector (Cell D3): Choose any month to refresh all visuals and metrics dynamically.
MTD & YTD Analysis: Automatically compare actuals vs. targets and previous year data.
Conditional Formatting: Visual arrows (green ▲ for improvement, red ▼ for decline) highlight progress or setbacks instantly.
Comparisons: Target vs. Actual and Current Year vs. Previous Year metrics for quick performance evaluation.
This sheet provides a complete snapshot of your facility’s health—both operational and financial.
📈 KPI Trend Sheet Tab
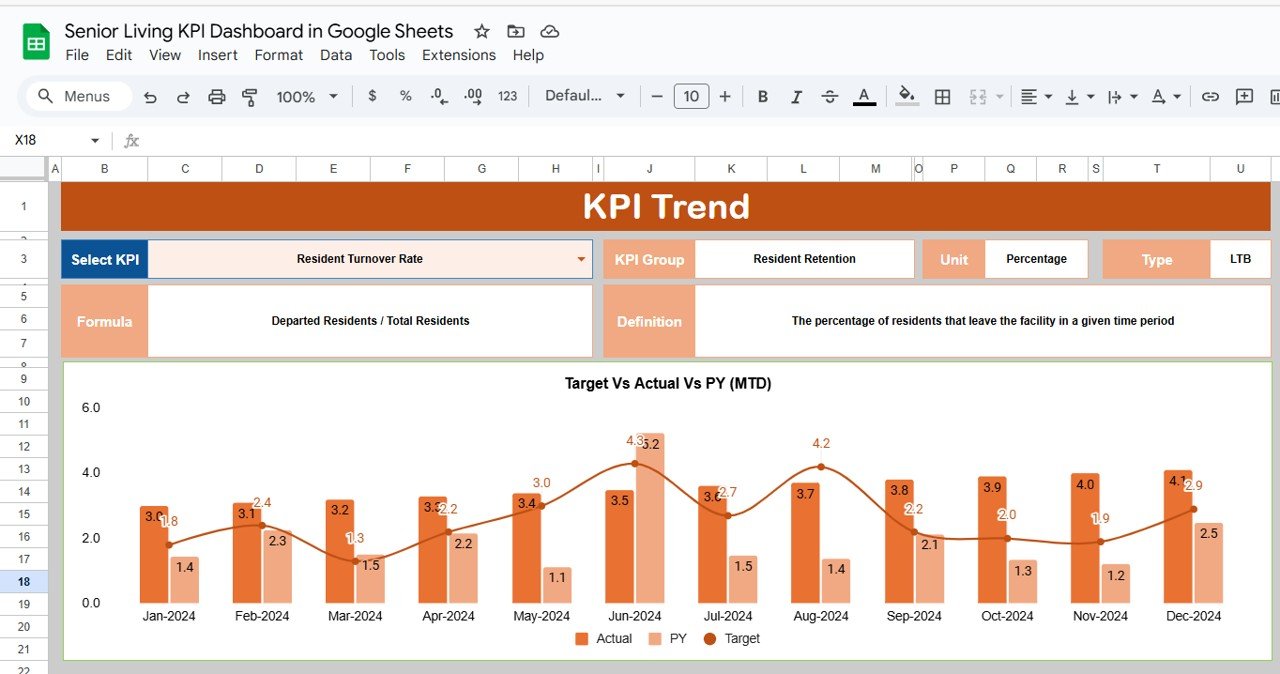
Track trends over time and analyze how your facility performs month by month.
Dropdown Selection (Cell C3): Choose any KPI to view its trend.
Displays KPI Group, Unit, and Type (UTB/LTB).
Charts: Dynamic visualizations showing monthly progress.
This feature helps you identify long-term patterns in occupancy, satisfaction, and performance.
📋 Actual Numbers Sheet Tab
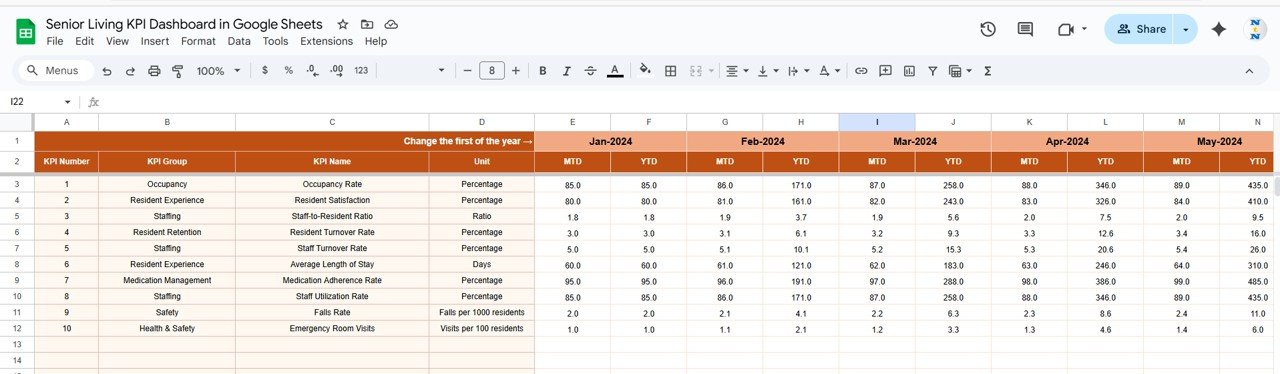
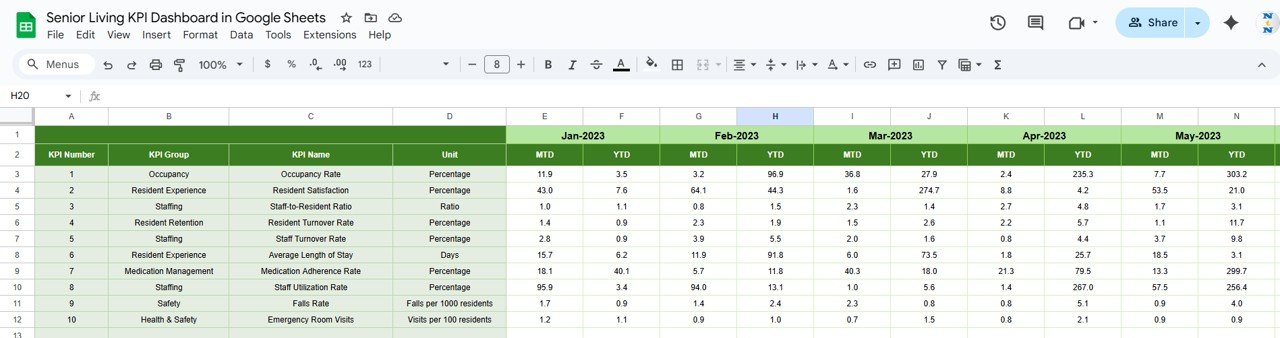
Enter MTD and YTD values for all KPIs.
Update the first month of the year in cell E1 to automatically adjust calculations.
Seamlessly integrates with dashboard visuals for real-time updates.
🎯 Target Sheet Tab
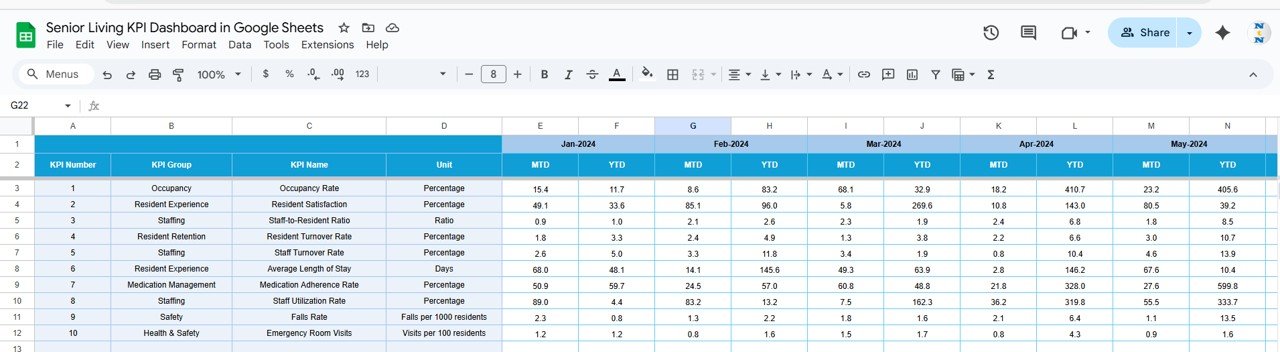
Input MTD and YTD targets for all KPIs.
Compare planned vs. actual data to measure achievement levels.
Useful for setting goals aligned with operational priorities.
📆 Previous Year Numbers Sheet Tab
Maintain last year’s data to monitor year-over-year growth.
Provides a foundation for strategic analysis and trend comparison.
📘 KPI Definition Sheet Tab
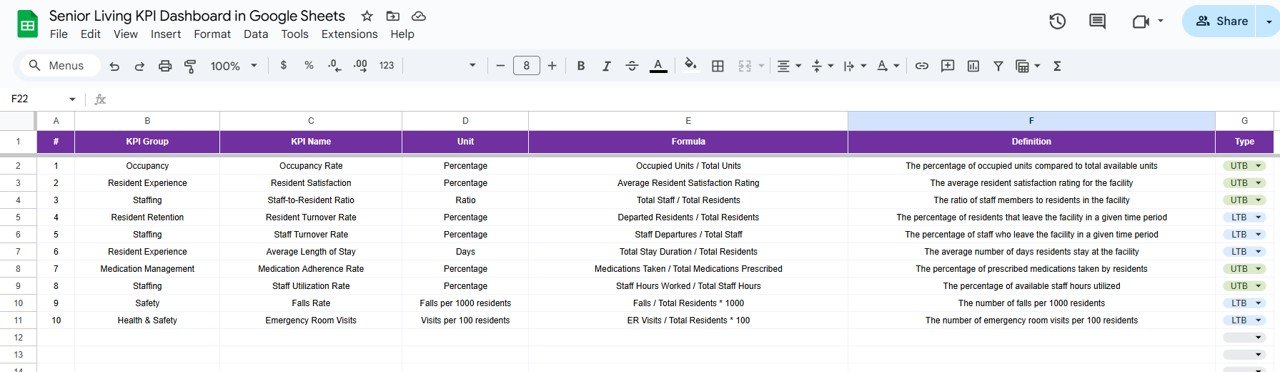
Define KPIs with key details like Name, Group, Unit, Formula, Definition, and Type (UTB/LTB).
Ensures every department interprets performance metrics consistently.
📦 What’s Inside the Template
✅ Dashboard Tab: Visual overview with MTD/YTD summaries and performance indicators
✅ KPI Trend Tab: Line charts and progress views across months
✅ Actual Numbers Sheet: Centralized data entry for KPIs
✅ Target Sheet: Goal-setting and benchmarking
✅ Previous Year Sheet: Historical comparison tracking
✅ KPI Definition Sheet: Detailed KPI references for transparency
This dashboard is your go-to performance management tool for senior living operations — blending healthcare quality monitoring with financial oversight.
👩💼 Who Can Use This Dashboard
🏥 Facility Administrators: Track overall performance and compliance standards.
👩⚕️ Nursing Directors: Monitor care quality metrics and incident rates.
📊 Finance Teams: Manage budgets, costs, and profitability KPIs.
👨💼 Operations Managers: Oversee occupancy, staffing, and service efficiency.
👵 Multi-Facility Operators: Compare performance across multiple locations.
🧠 How to Use the Senior Living KPI Dashboard
Input Data: Enter actual monthly KPI values in the Actual Numbers Sheet.
Set Targets: Record expected MTD and YTD figures in the Target Sheet.
Compare Performance: Review the Dashboard tab for color-coded visual insights.
Analyze Trends: Use the KPI Trend sheet to evaluate performance month-over-month.
Review Results: Share findings with leadership and staff for better decision-making.
The dashboard updates automatically — no manual calculations or additional setup required.
🌟 Advantages of Using the Dashboard
🏢 Centralized Data View: Manage all care, staffing, and financial KPIs in one sheet.
⏱ Real-Time Insights: Instantly see performance against targets.
📊 Visual Clarity: Intuitive charts and conditional formatting make data easy to interpret.
💬 Collaborative Access: Google Sheets allows multiple users to update simultaneously.
⚙️ Customizable Metrics: Add new KPIs that fit your unique operational structure.
💡 Strategic Decision Support: Identify strengths and areas needing improvement quickly.
This tool helps senior living facilities achieve excellence in care delivery, occupancy management, and cost control—all through one simple interface.
🧩 Best Practices
✅ Update data monthly for accurate MTD/YTD tracking.
✅ Define clear, realistic KPI targets for each department.
✅ Use the KPI Trend Sheet for quarterly or annual reviews.
✅ Involve department heads in maintaining their KPIs.
✅ Leverage color-coded visuals to prioritize improvement areas.
🏆 How It Helps Senior Living Management
Improves Care Quality: Monitor resident satisfaction and service metrics.
Optimizes Resource Allocation: Balance occupancy and staffing levels.
Enhances Financial Oversight: Compare budgets and expenditures efficiently.
Boosts Accountability: Assign clear KPI ownership across departments.
Promotes Continuous Improvement: Identify trends early and take corrective actions.
🔗 Click here to read the Detailed blog post
Watch the step-by-step video Demo:
🔗 Visit our YouTube channel to learn step-by-step video tutorials
Compatibility and Requirements
- Works in Google Sheets. You need a free Google account and a web browser.
- The dashboard uses dropdowns to pick a month or KPI. Google explains them in Create an in-cell dropdown list.
Frequently Asked Questions
How do I change the month?
Pick a month in cell D3 of the Dashboard sheet. All visuals and metrics refresh for that month.
Does it compare against targets and last year?
Yes. It shows MTD and YTD actuals against targets and against previous year numbers, with green and red arrows.
Can I see one KPI over time?
Yes. Choose a KPI from the dropdown in cell C3 of the KPI Trend sheet to see its monthly chart.
Where do I define each KPI?
The KPI Definition sheet holds the name, group, unit, formula, definition and type of every KPI.
Is there an Excel version?
Yes. The Senior Living KPI Dashboard in Excel works in Excel.
Related Senior Care Templates
- Senior Living KPI Dashboard in Excel: the same topic in Excel
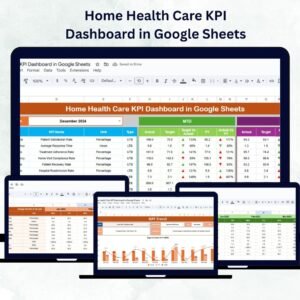
- Home Health Care KPI Dashboard in Google Sheets: track home care services
- Nursing Homes KPI Dashboard in Excel: KPIs for nursing homes
- Senior Living KPI Scorecard in Excel: a scorecard view of senior living KPIs
- Healthcare & Hospital Management Bundle: 8 healthcare templates in one download
Browse all Google Sheets KPI dashboards.






Reviews
There are no reviews yet.