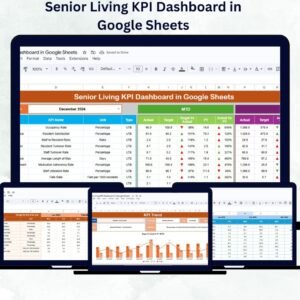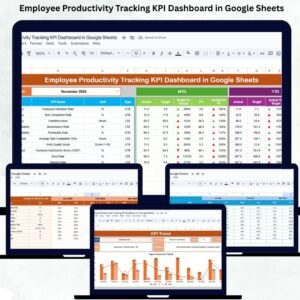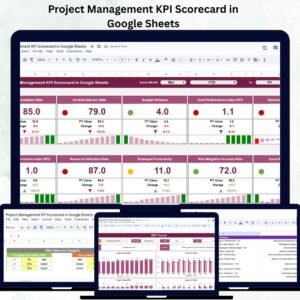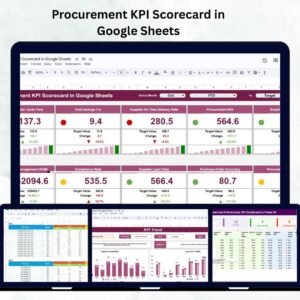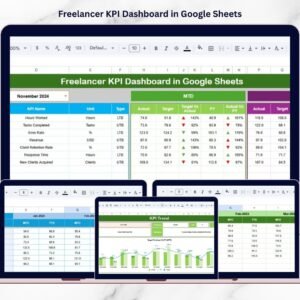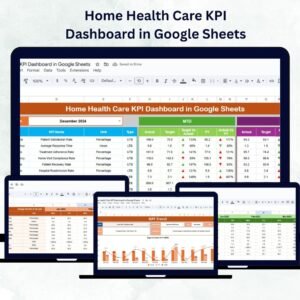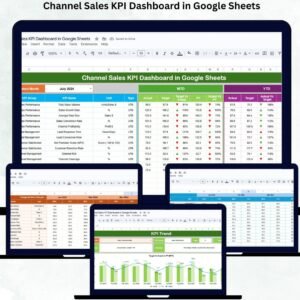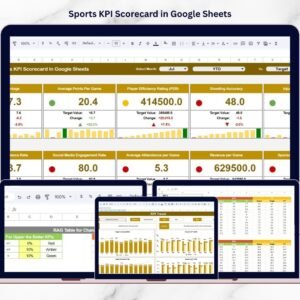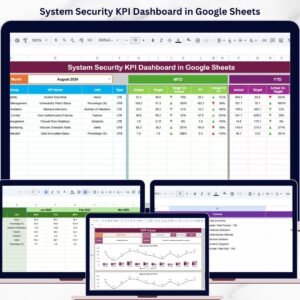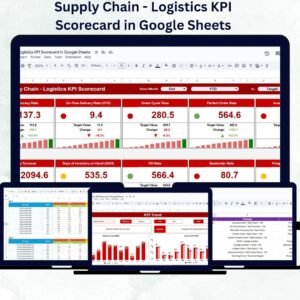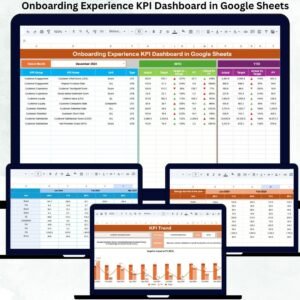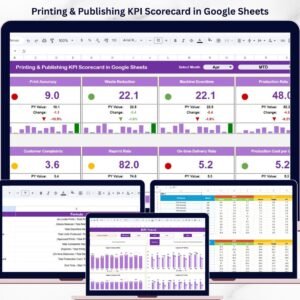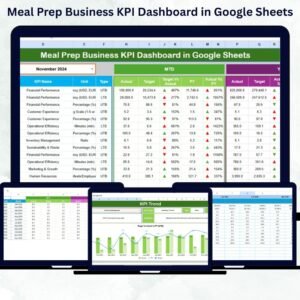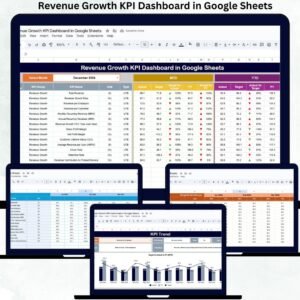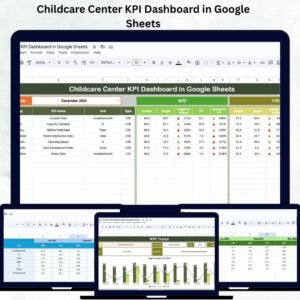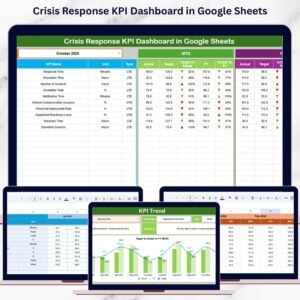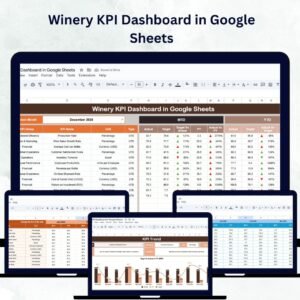
Running a successful winery involves monitoring every stage — from grape harvest to bottle sales. The Winery KPI Dashboard in Google Sheets is a ready-to-use performance tracking tool designed to simplify this process. It consolidates all critical business data — including production, sales, inventory, quality, and distribution — into one interactive dashboard that updates dynamically.
Whether you manage a vineyard, winery, or distribution company, this dashboard helps you make data-driven decisions that improve efficiency, boost sales, and maintain product quality. Built in Google Sheets, it’s fully collaborative, cloud-based, and customizable to your winery’s unique operations. 🍇🏷️
🔑 Key Features of the Winery KPI Dashboard in Google Sheets
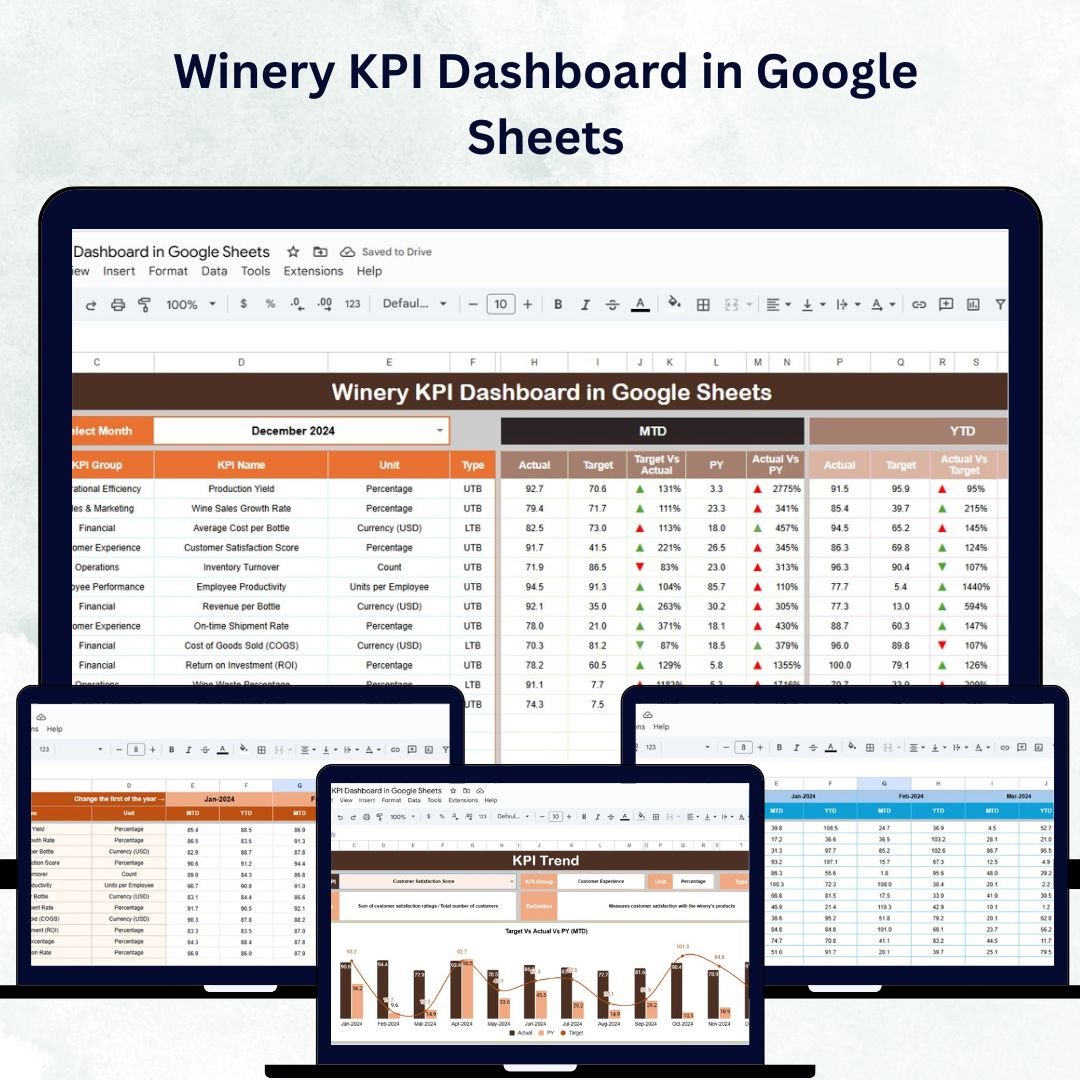
📊 Dashboard Sheet Tab
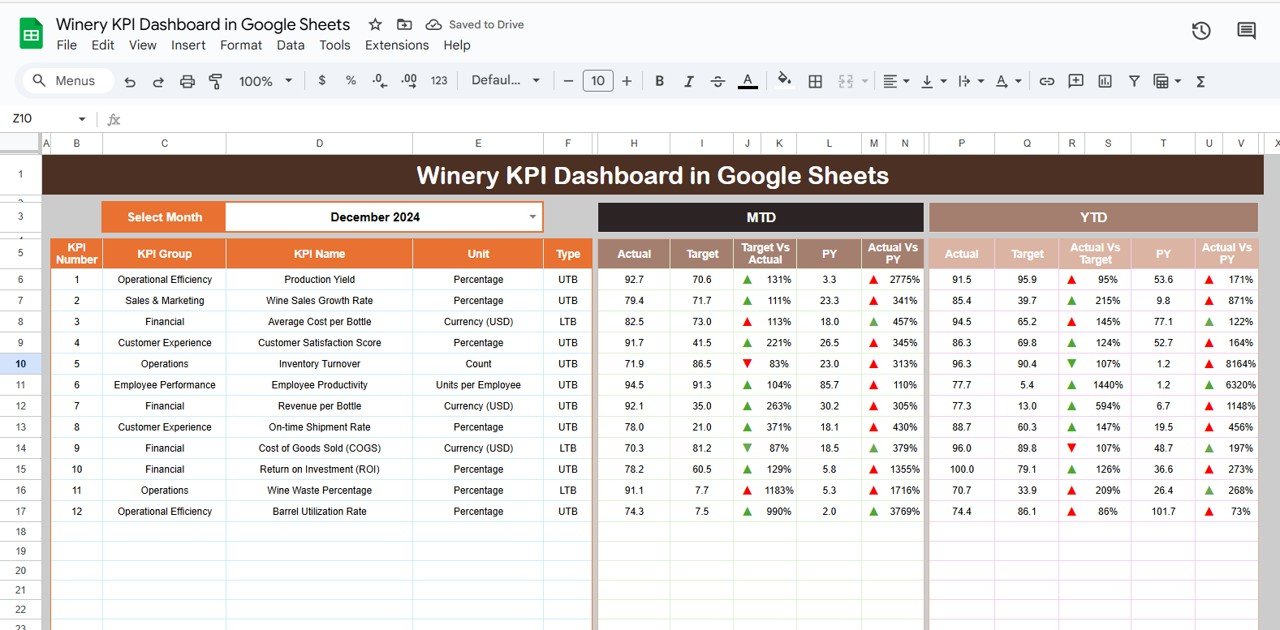
The Dashboard Sheet provides an all-in-one snapshot of your winery’s performance:
Month Selection (Range D3): Updates all KPIs dynamically for the selected month
MTD Metrics: Displays Month-to-Date Actual, Target, and Previous Year data with visual arrows
YTD Metrics: Tracks Year-to-Date results compared with targets and previous year numbers
This tab gives managers a quick overview of production, sales, and efficiency, ensuring timely decisions at every stage of the wine production cycle.
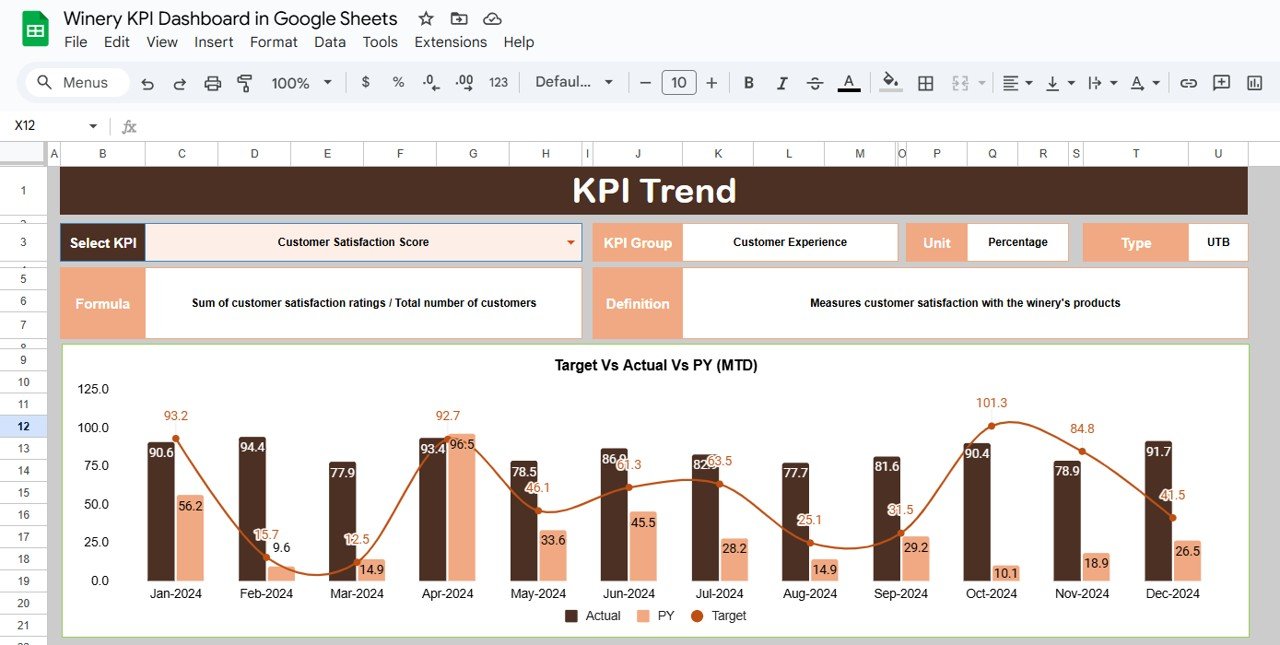
📈 KPI Trend Sheet Tab
Analyze performance trends over time:
Select any KPI from a dropdown (Range C3)
View KPI Group, Unit, and Type (Upper-the-Better or Lower-the-Better)
Understand KPI Formula and Definition
Visualize month-by-month performance for continuous improvement
Ideal for identifying performance gaps and seasonal variations in production or sales.
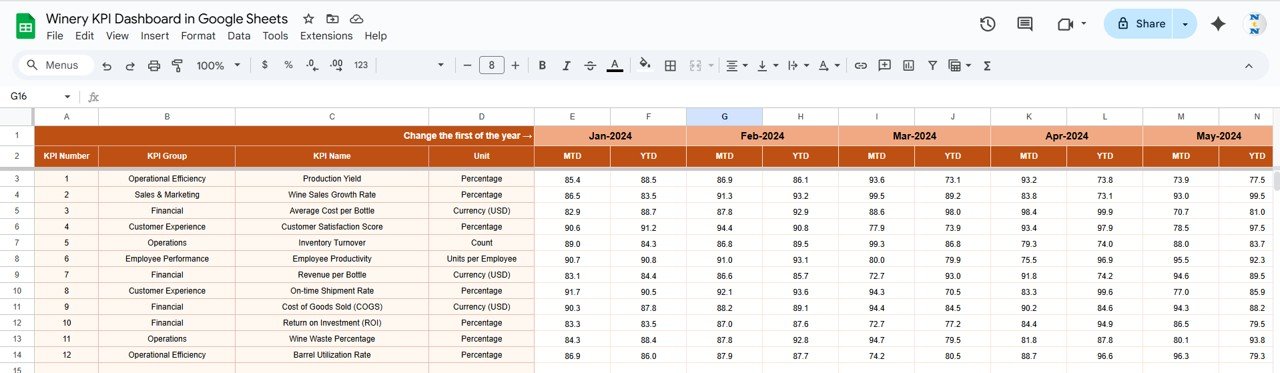
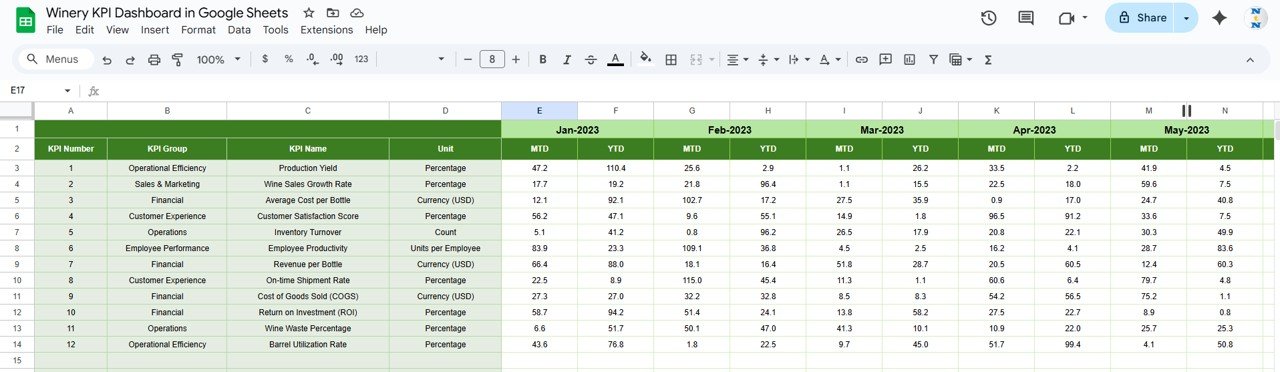
🧾 Actual Number Sheet Tab
This tab allows you to record all monthly Actual Values for both MTD and YTD.
Update your first month (Range E1) to adjust all automatic calculations
Data here feeds directly into charts and comparisons across the dashboard
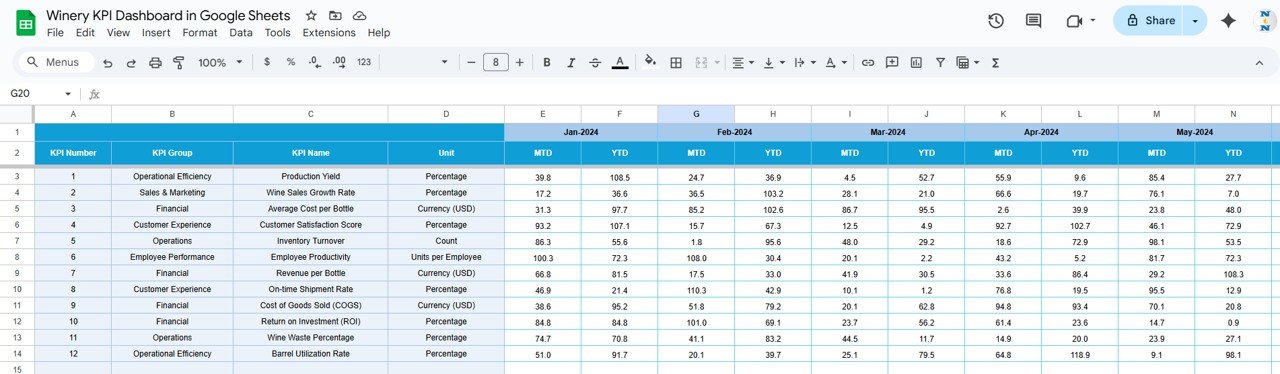
🎯 Target Sheet Tab
Set clear monthly and annual targets:
Enter benchmark goals for MTD and YTD
Compare actual performance vs. targets easily
Keep your production, sales, and quality goals on track
📉 Previous Year Numbers Sheet Tab
Gain valuable historical insights by adding prior-year performance data:
Understand year-over-year growth
Identify patterns in production, sales, or quality metrics
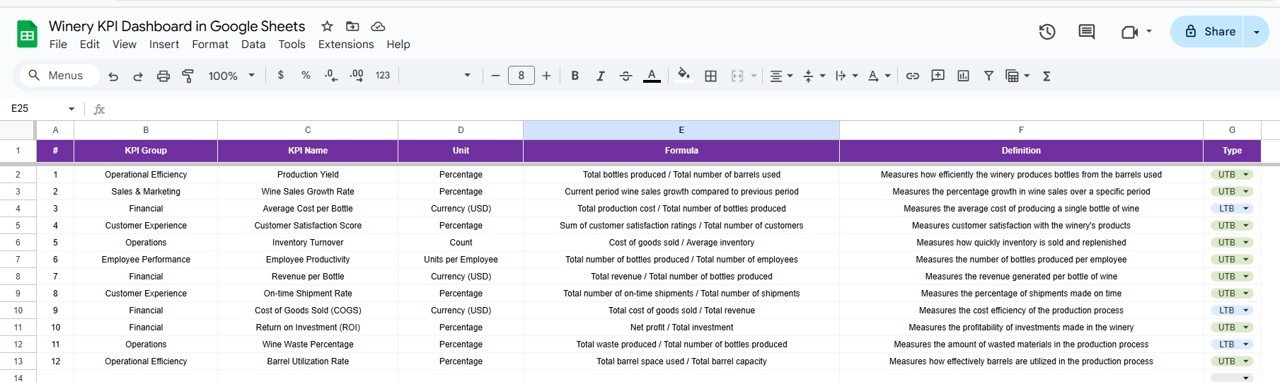
📘 KPI Definition Sheet Tab
Maintain clarity across your team by documenting each KPI:
KPI Name, Group, Unit, Formula, Definition, and Type
Define which KPIs are Upper-the-Better (UTB) or Lower-the-Better (LTB)
Acts as a standardized reference for all reporting
🍇 Example KPIs for a Winery
Track metrics across production, quality, and distribution, such as:
Total Wine Production (Liters): Measure total output
Sales Revenue ($): Monitor financial performance
Inventory Turnover: Assess stock efficiency
Customer Orders Fulfilled (%): Track operational responsiveness
Wine Quality Score: Monitor product quality or lab test results
Distribution Efficiency: Measure logistics and shipping performance
Marketing ROI (%): Track the return on promotional activities
Each KPI includes a formula, performance type, and unit of measure for clarity and consistency.
💡 Advantages of Using the Winery KPI Dashboard
✅ Centralized Data: Manage all winery performance indicators in one sheet
📊 Visual Insights: Charts and color indicators highlight performance trends
🕒 Real-Time Analysis: Instantly compare current vs. previous year results
🔍 Identify Bottlenecks: Detect inefficiencies in production or sales
🎯 Data-Driven Decisions: Make smarter, faster management choices
⚙️ Customizable: Add or modify KPIs based on your winery’s unique needs
📈 Growth-Oriented: Monitor both short-term (MTD) and long-term (YTD) performance
🧠 Best Practices for Using the Dashboard
Update Data Regularly: Input actual values monthly or weekly for real-time visibility
Segment KPIs: Track by wine type, vineyard, or region for deeper insights
Monitor Targets: Compare against goals to stay aligned with business objectives
Review Trends: Identify recurring performance cycles in production or sales
Collaborate: Share with teams for transparent performance monitoring
Use Conditional Formatting: Instantly spot underperforming metrics
🍷 How This Dashboard Helps Winery Managers
Optimize production and resource utilization
Balance inventory and prevent overstock or shortages
Improve sales and profitability through trend analysis
Maintain consistent wine quality across batches
Evaluate marketing campaigns and ROI effectively
With this Google Sheets–based dashboard, wineries can make strategic, data-backed decisions while keeping operations lean, efficient, and profitable.
🔗 Click here to read the Detailed blog post
Watch the step-by-step video Demo: