

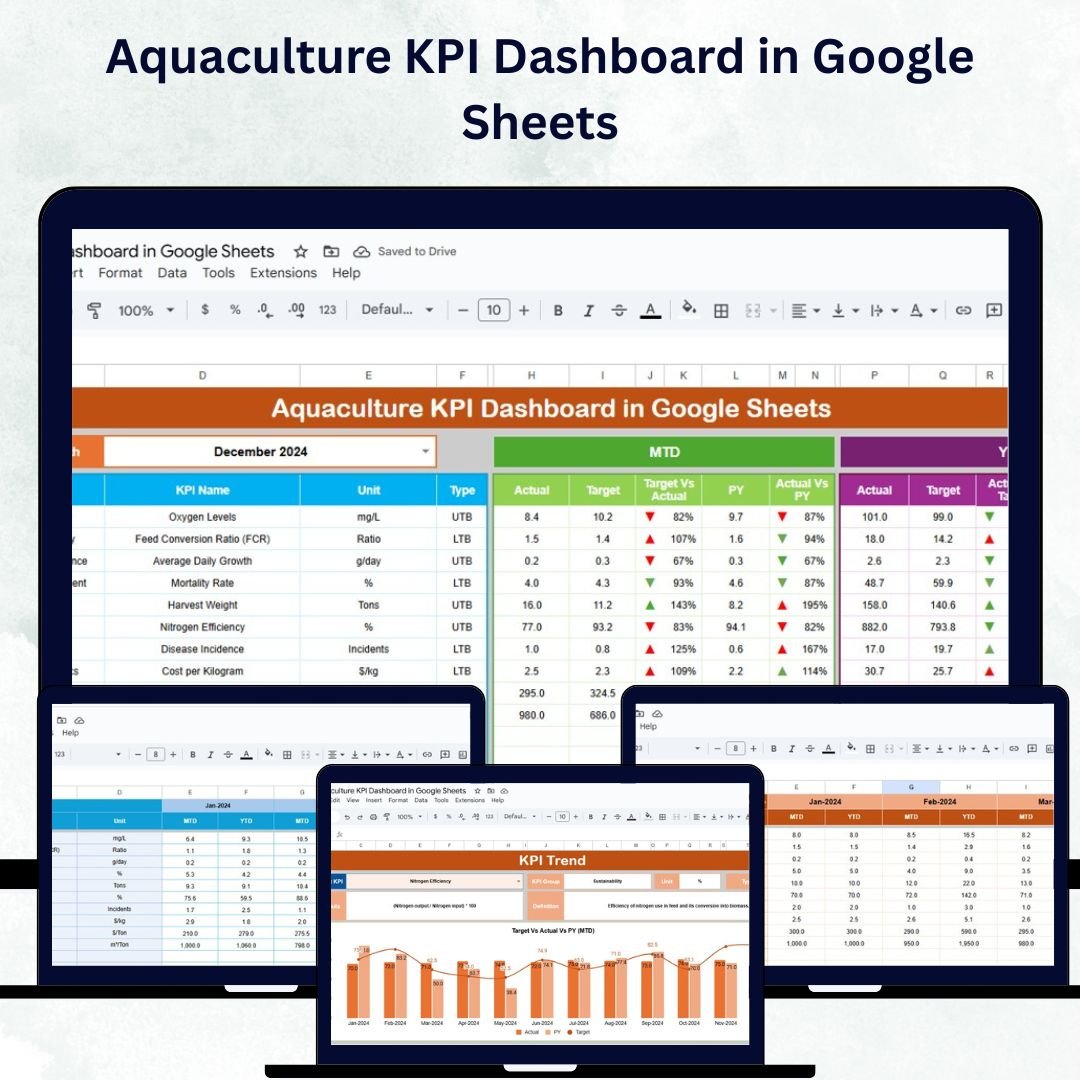

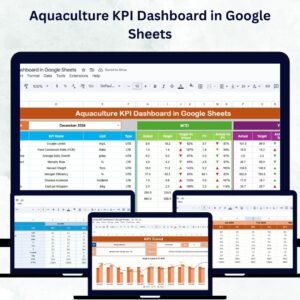
Running a successful aquaculture operation requires continuous monitoring of performance metrics across production, feed, water quality, and sustainability. The Aquaculture KPI Dashboard in Google Sheets is a ready-to-use performance management solution designed for aquaculture farms, fisheries, and hatcheries to track, analyze, and optimize key metrics in real-time. 🌊📈
Built on the flexibility of Google Sheets, this interactive dashboard consolidates month-to-date (MTD) and year-to-date (YTD) metrics along with historical data to provide actionable insights that help improve productivity, efficiency, and profitability.
🔑 Key Features of the Aquaculture KPI Dashboard in Google Sheets
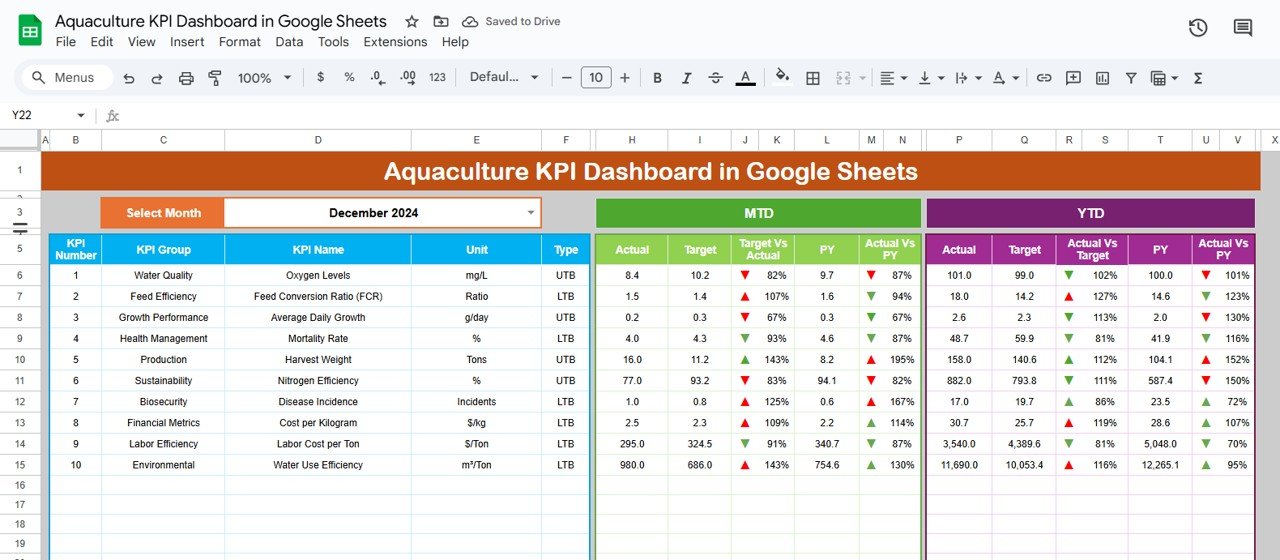
📊 Dashboard Sheet Tab
Gain a complete snapshot of your aquaculture performance in one visual view.
Month Selector Dropdown (Range D3): Choose the month to auto-refresh all KPIs
MTD Metrics: View Actual, Target, and Previous Year values with color-coded arrows
YTD Metrics: Monitor cumulative performance across months
Comparison Charts: See Target vs Actual and Previous Year vs Actual at a glance
Conditional Formatting: Instantly visualize performance improvements or declines
The Dashboard gives managers a real-time overview of farm efficiency and output quality.
📈 KPI Trend Sheet Tab
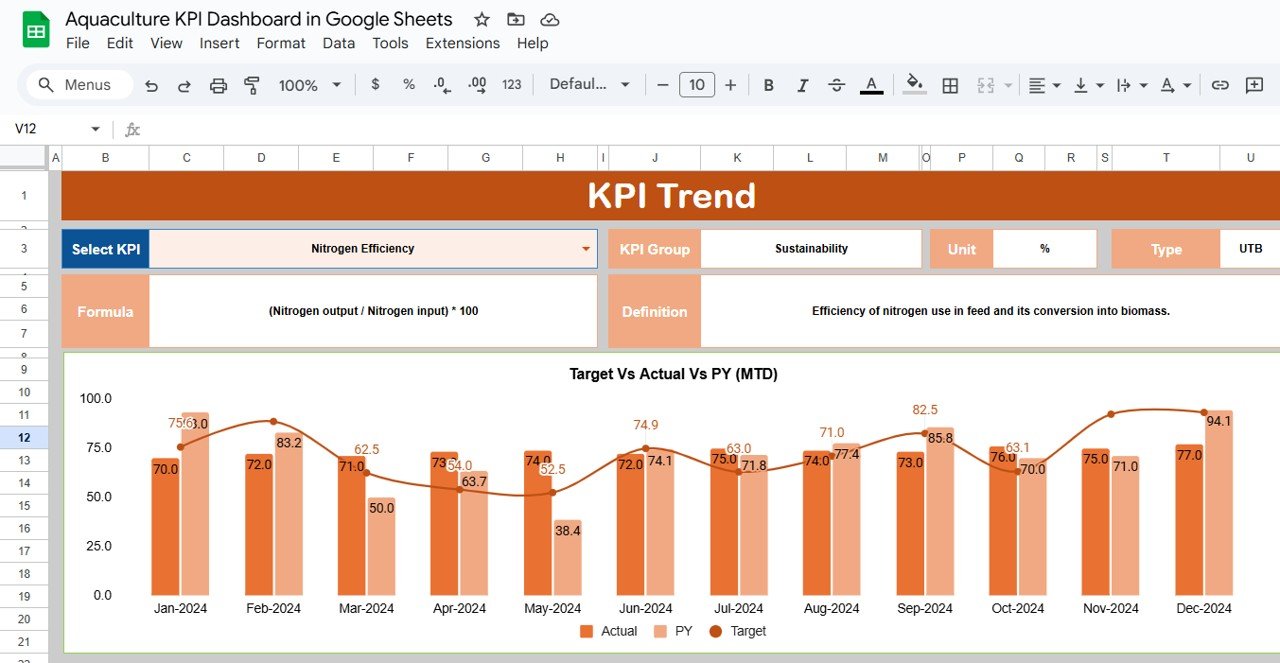
Select any KPI from the dropdown (Range C3) to view its performance trend
Displays KPI Group, Unit, Formula, and Definition for full clarity
Tracks MTD and YTD trends with dynamic charts
Highlights whether each KPI is Lower-the-Better (LTB) or Upper-the-Better (UTB)
This helps managers identify seasonal patterns, detect issues, and monitor growth.
🧾 Actual Number Sheet Tab
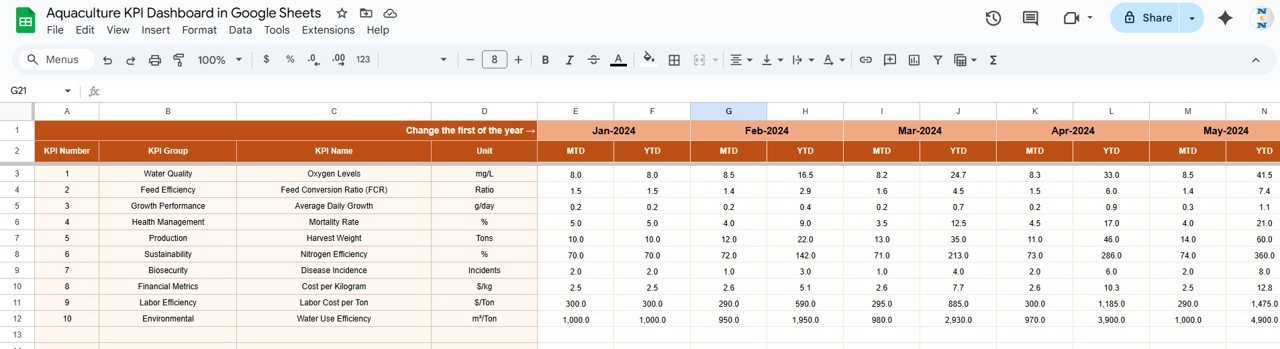
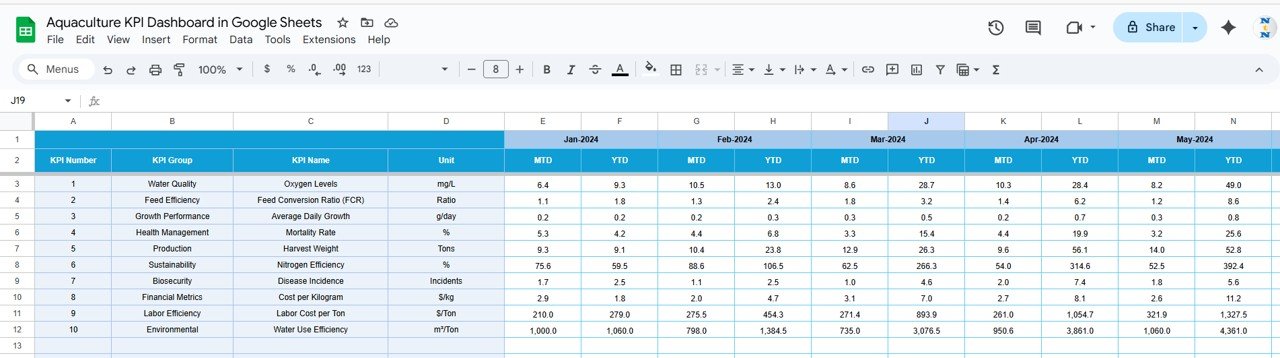
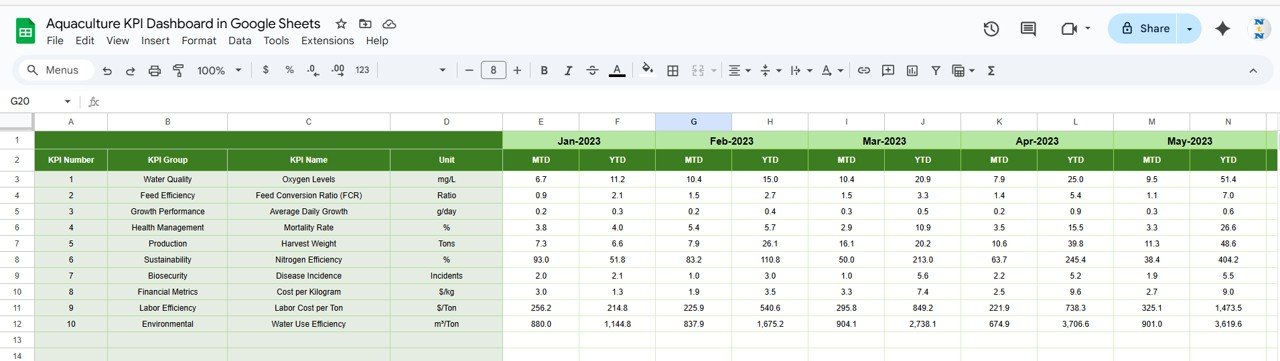
Input actual performance values for each KPI
Supports both MTD and YTD entries
Adjust starting month dynamically in Range E1
Enables real-time updates to all reports
🎯 Target Sheet Tab
Record planned target values for each KPI
Compare Actual vs Target automatically
Supports both short-term and long-term goal tracking
📅 Previous Year Sheet Tab
Store last year’s data for year-over-year comparison
Measure improvements in production, efficiency, and cost control
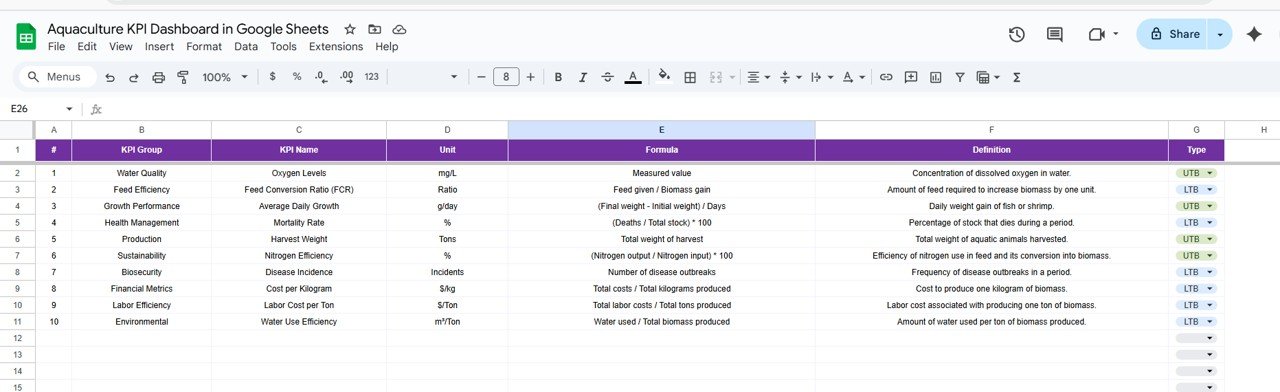
📖 KPI Definition Sheet Tab
Centralized documentation for every KPI
Columns include: KPI Name, Group, Unit, Formula, Definition, and Type (LTB/UTB)
Promotes accuracy, transparency, and consistent KPI interpretation
📦 What’s Inside the Aquaculture KPI Dashboard?
✅ Dashboard Sheet – Visual summary of key metrics and comparisons
✅ KPI Trend Sheet – Drill down into specific KPI trends
✅ Actual Number Sheet – Data entry section for current performance
✅ Target Sheet – Input and monitor planned goals
✅ Previous Year Sheet – Analyze year-over-year growth
✅ KPI Definition Sheet – Reference for formula and KPI explanations
Every sheet is automatically linked, ensuring data entered once updates the entire dashboard instantly. No coding or manual calculations required! 🧮🐠
🧑💼 Who Can Benefit from This Dashboard?
🎯 Aquaculture Farm Managers – Track production efficiency and mortality rates
💼 Operations Teams – Monitor feed conversion and water quality metrics
💧 Sustainability Teams – Evaluate environmental and resource performance
📊 Finance & Planning Teams – Measure cost per kilogram and revenue
🌍 Business Owners & Investors – Get clear visual insights into profitability and sustainability
This tool is scalable for fish farms, shrimp hatcheries, aquaponic setups, or integrated aquaculture businesses.
🧪 How to Use the Aquaculture KPI Dashboard
Enter Actual Data – Input daily, weekly, or monthly values in the Actual Sheet
Set Targets – Define monthly or annual goals in the Target Sheet
Track Trends – Analyze monthly or yearly patterns using the KPI Trend Sheet
Compare Performance – Review Actual vs Target and Previous Year metrics
Review Insights – Identify improvement areas and make informed adjustments
Built in Google Sheets, the dashboard supports real-time collaboration, enabling teams to update and review performance simultaneously. ✅
🌟 Why Choose This Dashboard?
Comprehensive tracking of aquaculture KPIs
Real-time visual performance updates
Clear comparisons between MTD, YTD, and Previous Year metrics
Fully customizable KPI setup for any farm type
Scalable for small, medium, or large operations
Built-in trend analysis and conditional formatting
No software installation or coding required
With the Aquaculture KPI Dashboard in Google Sheets, aquaculture professionals can transform data into actionable insights — driving better production, profitability, and sustainability. 🌊💡
🔗 Click here to read the Detailed blog post
Watch the step-by-step video Demo:








Reviews
There are no reviews yet.