

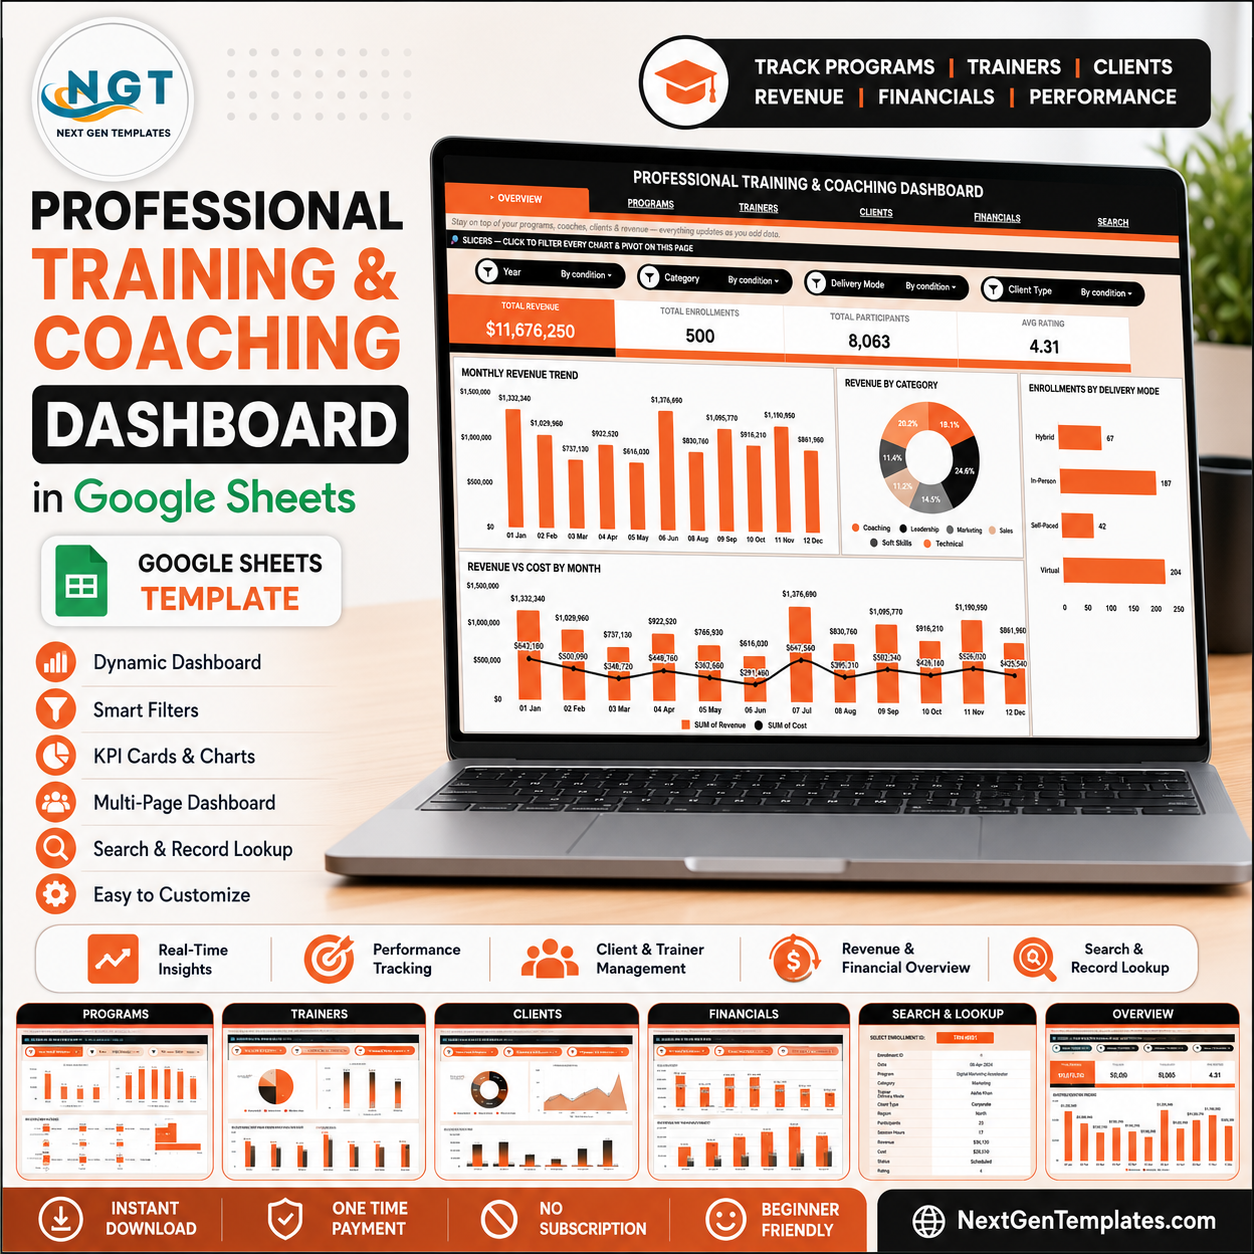

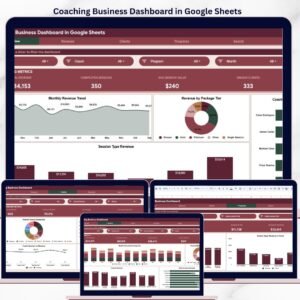
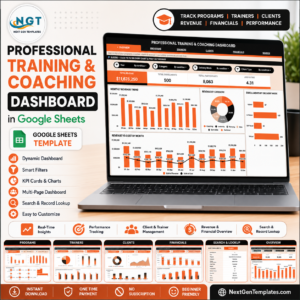
The Professional Training and Coaching Dashboard in Google Sheets tracks 4 headline KPIs and 20 pre-built charts across 5 interactive dashboard pages, backed by a Search tab and a Data tab — 7 sheets in total. Every enrollment you log captures 13 fields, and each card, chart and slicer refreshes the moment new rows land in the Data sheet. Setup takes under 10 minutes: paste your enrollments and the dashboard is live.
🌍 Join 8,400+ teams in 40+ countries using NextGenTemplates to replace paid SaaS tools with one-time-purchase Excel, Google Sheets, Power BI, and HTML templates.
✅ Instant download · One-time payment · No subscription · No per-user fees · Lifetime access
🔑 Key Features of the Professional Training and Coaching Dashboard
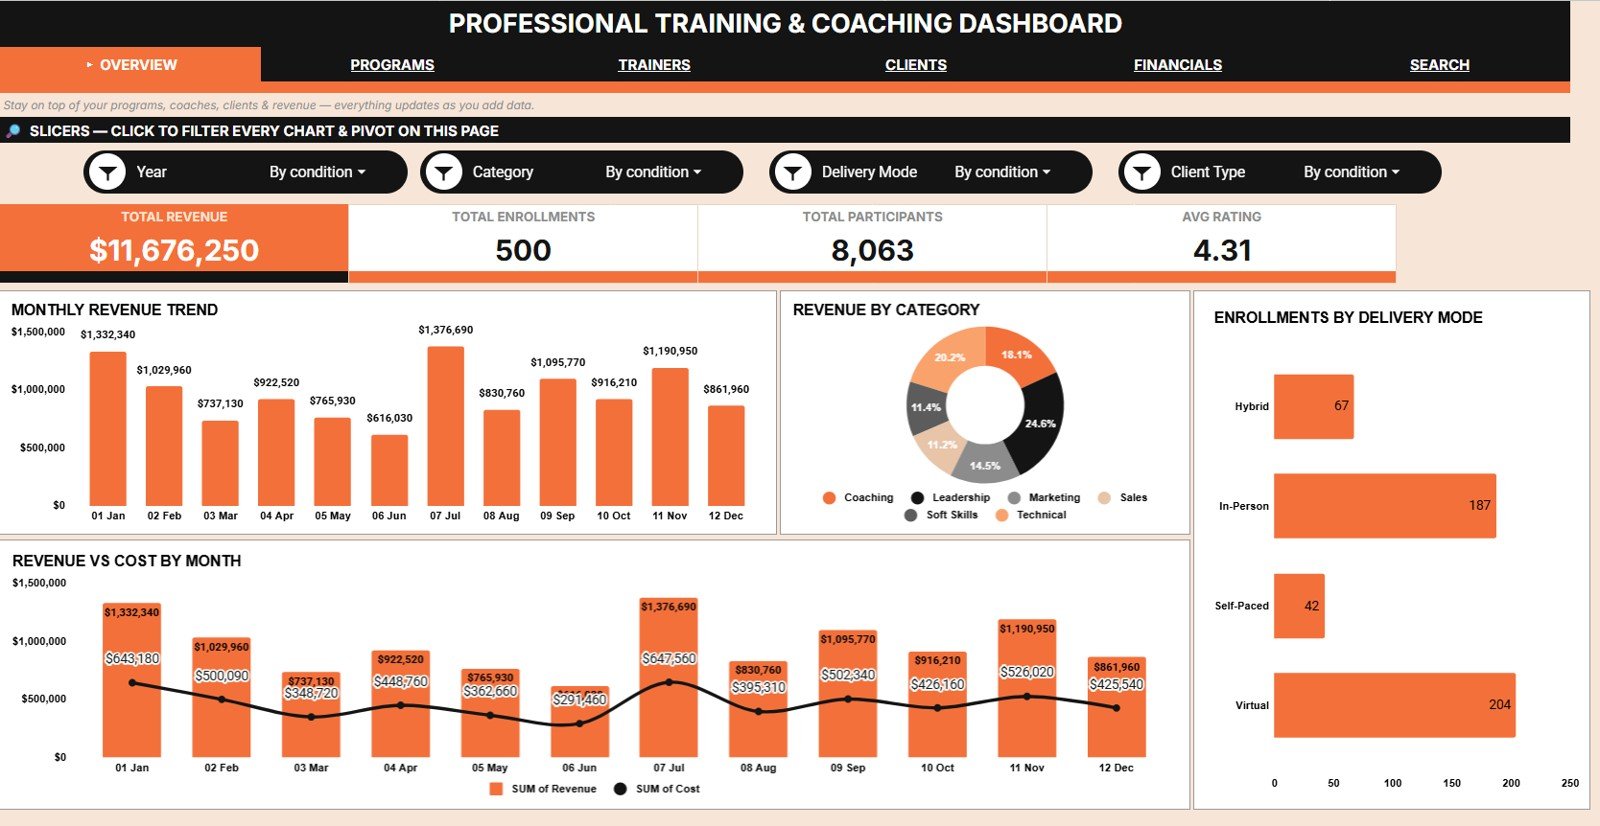
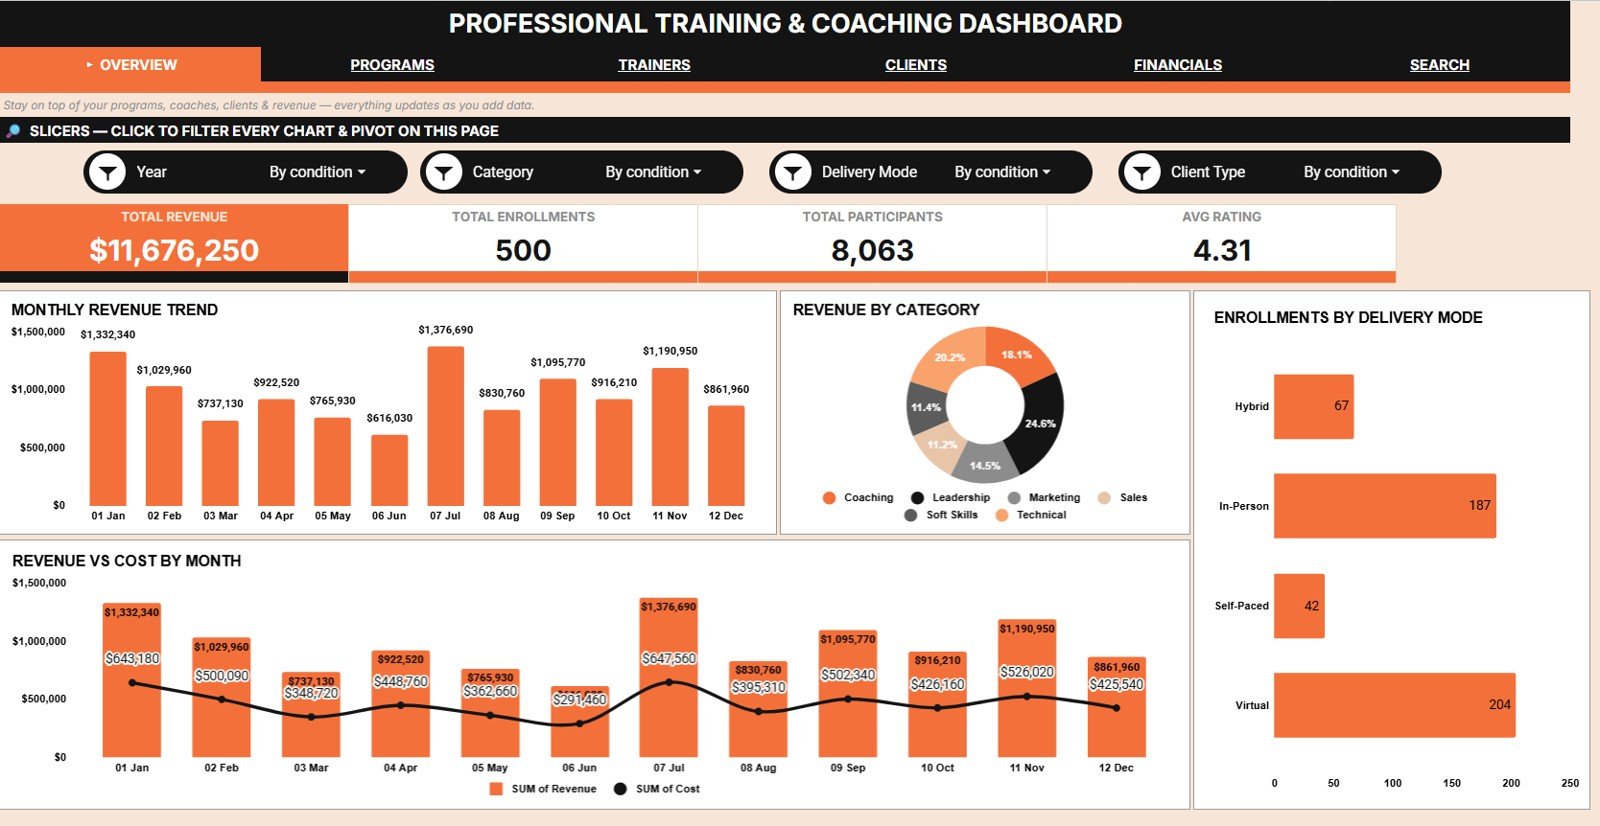
📊 Four KPI cards that answer the questions owners actually ask. The Overview page opens with Total Revenue, Total Enrollments, Total Participants and Avg Rating. One glance tells you whether the training business is growing, whether delivery is scaling, and whether learners are satisfied.
📈 Twenty pre-built charts across five analysis pages. Overview, Programs Analysis, Trainers Analysis, Clients Analysis and Financials Analysis carry four charts each, covering revenue, cost, enrollments, participants, session hours, session status and satisfaction ratings.
🎚️ Native Google Sheets slicers on every page. Filter by program, category, trainer, delivery mode, client type, region or status and every chart on that page redraws instantly. No formula editing and no pivot rebuilding.
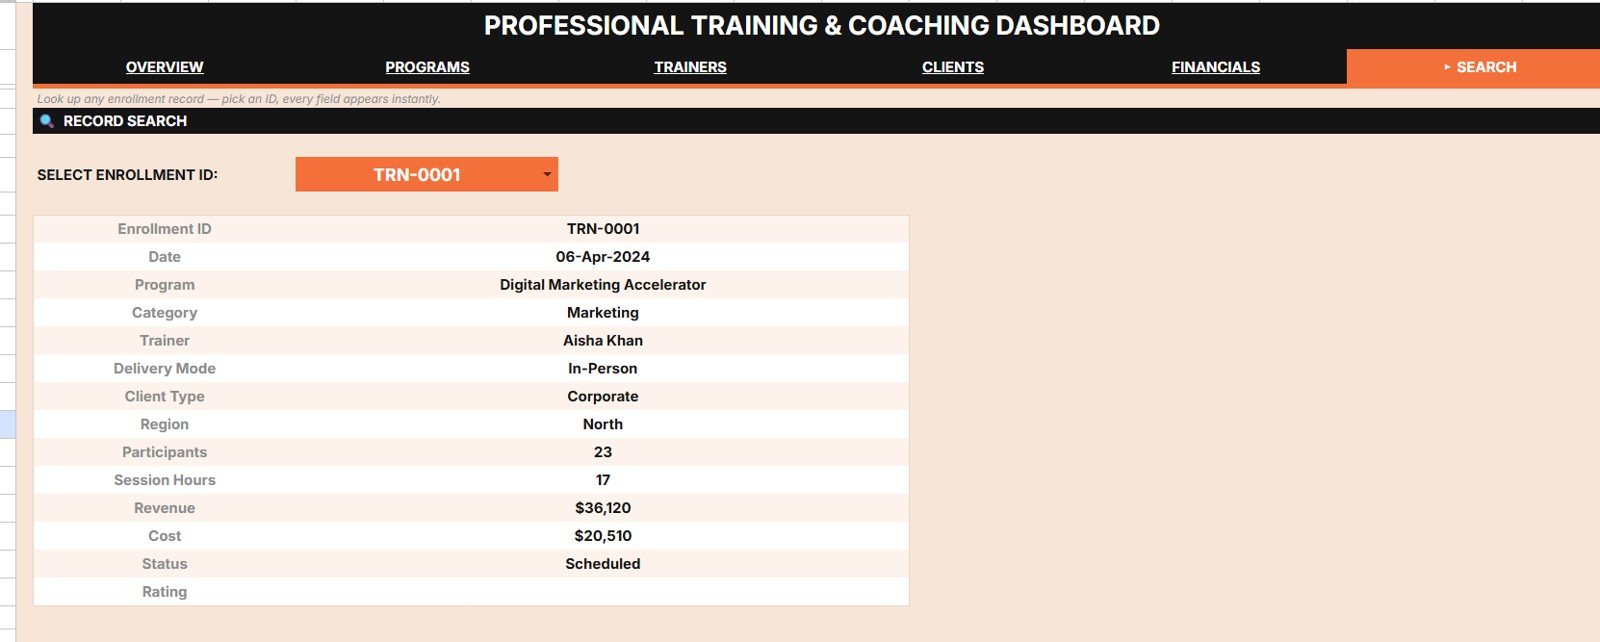
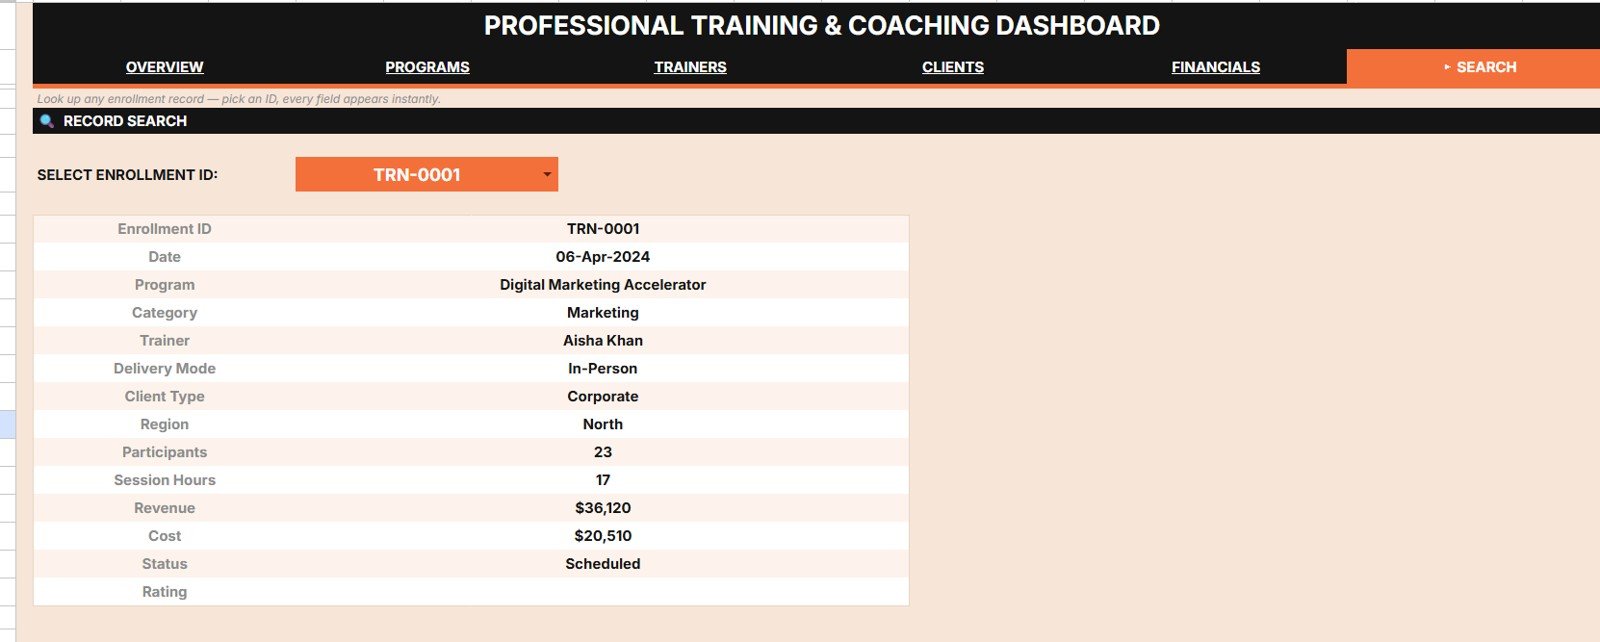
🔍 A Search tab keyed by Enrollment ID. Choose an ID from the dropdown and all 13 fields of that record appear at once: Date, Program, Category, Trainer, Delivery Mode, Client Type, Region, Participants, Session Hours, Revenue, Cost, Status and Rating.
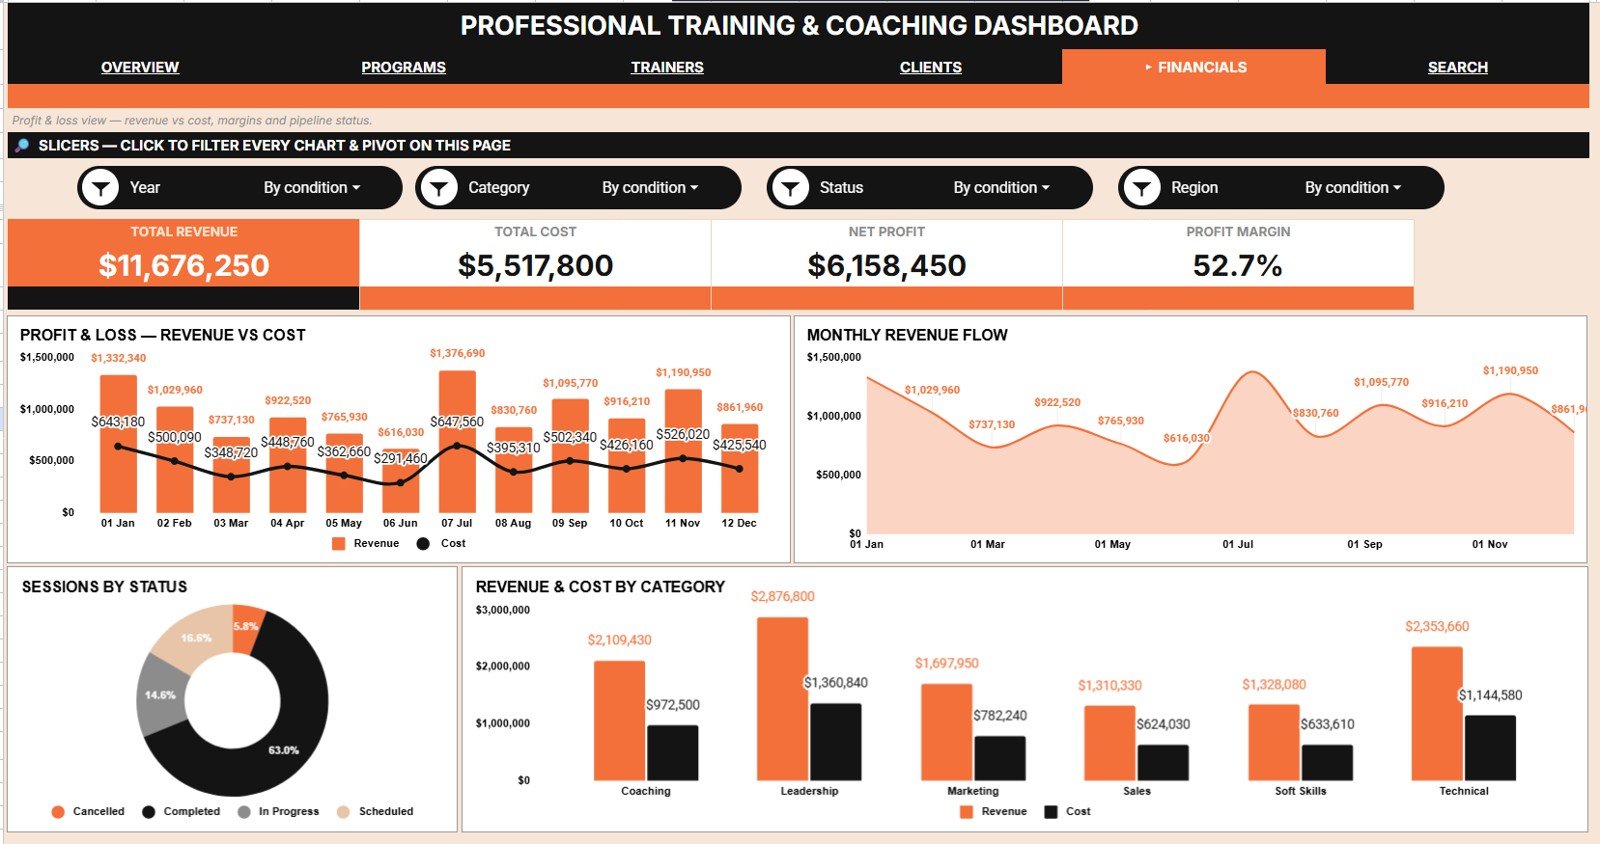
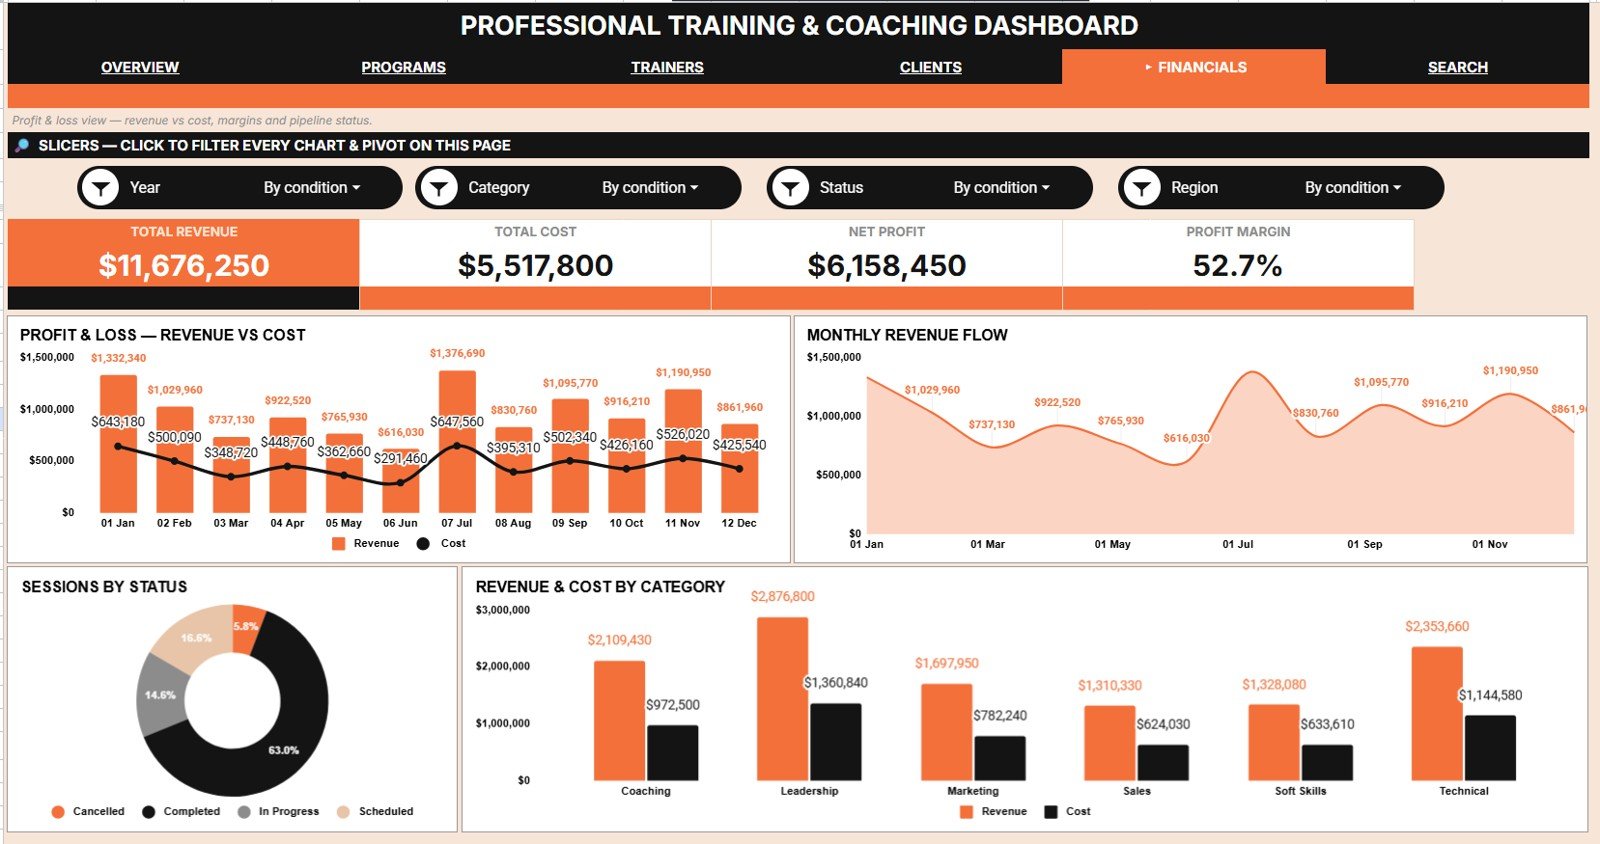
💰 Revenue and cost shown together, not separately. The Financials Analysis page charts Revenue and Cost by Month alongside Revenue and Cost by Category, so a program that fills every seat while quietly destroying margin has nowhere to hide.
☁️ Pure Google Sheets — no add-ons, no install. It opens in any browser on any device, shares with a link, and updates for the whole team in real time. It follows the same structure as our other Google Sheets Dashboards.
📦 What’s Inside the Professional Training and Coaching Dashboard
Seven sheet tabs: five dashboard pages, one Search tab and one Data tab.Professional Training and Coaching Dashboard in Google Sheets
Page 1: Overview
The Overview page carries the four headline cards — Total Revenue, Total Enrollments, Total Participants and Avg Rating — with slicers along the top. Its four charts are Revenue by Month, Revenue by Category, Enrollments by Delivery Mode, and Revenue and Cost by Month.Professional Training and Coaching Dashboard in Google Sheets
 Professional Training and Coaching Dashboard in Google Sheets
Page 2: Programs Analysis
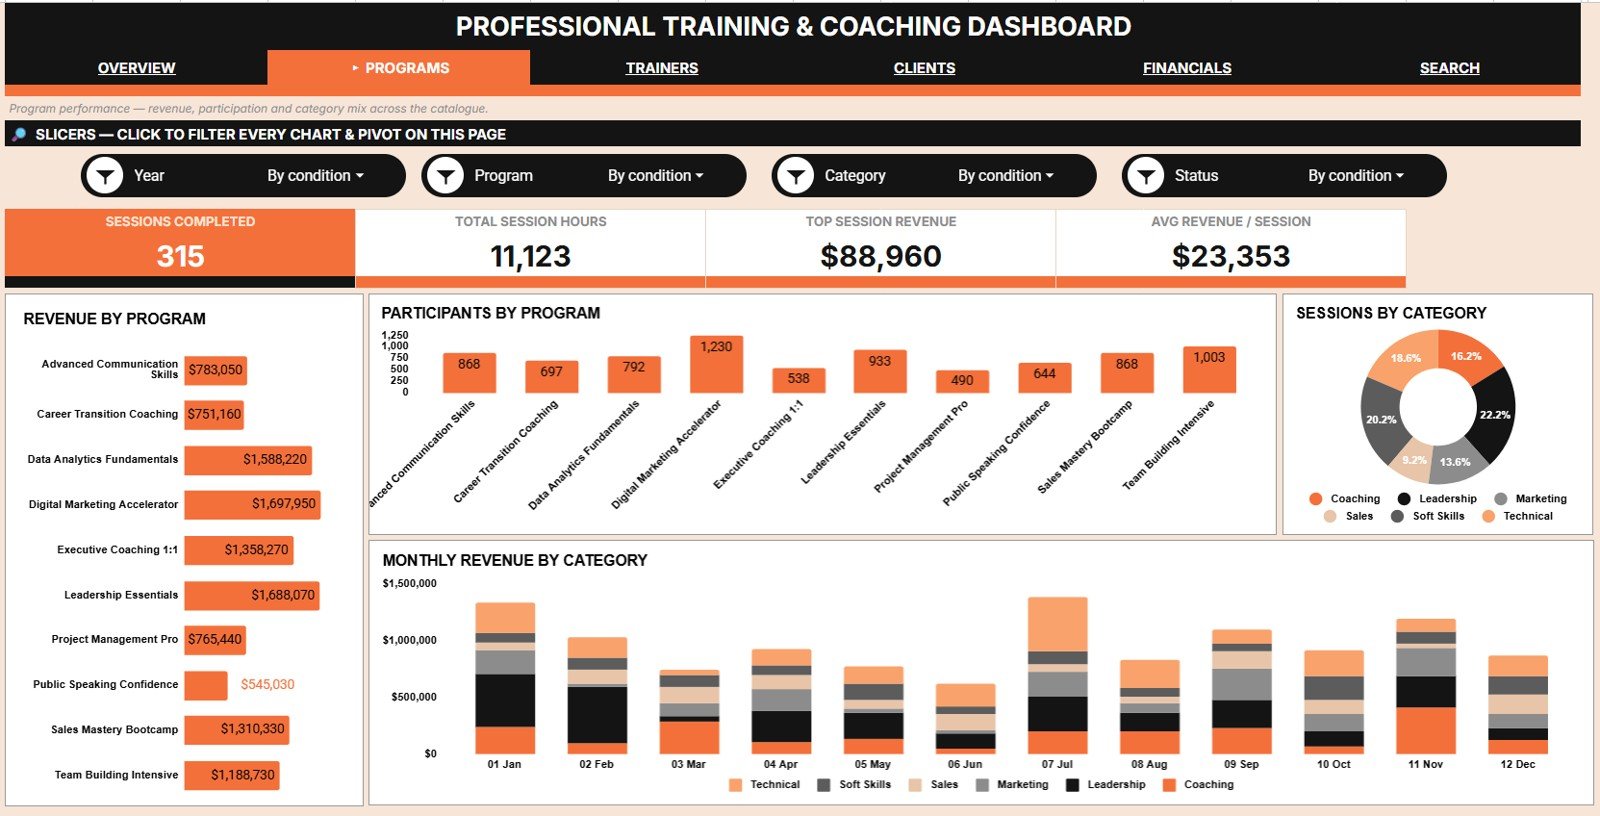
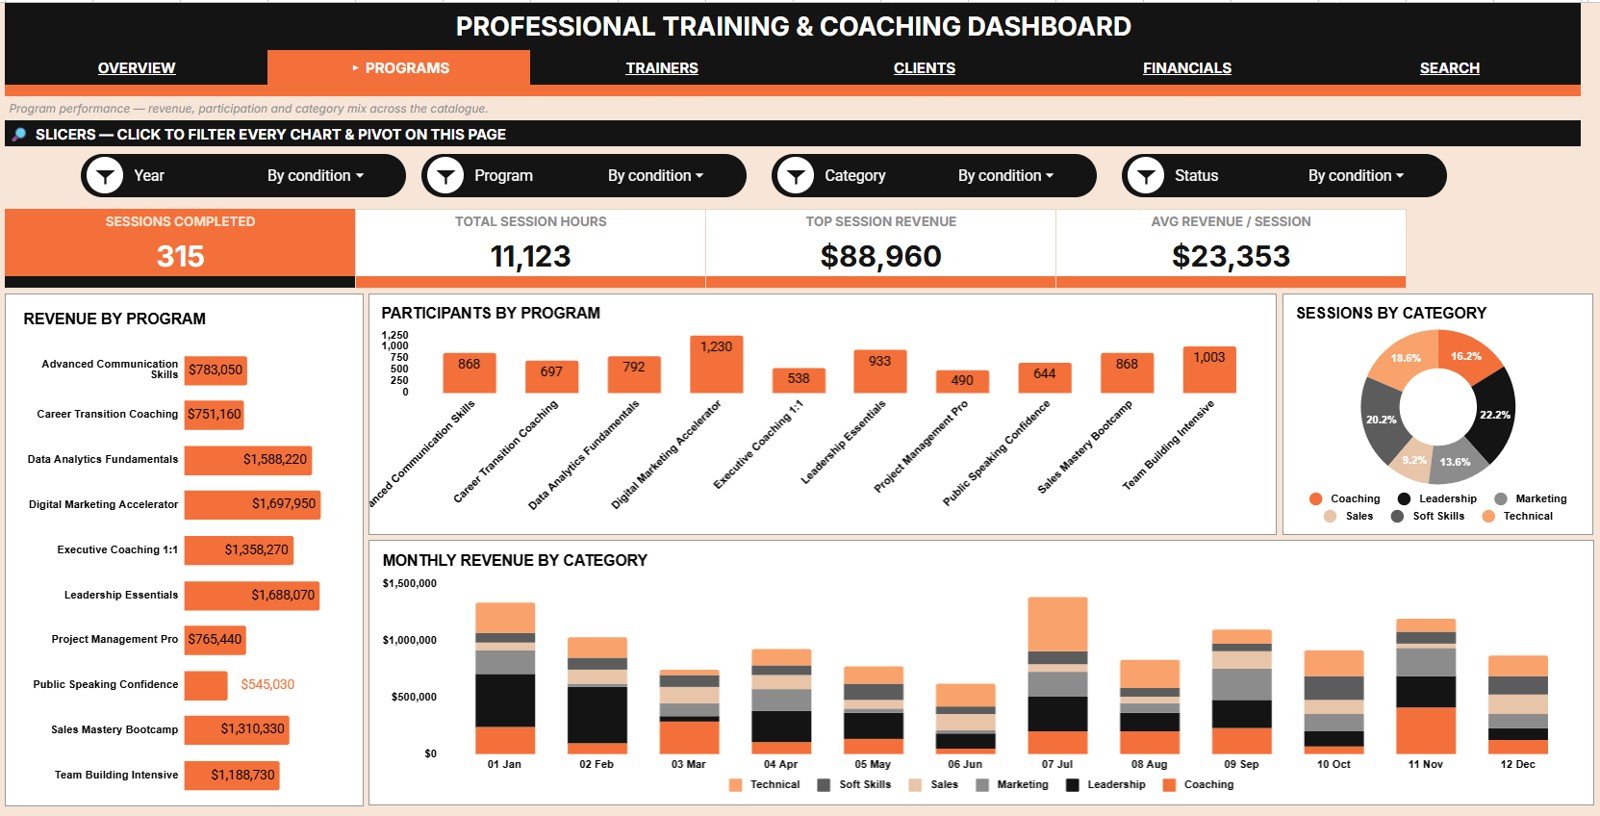
This page shows which programs earn and which merely fill seats. Charts include Revenue by Program, Participants by Program, Sessions by Category, and Revenue by Category and Month.
 Programs Analysis
Page 3: Trainers Analysis
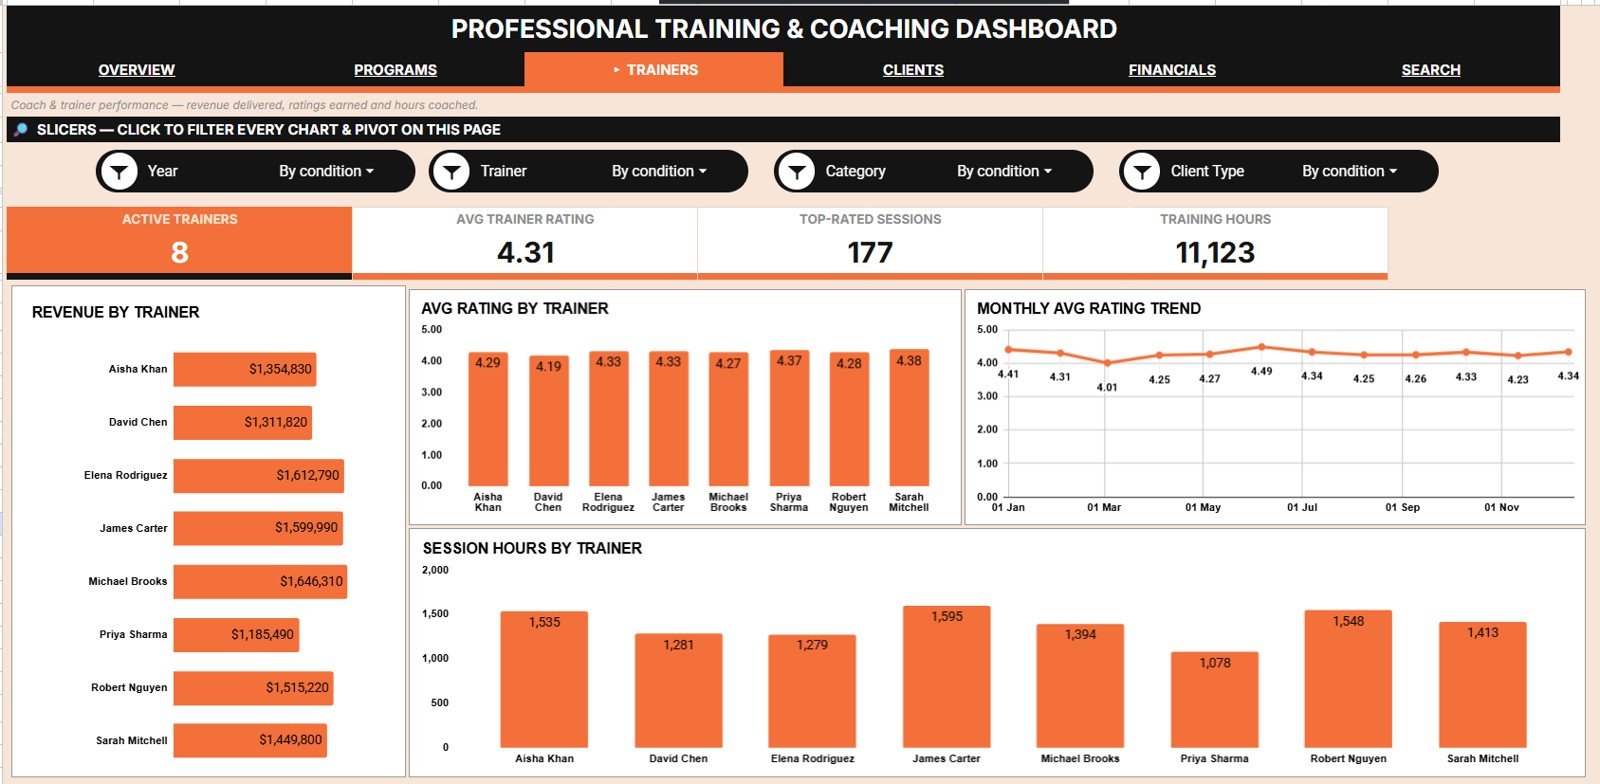
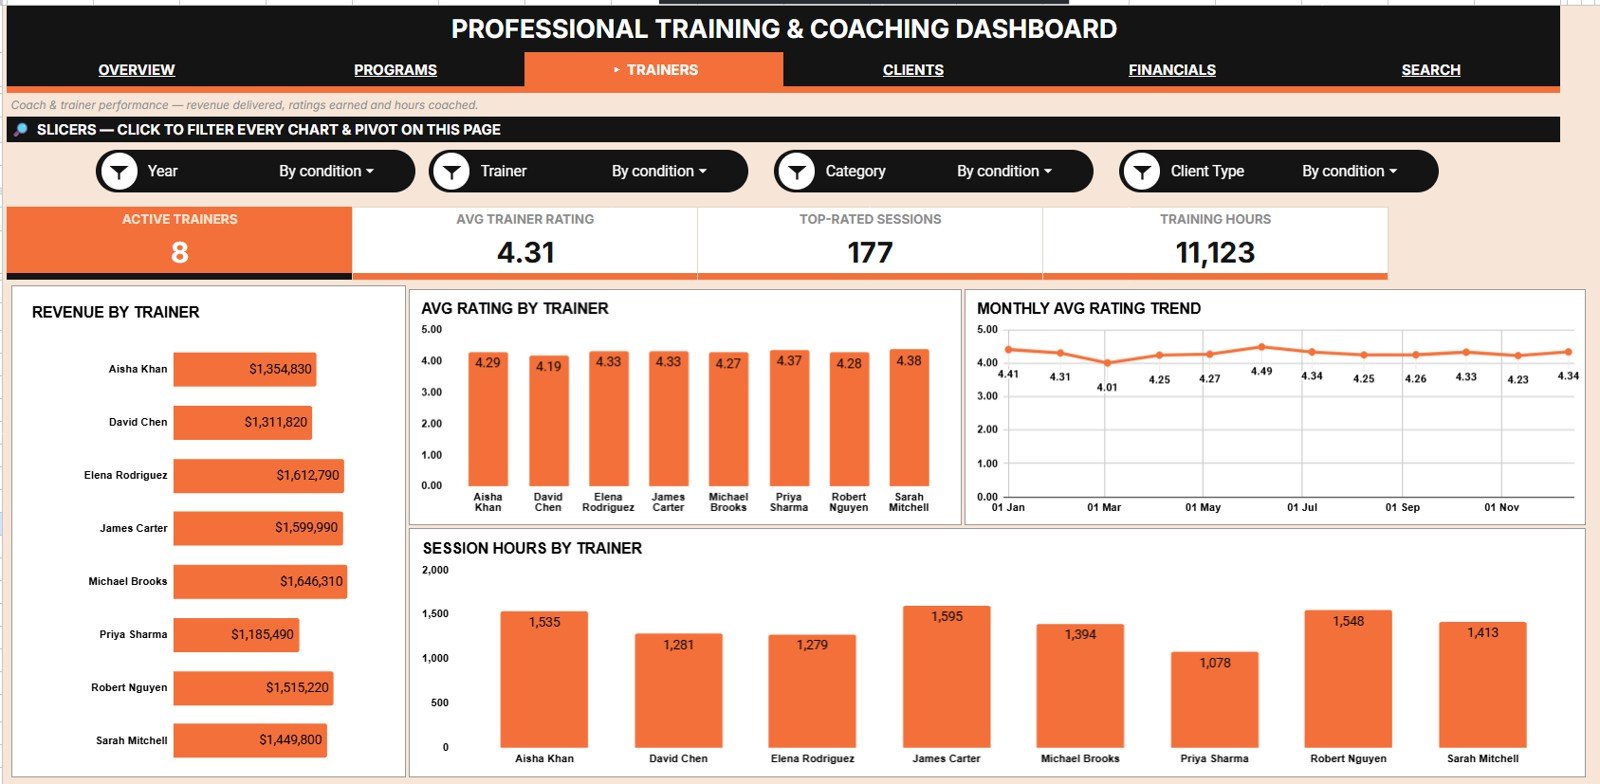
This page ranks the delivery team on money, quality and workload together. Charts include Revenue by Trainer, Avg Rating by Trainer, Avg Rating by Month, and Session Hours by Trainer.
 Trainers Analysis
Page 4: Clients Analysis
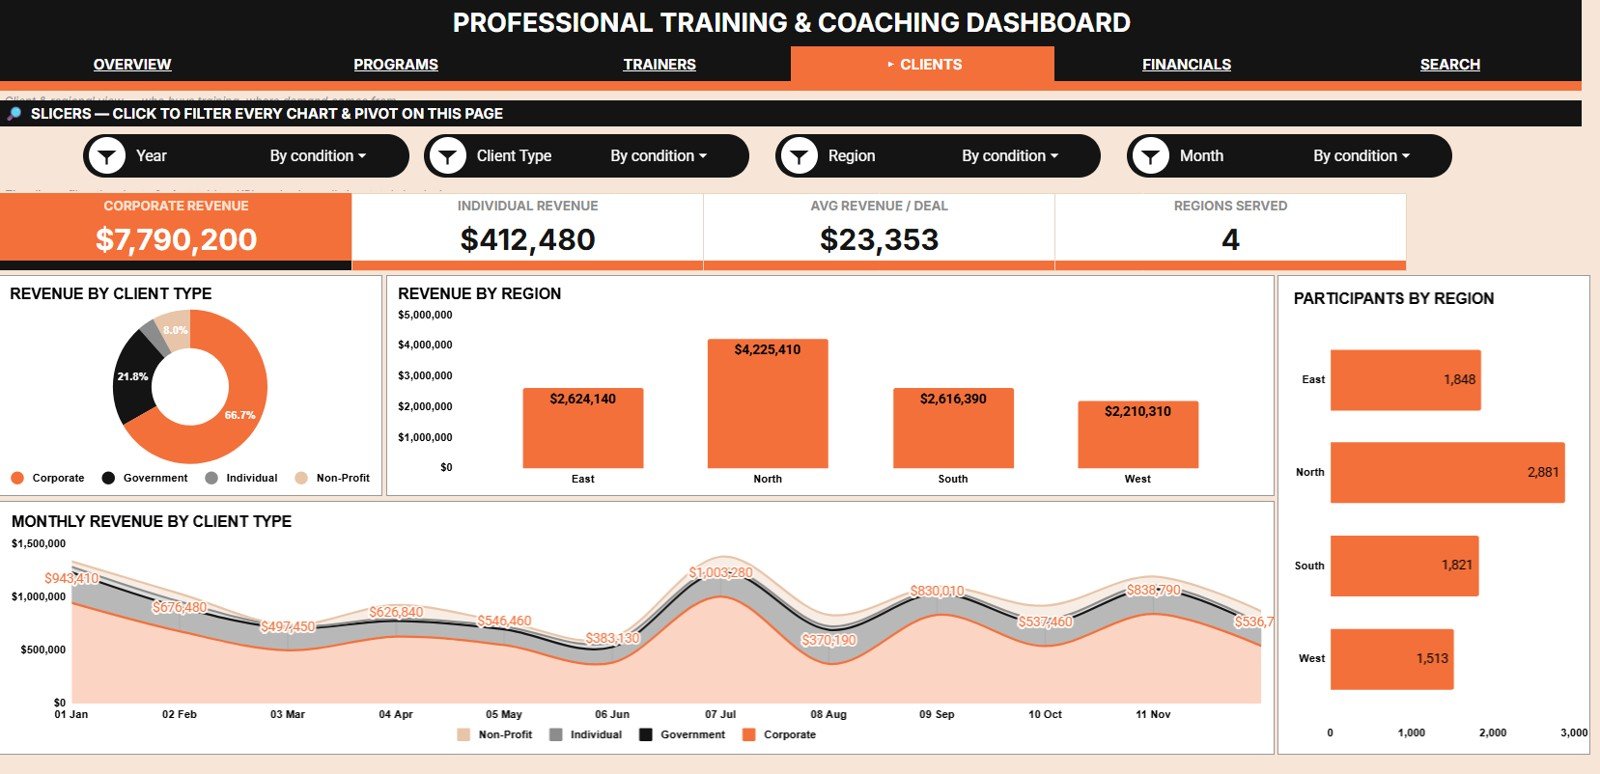
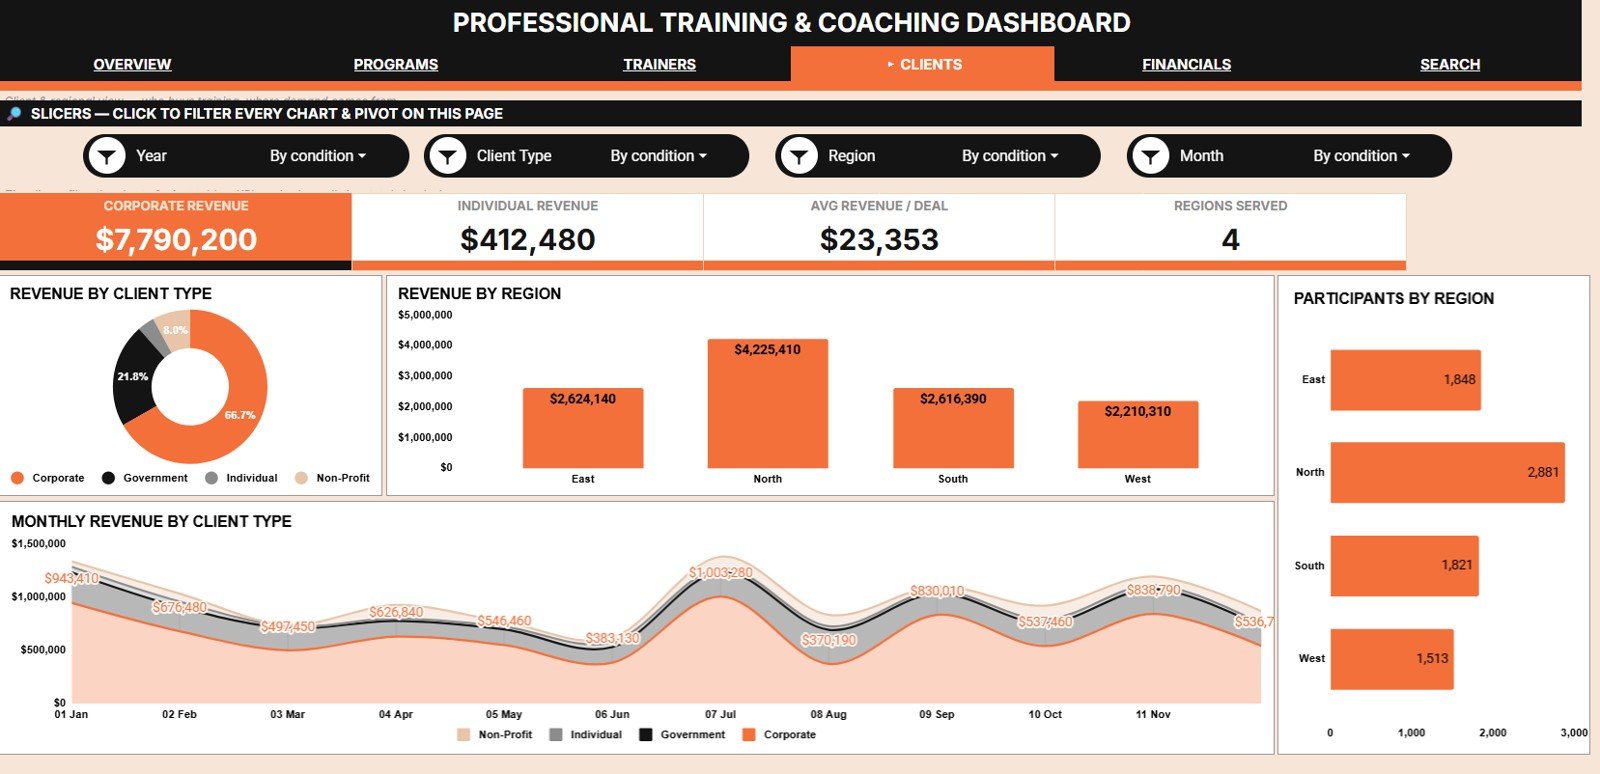
This page separates the client types and regions that pay from the ones that merely enquire. Charts include Revenue by Client Type, Revenue by Region, Participants by Region, and Revenue by Client Type and Month.
 Clients Analysis
Page 5: Financials Analysis
This page puts money in and money out on the same screen. Charts include Revenue and Cost by Month, Revenue by Month, Sessions by Status, and Revenue and Cost by Category.Professional Training and Coaching Dashboard in Google Sheets
 Financials Analysis
Search Sheet Tab
Select any Enrollment ID from the dropdown and every field of that record appears instantly — Date, Program, Category, Trainer, Delivery Mode, Client Type, Region, Participants, Session Hours, Revenue, Cost, Status and Rating. It finds one specific record without scrolling the full data set.Professional Training and Coaching Dashboard in Google Sheets
 Search Sheet tab
Data Sheet Tab
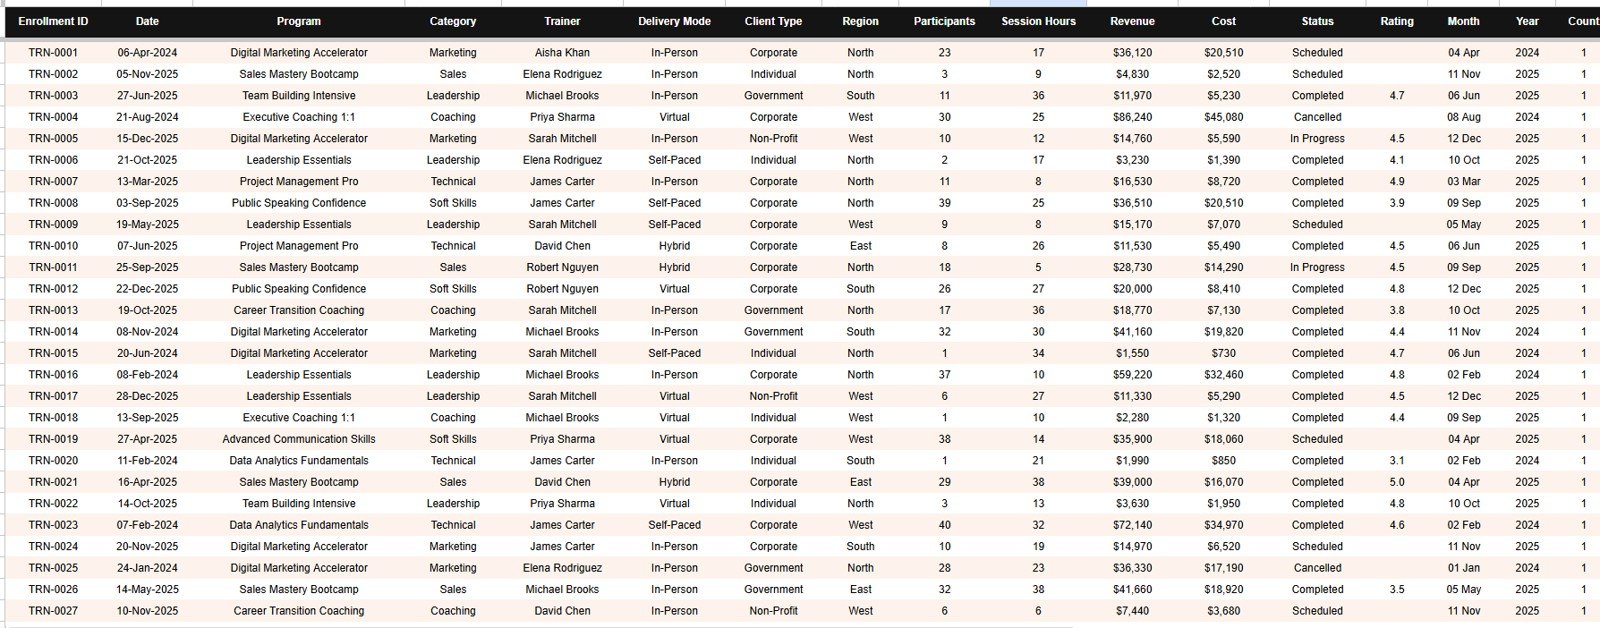
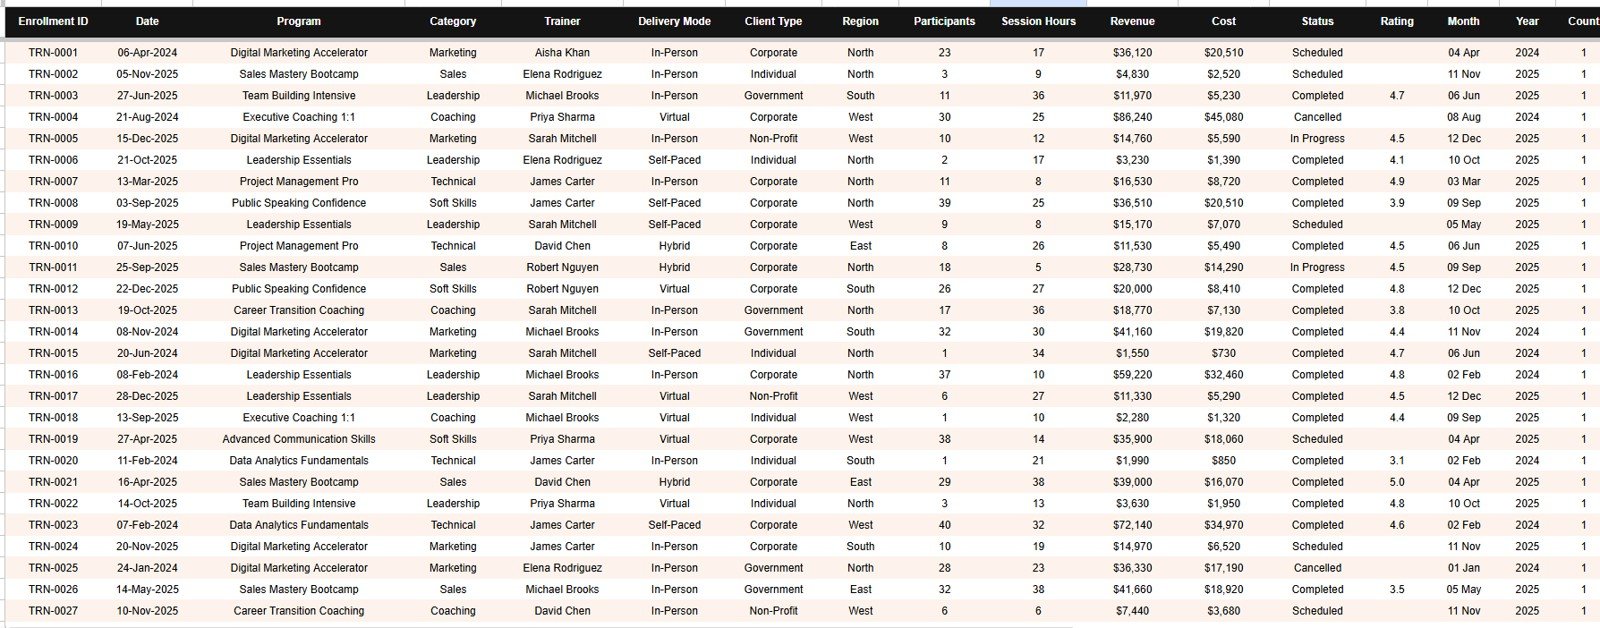
This is the Data sheet, where your enrollment records live. Add your data in the same 13-column format and every page updates automatically.Professional Training and Coaching Dashboard in Google Sheets
 Data Sheet tab
📊 Training Dashboard in Google Sheets vs. Excel vs. Paid Training SaaS — Where This Fits
| Feature | Professional Training and Coaching Dashboard (Google Sheets) | Excel Training Dashboard | Training SaaS (Arlo / TalentLMS / Accessplanit) |
|---|---|---|---|
| Cost | $9.99 one-time ✅ | $10–20 one-time + Microsoft 365 licence | $100–$500+ / month, typically per seat |
| Platform | Google Sheets — any browser, any device ✅ | Excel desktop (licence required) | Vendor cloud platform |
| Setup time | Under 10 minutes ✅ | 10–20 minutes | Weeks of onboarding and configuration |
| Real-time team collaboration | Built in — native Sheets sharing ✅ | Partial — needs OneDrive / M365 | Yes ✅ (on paid seats) |
| Mobile access | Free Google Sheets app ✅ | Limited on mobile Excel | Yes ✅ (on paid seats) |
| Add your own programs, trainers, regions | Edit any dropdown list — no code ✅ | Yes ✅ | Often restricted to vendor-defined fields |
| Share with a link | One link, unlimited viewers ✅ | File attachment or OneDrive link | Yes ✅ (licensed users only) |
| Trainer profitability view (revenue + rating + hours) | Dedicated Trainers Analysis page ✅ | Varies by template | Usually a reporting add-on or higher tier |
| Year-1 cost for a 5-person team | $9.99 total ✅ | $10–20 + five Microsoft 365 licences | $1,200–$6,000+ |
For training and coaching businesses that want program-level and trainer-level profitability without a four-figure annual platform contract, the Professional Training and Coaching Dashboard sits in the sweet spot.Professional Training and Coaching Dashboard in Google Sheets
👥 Who This Template Is For — and Who It’s Not For
✅ This template is built for:
- Corporate training providers and L&D consultancies delivering 5–500 programs a year
- Independent coaches and coaching practices tracking enrollments, session hours and repeat clients
- Training managers who need revenue, utilisation and satisfaction per trainer in a single view
- Skill academies and certification bodies that bill per participant across multiple regions
❌ This template is NOT for:
- Anyone who needs learner logins, course hosting or SCORM delivery — that is an LMS, not a reporting dashboard
- Teams wanting invoicing, payment collection or a CRM pipeline built into the same file
- Enterprises that require SOC 2, SSO or audited access controls on reporting data
- Businesses expecting enrollments to sync automatically from an existing booking system without any manual paste
⚙️ How to Use the Professional Training and Coaching Dashboard
- Open the PDF in your download and click the Google Sheets copy link to save an editable copy into your own Google Drive.
- Go to the Data tab and replace the sample rows with your enrollments, keeping the same 13 columns.
- Update the dropdown lists for programs, categories, trainers, delivery modes, client types, regions and statuses.
- Open the Overview page — the four KPI cards and every chart recalculate on their own.
- Use the slicers at the top of each page to filter by trainer, program, region, delivery mode or status.
- Use the Search tab to pull any single enrollment record instantly by its Enrollment ID.Professional Training and Coaching Dashboard in Google Sheets
💼 Real-World Use Cases
Priya runs a corporate training firm with nine freelance trainers. She uses the Trainers Analysis page to compare Revenue by Trainer against Avg Rating by Trainer, and discovered that her second-highest earner had the lowest satisfaction score — a renewal risk she caught before the client did.Professional Training and Coaching Dashboard in Google Sheets
Marcus is an executive coach with a small practice. He tracks Revenue by Client Type and Revenue by Region, and found that corporate clients generated three times the revenue per session of individual clients. He rebuilt his pricing around that single chart.
Elena manages L&D delivery for a manufacturing group. She uses Revenue and Cost by Category on the Financials Analysis page to spot the compliance programs running at a loss, then uses the slicers to check whether the problem is one region or all of them.Professional Training and Coaching Dashboard in Google Sheets
❓ Frequently Asked Questions
What KPIs does the Professional Training and Coaching Dashboard track?
The Professional Training and Coaching Dashboard tracks four headline KPIs — Total Revenue, Total Enrollments, Total Participants and Avg Rating — plus 20 charts covering revenue, cost, session hours, session status, participants and satisfaction by program, trainer, client type and region.Professional Training and Coaching Dashboard in Google Sheets
How long does setup take?
Setup takes under 10 minutes. Copy the sheet to your Google Drive, paste your enrollment records into the Data tab using the same 13 columns, and update the dropdown lists. Every card, chart and slicer in the Professional Training and Coaching Dashboard recalculates automatically.
How does this compare to a paid training platform like TalentLMS or Arlo?
Training platforms bill monthly and are built to deliver courses. The Professional Training and Coaching Dashboard is a one-time $9.99 purchase built to report on the business — revenue, cost, trainer performance and client mix. Many training firms run both.
Can I add my own programs, trainers and regions?
Yes. Every dropdown in the Professional Training and Coaching Dashboard reads from an editable list. Add programs, categories, trainers, delivery modes, client types or regions and the slicers and charts pick them up without any formula changes.Professional Training and Coaching Dashboard in Google Sheets
Do I need Excel or any paid software?
No. The Professional Training and Coaching Dashboard runs entirely in Google Sheets, which is free with any Google account. There is no Excel licence, no install and no add-on to authorise. It works in any modern browser.Professional Training and Coaching Dashboard in Google Sheets
Can my whole team view the dashboard at once?
Yes. Because the Professional Training and Coaching Dashboard lives in Google Sheets, you share one link and everyone sees the same live numbers. There are no per-user fees, and viewers do not need to buy anything.Professional Training and Coaching Dashboard in Google Sheets
Is this an LMS — can I deliver courses through it?
No, and that is deliberate. The Professional Training and Coaching Dashboard is a reporting and analysis tool, not a learning management system. It will not host content, run assessments or log learners in. It tells you how the training business is performing.
👤 About the Author
Built by PK — Microsoft Certified Professional with 15+ years of Excel, Google Sheets, and Power BI experience. Founder of NextGenTemplates, reaching 300K+ subscribers across YouTube channels (@PK-AnExcelExpert, @NextGenTemplates, @NeoTechNavigators). Every template is hand-built and tested before release.Professional Training and Coaching Dashboard in Google Sheets
🔗 Explore Related Templates
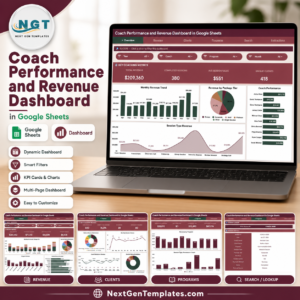
- Coach Performance and Revenue Dashboard in Google Sheets — zooms in on individual coach revenue and utilisation.
- Consulting Performance Dashboard in Google Sheets — the same client-and-margin logic for consulting engagements.
- Student Academic Insights Dashboard in Google Sheets — learner outcomes rather than business revenue.
- Business Development Performance Dashboard in Google Sheets — track the pipeline that fills your training calendar.
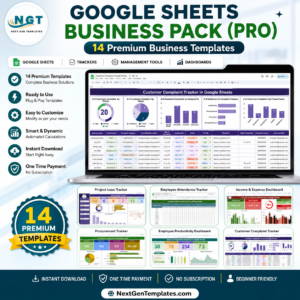
💎 Save 48% — get this and 13 more templates in the Google Sheets Business Pack (Pro) →Professional Training and Coaching Dashboard in Google Sheets
Also worth a look: the OKR Management Dashboard in Excel for goal tracking, and the wider Excel Dashboard Templates collection.
📖 Click here to read the Detailed Blog Post<
Watch the step-by-step video Demo:
🎥 Visit our YouTube channel for step-by-step video tutorials
👉 YouTube.com/@NextGenTemplates
📅 Last updated: July 2026
Compatibility and Requirements
- Works in Google Sheets. You need a free Google account and a web browser.
- Each page has slicers for filtering. Google explains charts in Add and edit a chart or graph.
Related Training and Coaching Templates
- Professional Training & Coaching Dashboard in Excel: the same topic in Excel
- Professional Training & Coaching Dashboard in Power BI: the Power BI edition
- Training and Development Dashboard in Google Sheets: a training view for HR and L&D teams
- Training Completion Certification Tracker in Google Sheets: track who has completed which course
Browse all Google Sheets dashboards.














Reviews
There are no reviews yet.