

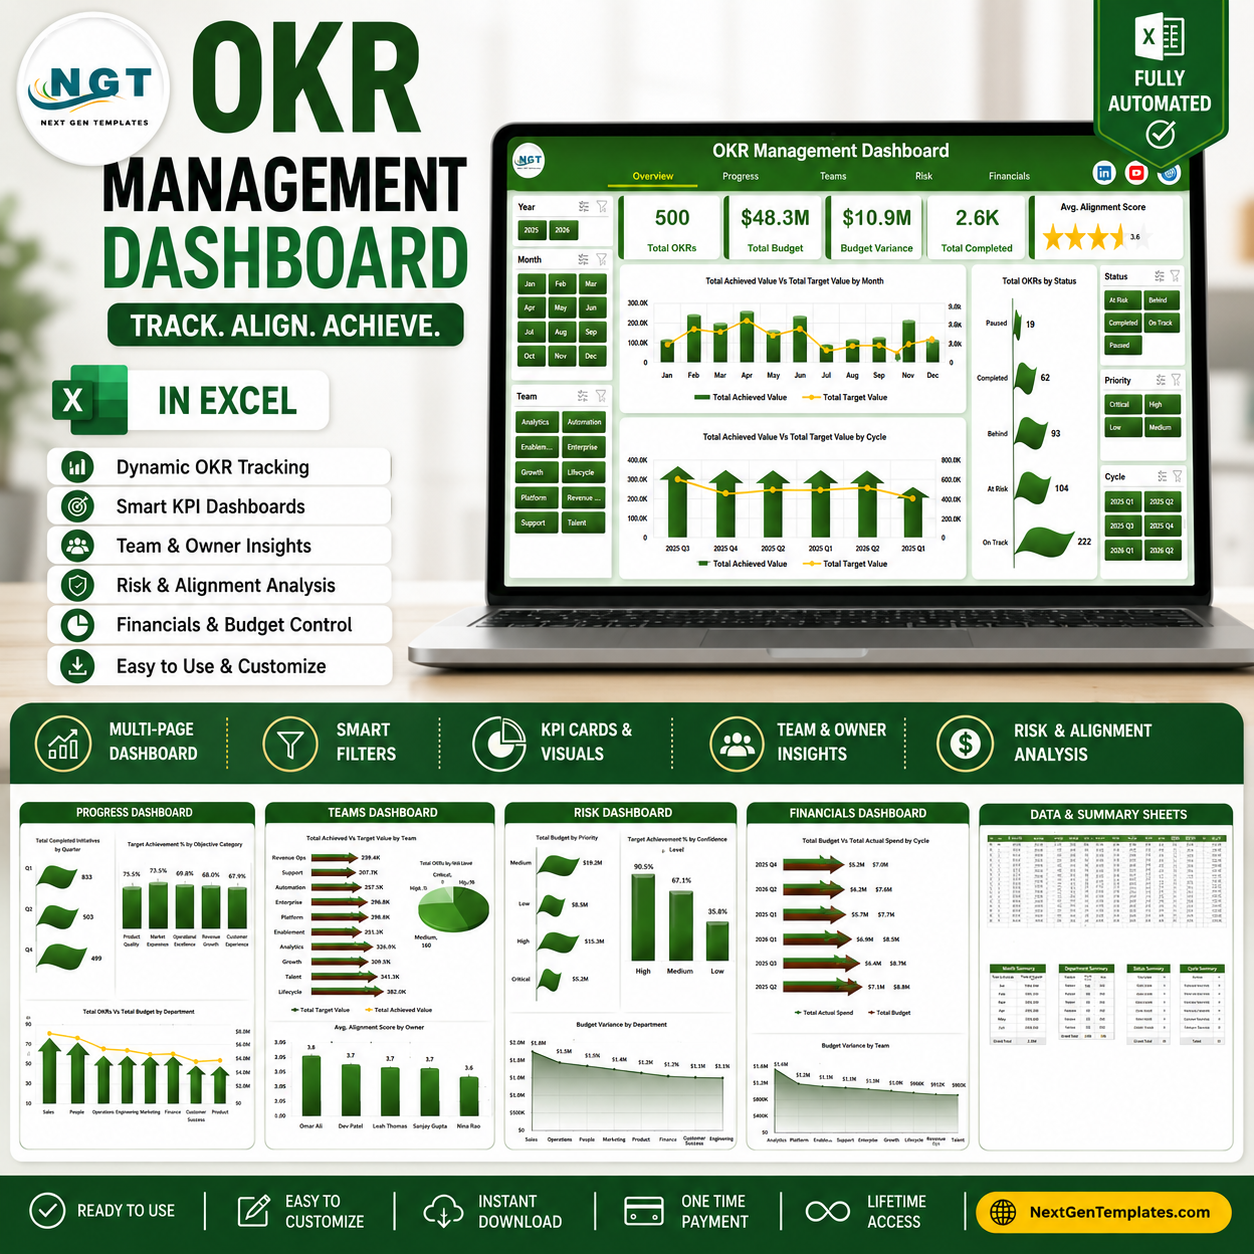



OKR Management Dashboard in Excel gives leadership teams 7 workbook tabs, 5 executive KPI cards, and 16 focused chart views for tracking objectives, key results, initiatives, budget, alignment, risk, and financial progress in one editable Excel file. Built for teams that need practical OKR visibility without another SaaS subscription, it uses familiar Excel tables, slicers, charts, and pivot tables. You get an instant download, a one-time payment, and a workbook you can review before publishing internally.
Use it to replace scattered OKR status sheets with a single reporting model. Add or replace records in the Data Sheet, click Refresh All from the Excel Data tab, and the dashboard pages update from the support pivots.
Key Features of OKR Management Dashboard in Excel
- Five high-level cards: Total OKRs, Total Budget, Budget Variance, Total Completed, and Avg. Alignment Score summarize the portfolio position quickly.
- Five analysis pages: Overview, Progress, Teams, Risk, and Financials cover execution, ownership, confidence, budget, and spend.
- Interactive slicers: Filter the dashboard quickly by the available OKR dimensions so leadership can review selected cycles, teams, owners, departments, priorities, or statuses.
- Pivot-driven design: The Support Sheet powers the charts and cards, so users can refresh the workbook after updating the source data.
- No SaaS subscription: The file runs in Microsoft Excel and can be customized to match your OKR process, labels, categories, and reporting cadence.
What’s Inside the OKR Management Dashboard in Excel
Overview Page: The top cards show Total OKRs, Total Budget, Budget Variance, Total Completed, and Avg. Alignment Score. Charts compare achieved value with target value by month and cycle, while the status chart shows how OKRs are distributed across the completion pipeline.
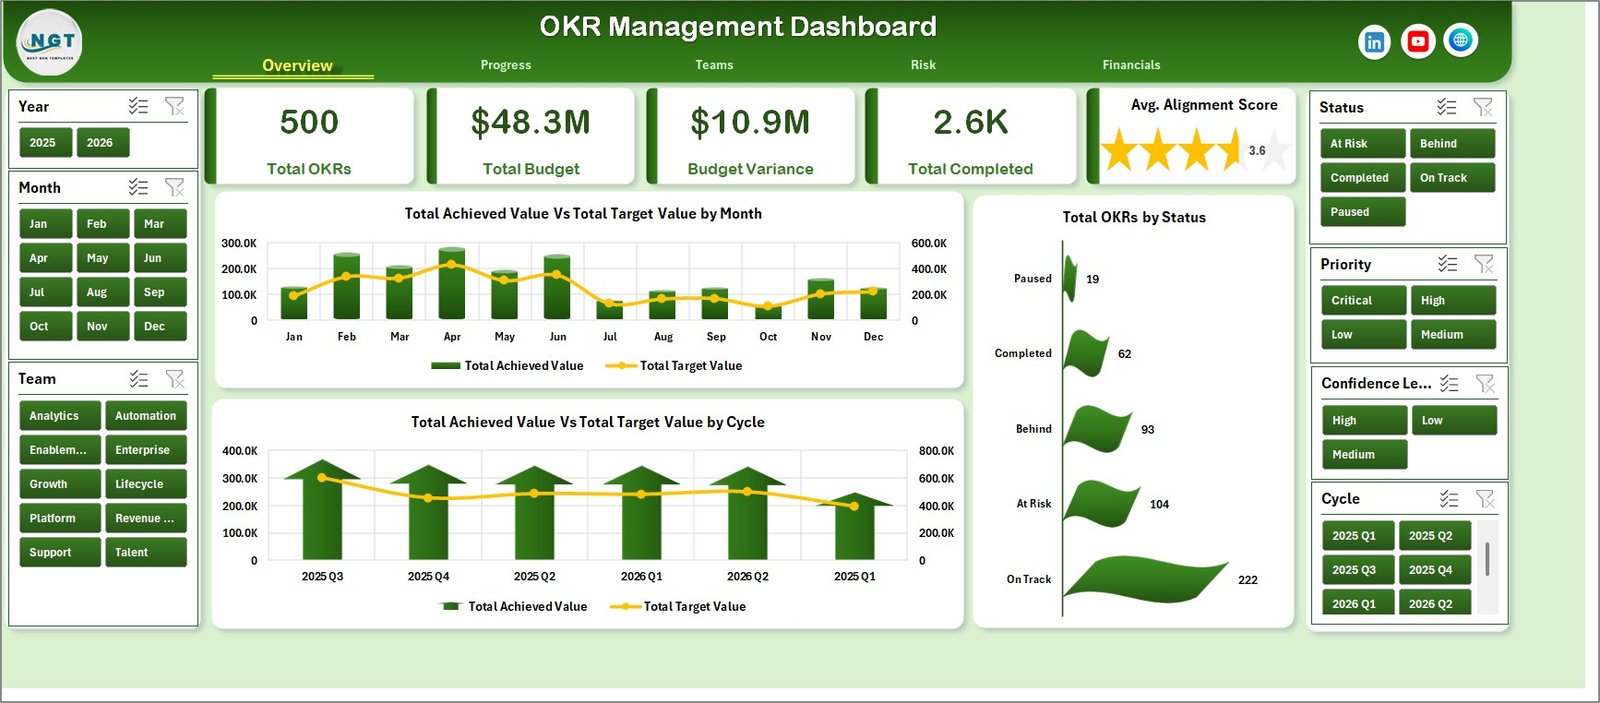
OKR Management Dashboard in Excel
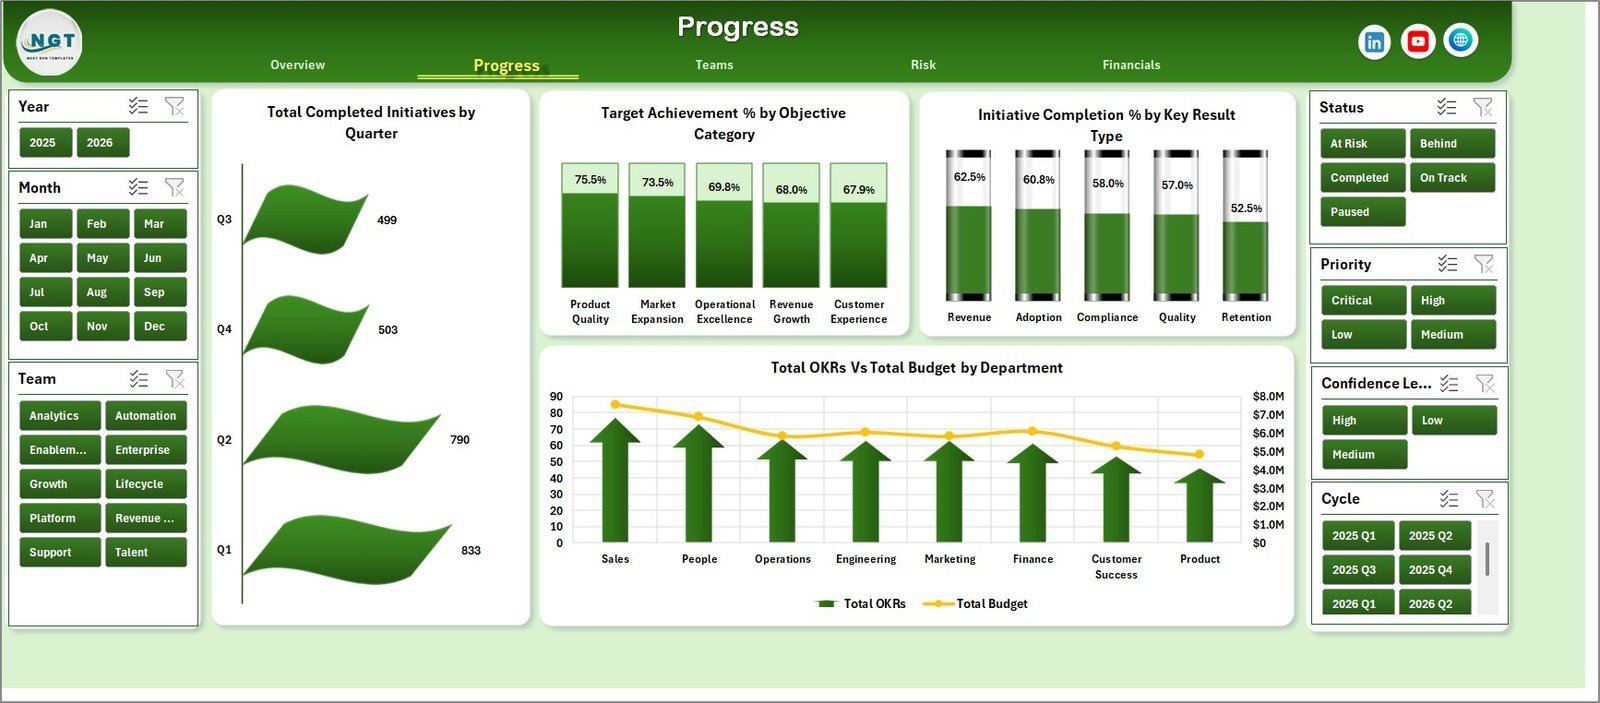
Progress Page: This page tracks completed initiatives by quarter, target achievement percentage by objective category, initiative completion percentage by key result type, and OKRs plus budget by department.
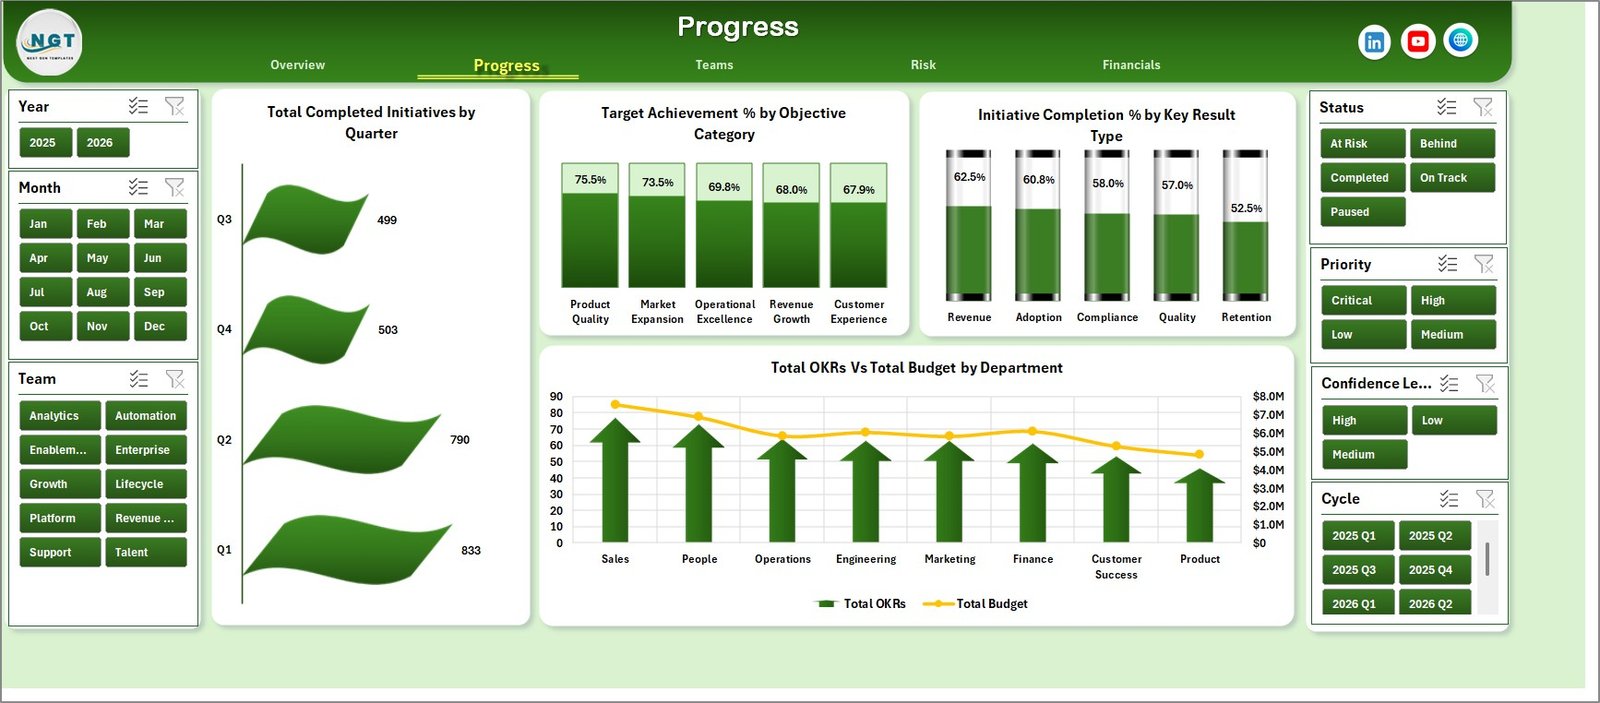
Progress
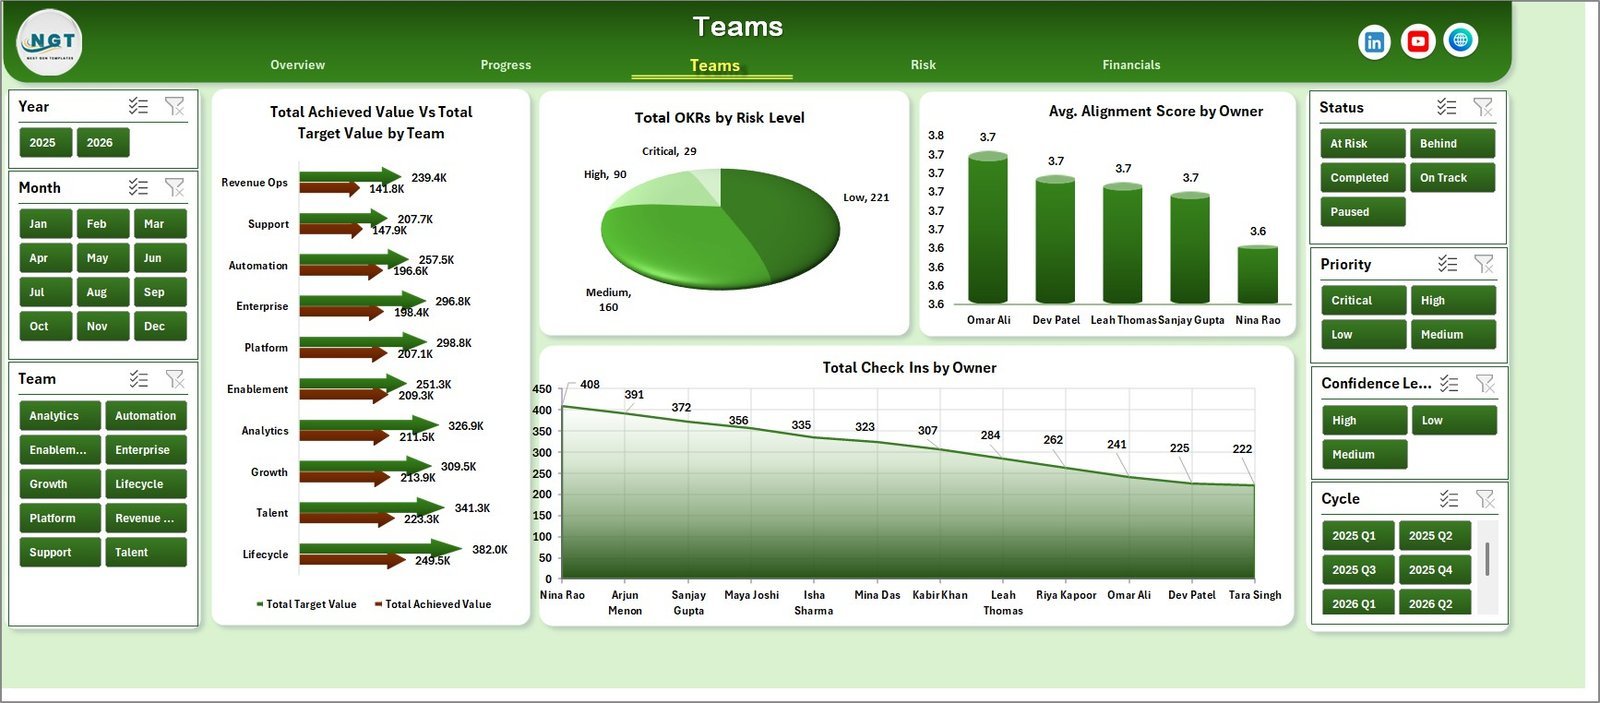
Teams Page: Compare target and achieved value by team, review OKR count by risk level, check average alignment score by owner, and monitor check-ins by owner.
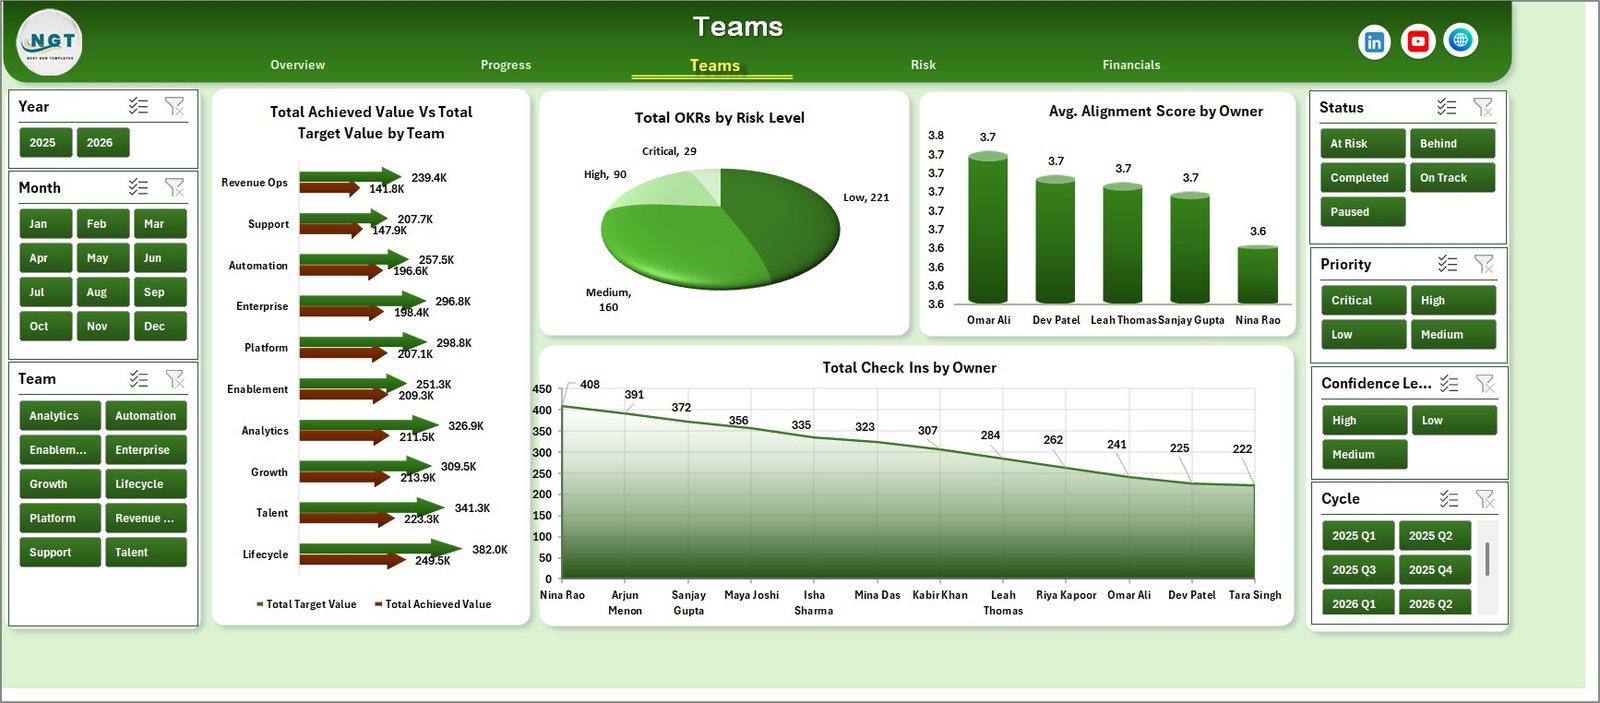
Teams
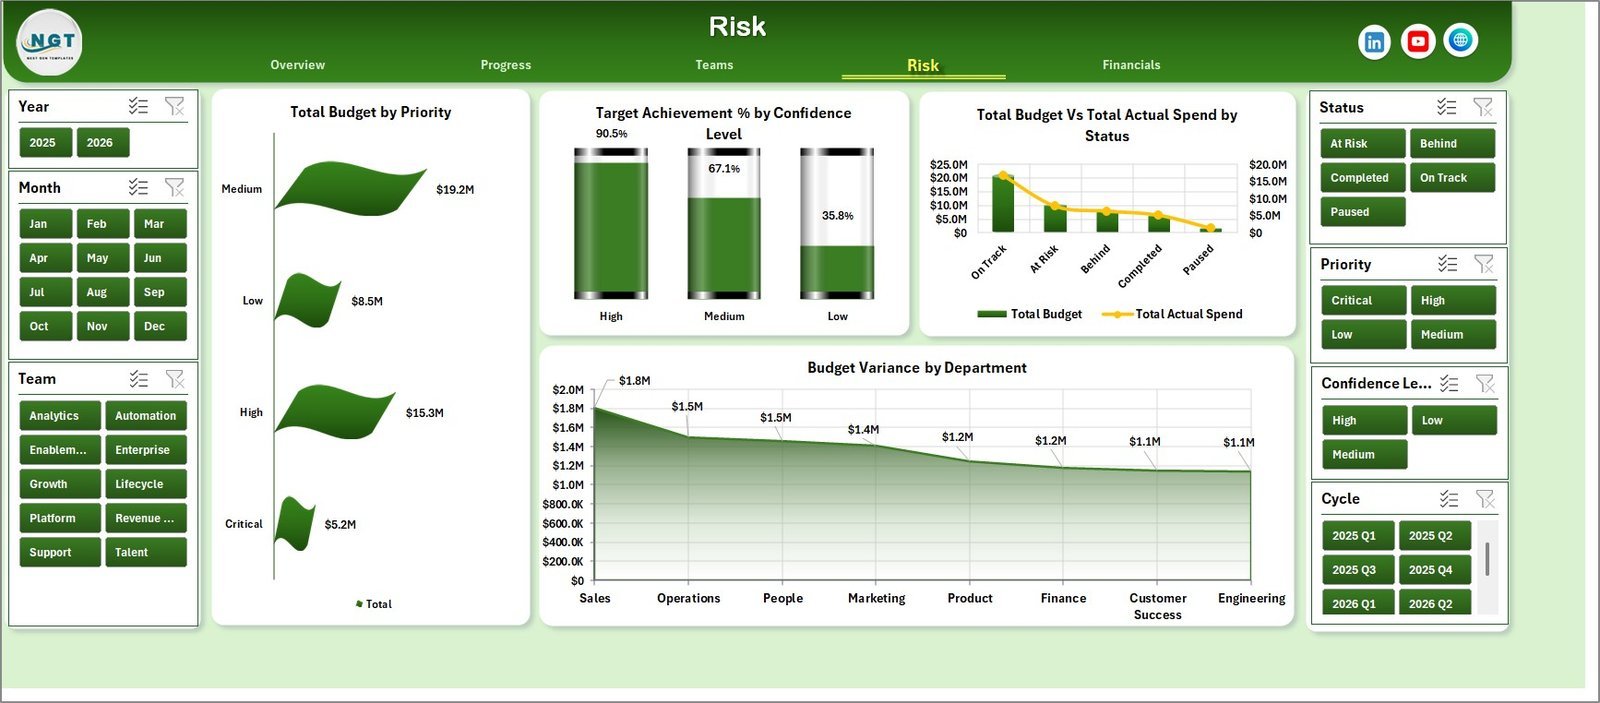
Risk Page: Review total budget by priority, target achievement percentage by confidence level, budget and actual spend by status, and budget variance by department.
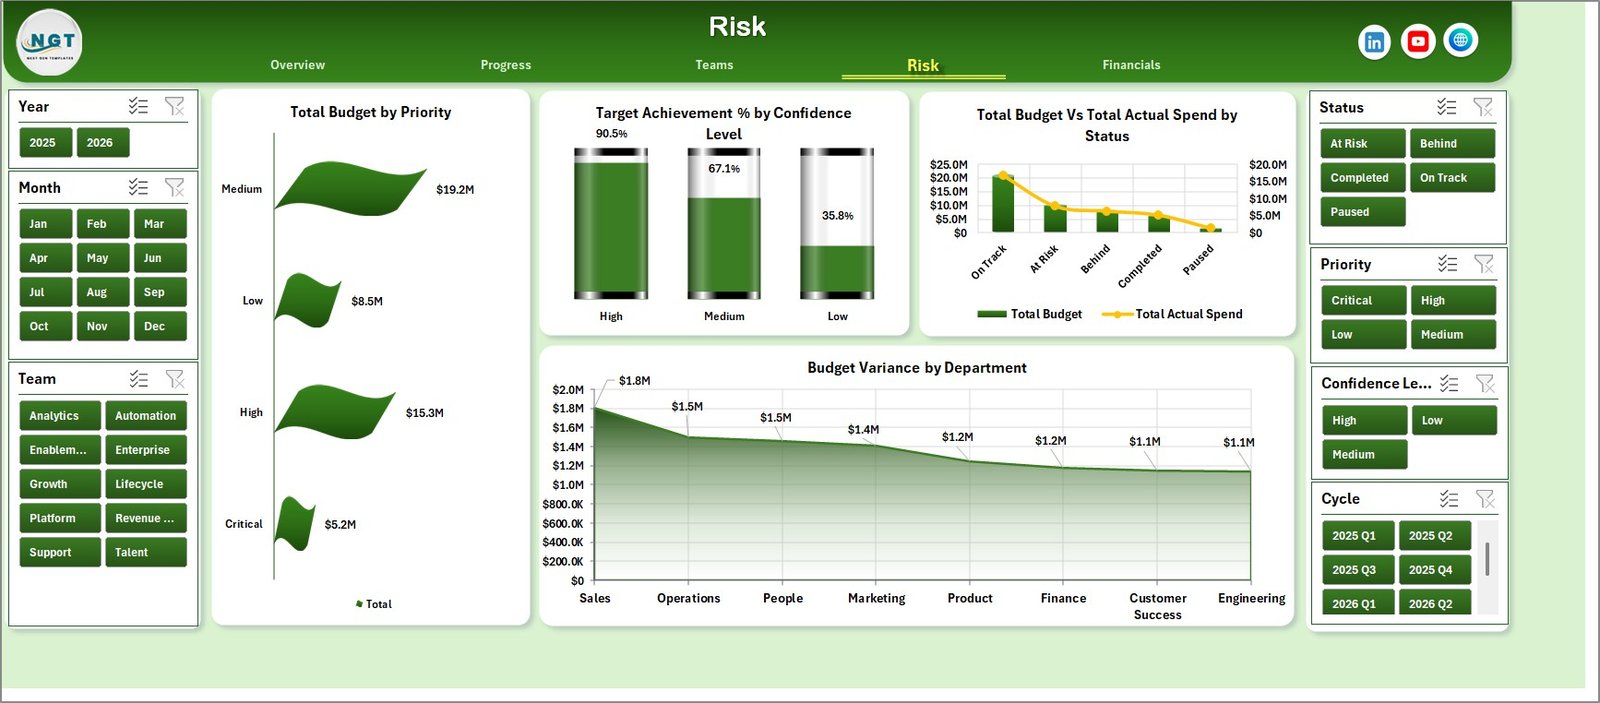
Risk
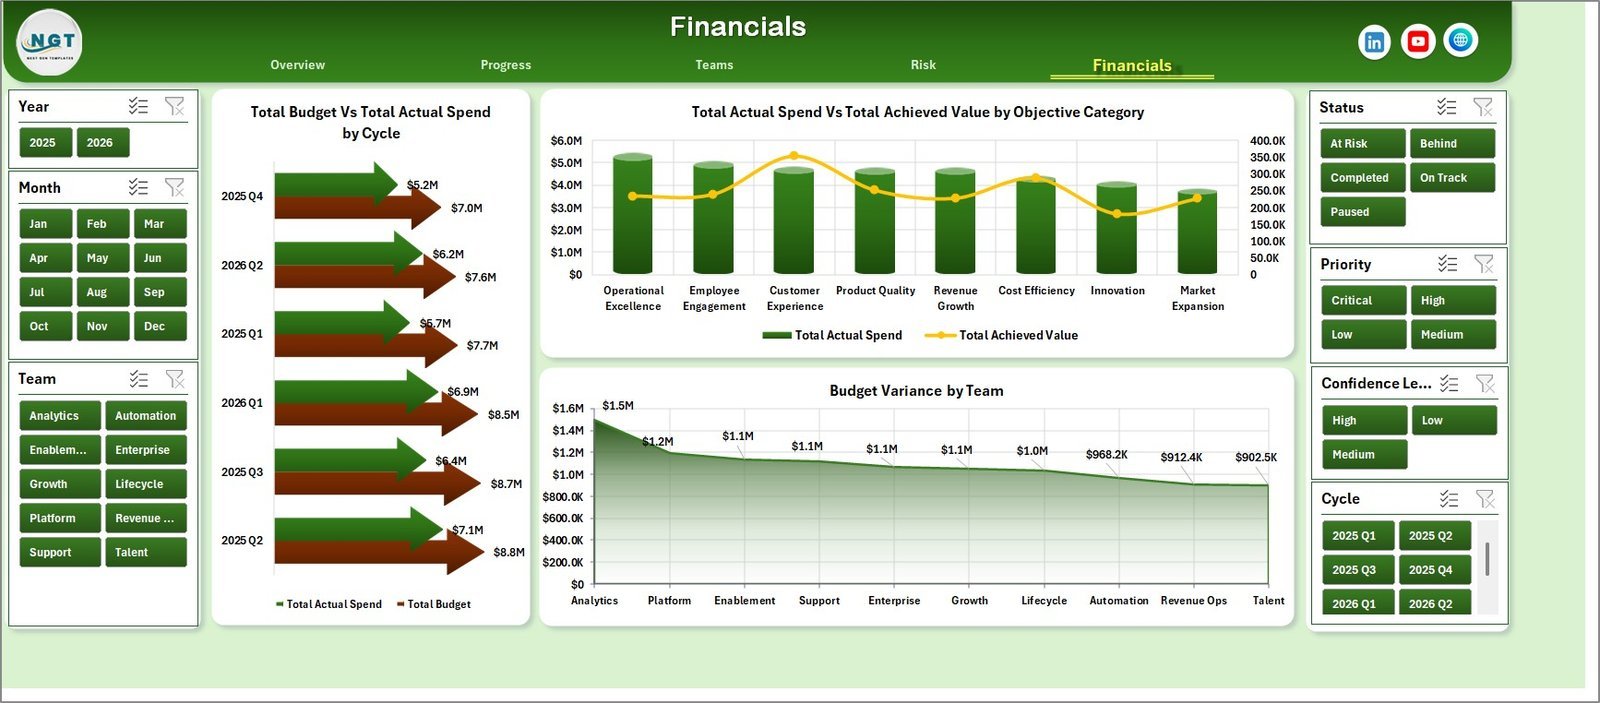
Financials Page: Analyze budget and actual spend by cycle, compare actual spend with achieved value by objective category, and review budget variance by team.
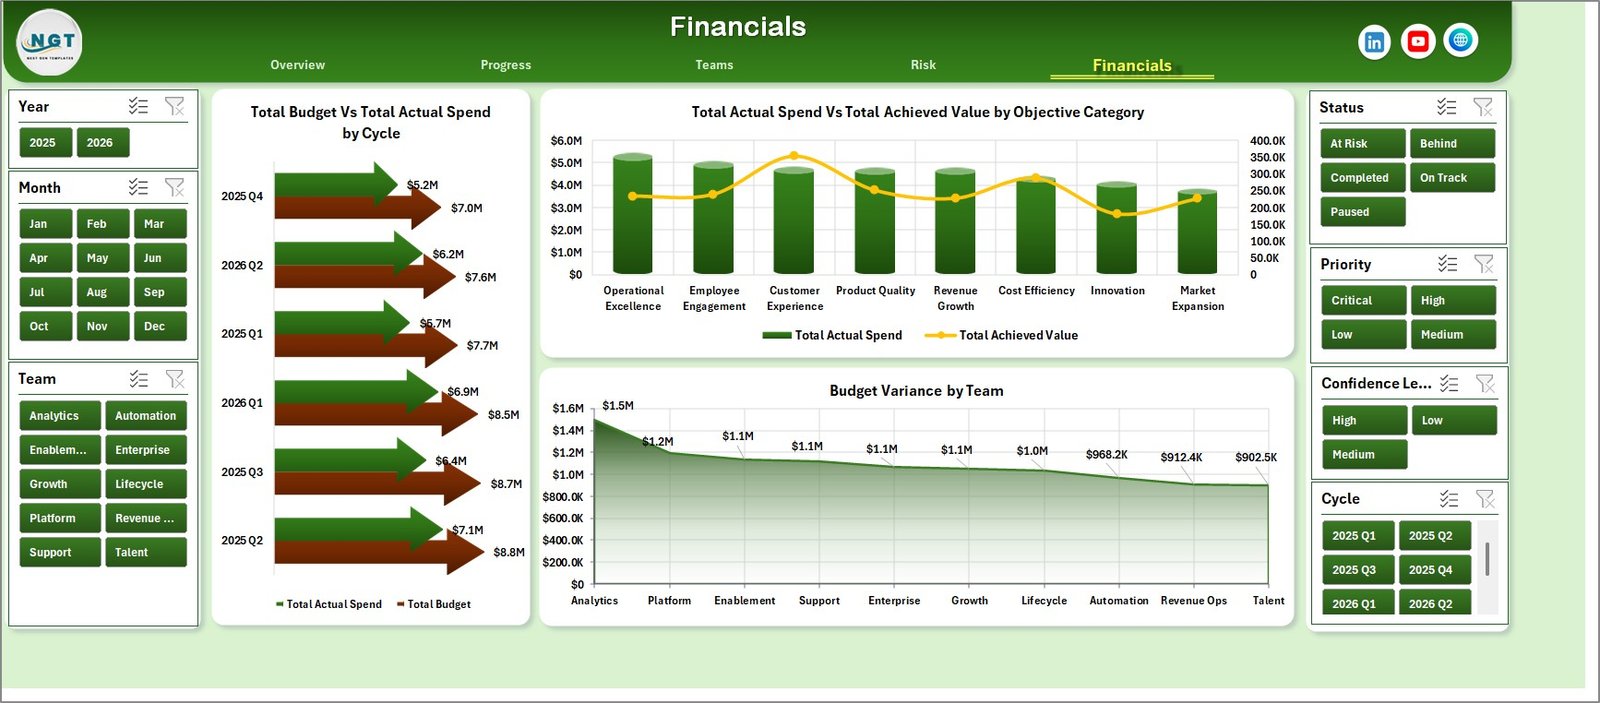
Financials
Data Sheet Tab: Enter or replace your OKR records in the same table format. Keeping the source columns consistent allows the pivots and dashboard visuals to refresh correctly.

Data Sheet tab
Support Sheet: The hidden back-end sheet contains the pivot tables used to build the dashboard. After updating data, go to the Excel Data tab and click Refresh All. You can keep this sheet hidden during normal use.

Support sheet tab
OKR Management Dashboard in Excel vs. Google Sheets vs. Paid CRM/SaaS – Where This Fits
| Feature | OKR Management Dashboard in Excel | Google Sheets alternative | Paid OKR SaaS |
|---|---|---|---|
| Cost | $17.99 one-time | Free to build, but requires setup time | Monthly subscription |
| Platform | Microsoft Excel | Browser spreadsheet | Cloud application |
| Setup time | Replace data and refresh | Manual build | Vendor onboarding |
| Custom fields | Editable workbook | Editable formulas | Plan-dependent |
| Year-1 cost at 5 users | $17.99 total | Build hours plus workspace cost | Often hundreds or thousands per year |
Who This Template Is For – and Who It’s Not For
This template is useful for founders, strategy leaders, PMOs, department heads, operations teams, and consultants who run quarterly OKR reviews in Excel. It is not a replacement for enterprise OKR software with automated check-ins, permissions, notifications, or HR system integrations.
How to Use the OKR Management Dashboard in Excel
- Download and open the workbook in Microsoft Excel.
- Go to the Data Sheet tab and replace the sample records with your OKR data.
- Keep the same column format for cycles, teams, owners, departments, statuses, budget, actual spend, target value, achieved value, and alignment score.
- Click Data > Refresh All to update all pivot tables and charts.
- Use slicers on the dashboard pages to review specific cycles, teams, objectives, or owners.
Real-World Use Cases
Strategy lead: Reviews total OKRs, target achievement, and budget variance before the monthly leadership meeting.
Department head: Filters the dashboard by department to compare completed initiatives, budget, and alignment score.
Consultant: Uses the workbook as a client-ready OKR reporting template during quarterly business reviews.
Frequently Asked Questions
What does the OKR Management Dashboard in Excel track?
It tracks OKRs, budgets, budget variance, completed initiatives, achieved value, target value, alignment score, risk level, confidence level, owners, teams, departments, cycles, and check-ins.
Can I add my own OKR data?
Yes. Replace the sample data in the Data Sheet tab while keeping the same column format, then refresh all pivots.
Does it require macros?
No. The dashboard is designed around Excel tables, slicers, charts, and pivot tables.
Can I customize the dashboard?
Yes. You can edit charts, formulas, labels, colors, fields, and source records because it is a normal Excel workbook.
Does it replace OKR software?
No. It is a reporting and analysis workbook, not a full OKR workflow platform with reminders, permissions, and automated collaboration.
About the Author
Built by PK – Microsoft Certified Professional with 15+ years of Excel, Google Sheets, and Power BI experience. Founder of NextGenTemplates, reaching 300K+ subscribers across YouTube channels. Every template is hand-built and tested before release.
Explore Related Templates
Browse more Excel Dashboard Templates and Project Management Excel Templates on NextGenTemplates.
Click here to read the Detailed Blog Post
Get the OKR Management Dashboard in Excel today and turn quarterly OKR tracking into a clearer, faster review process.
Last updated: July 2026































Reviews
There are no reviews yet.