
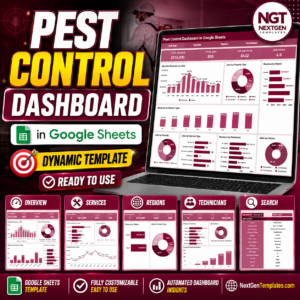
The Pest Control Dashboard in Google Sheets turns raw service-job records into a four-KPI command center spread across 6 interactive sheets, with 14 pre-built charts and native slicer filters. It tracks Total Revenue, Total Jobs, Average Job Value, and Average Rating, then slices performance by service type, region, technician, property type, severity, and service plan. Setup takes under 10 minutes – paste your jobs into the Data sheet and every chart, KPI card, and slicer recalculates automatically.
🌍 Join 8,400+ teams in 40+ countries using NextGenTemplates to replace costly field-service SaaS with one-time-purchase Excel, Google Sheets, Power BI, and HTML templates.
✅ Instant download – One-time payment – No subscription – No per-technician fees – Lifetime access
🔑 Key Features of the Pest Control Dashboard in Google Sheets
📊 Four live KPI cards sit at the top of the Overview sheet – Total Revenue, Total Jobs, Average Job Value, and Average Rating – recalculating the moment you add or edit a job, so you always see current performance without touching a formula.
🎯 Native Google Sheets slicers let you filter the entire dashboard by service type, region, technician, or date range in one click. Because the dashboard is built on pivot tables and slicers, filtering is instant and needs no scripting.
📈 14 pre-built charts across four analysis sheets cover revenue, jobs, severity, ratings, and service plans. Every chart range auto-expands as new rows are added, so your visuals stay accurate as the business grows.
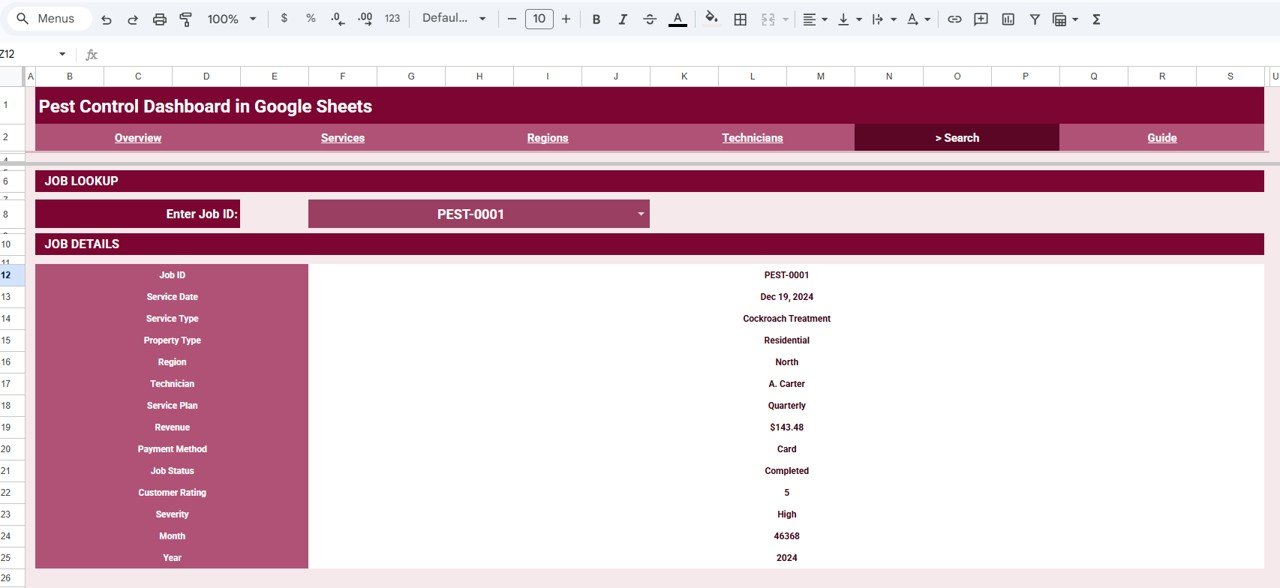
🔎 A dedicated Search sheet returns 13 details for any Job ID – service date, type, property, region, technician, plan, revenue, payment method, status, rating, severity, month, and year – turning the sheet into a lightweight job-lookup tool.
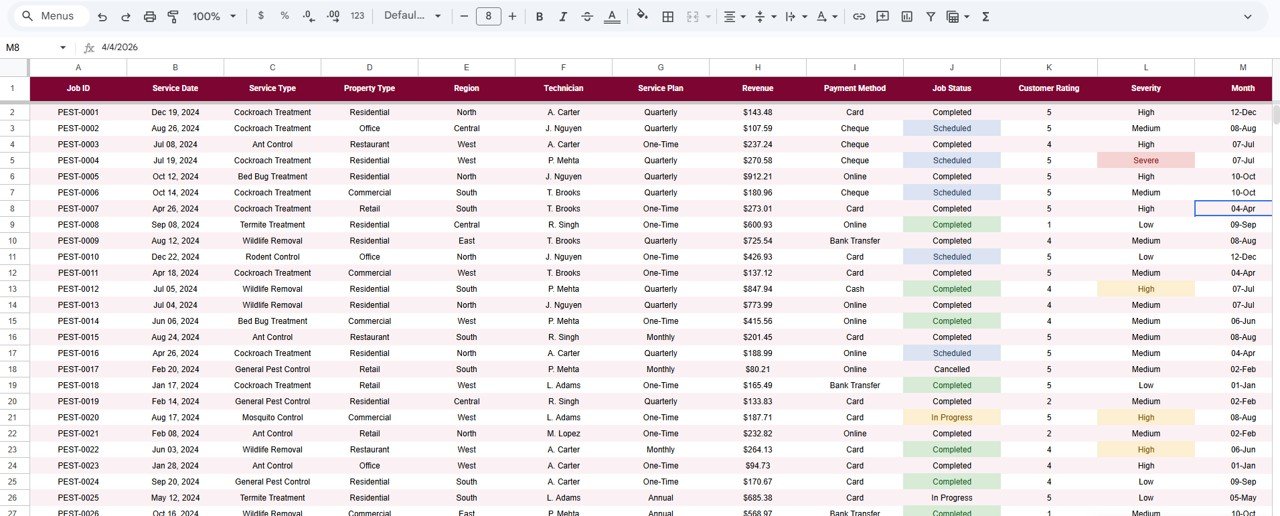
🧩 One clean Data sheet holds every record in a fixed column layout. Replace the sample rows with your own data and the four analysis pages plus the Overview update together, with no rebuilding required.
📦 What is Inside the Pest Control Dashboard in Google Sheets
1. Overview Page
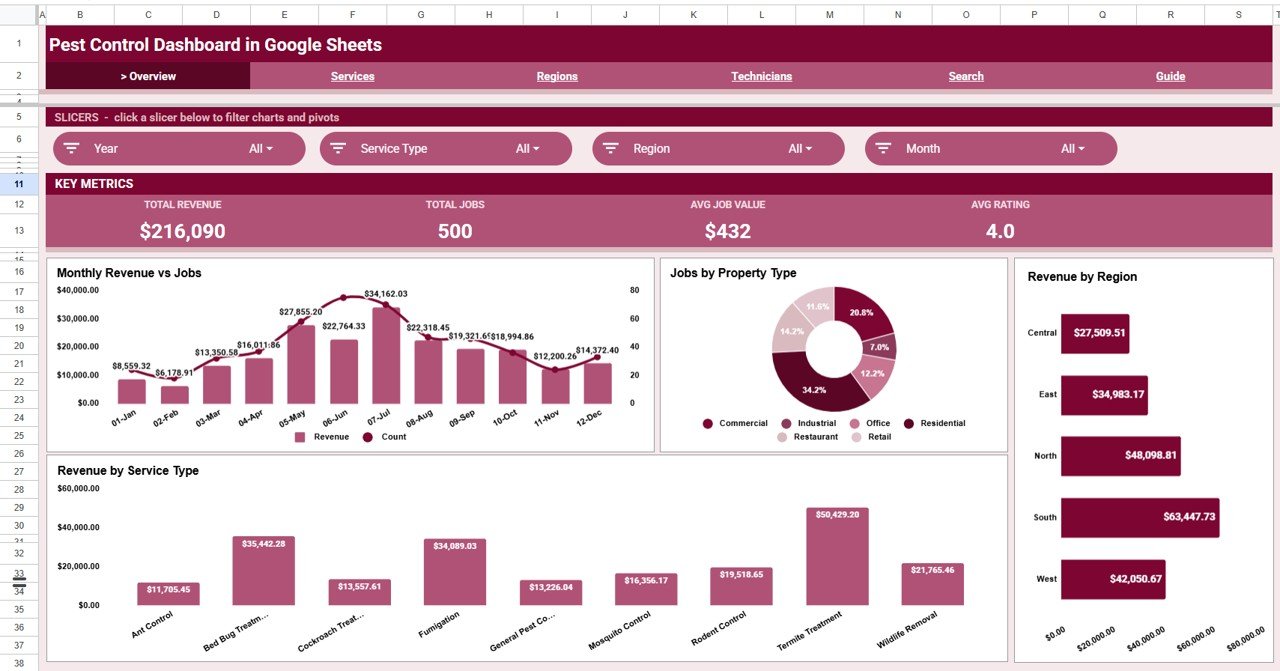
The Overview sheet opens with the four headline cards (Total Revenue, Total Jobs, Average Job Value, Average Rating) and a set of slicers for fast filtering. Its four charts are:
🔹 Monthly Revenue vs Jobs – a combined trend that plots revenue against job count month by month, making seasonal demand and value-per-job shifts easy to spot.
🔹 Jobs by Property Type – shows how completed jobs split across residential, commercial, and industrial properties so you can see where demand concentrates.
🔹 Revenue by Region – ranks each service region by revenue to highlight your strongest and weakest territories.
🔹 Revenue by Service Type – compares income across service types such as general pest, termite, and rodent control to reveal the most profitable work.
 Pest Control Dashboard in Google Sheets
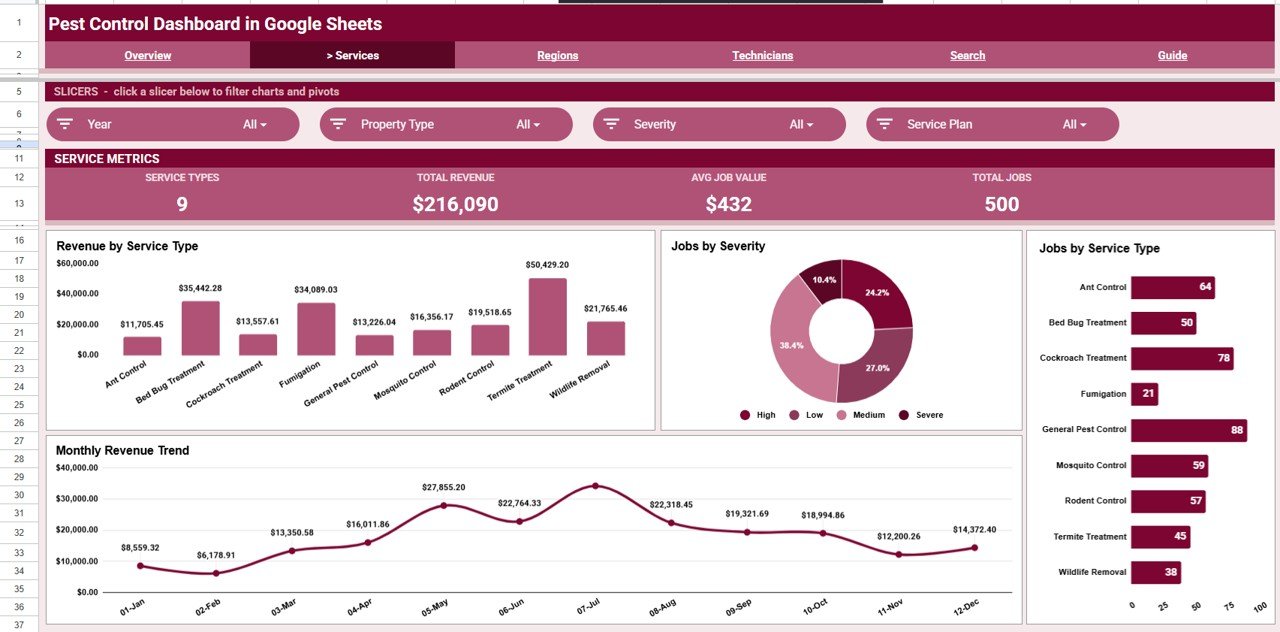
2. Services
The Services sheet drills into what you sell, with four charts: Revenue by Service Type, Jobs by Severity, Jobs by Service Type, and a Monthly Revenue Trend. Together they show which services drive income and how infestation severity spreads across your job mix.
 Services
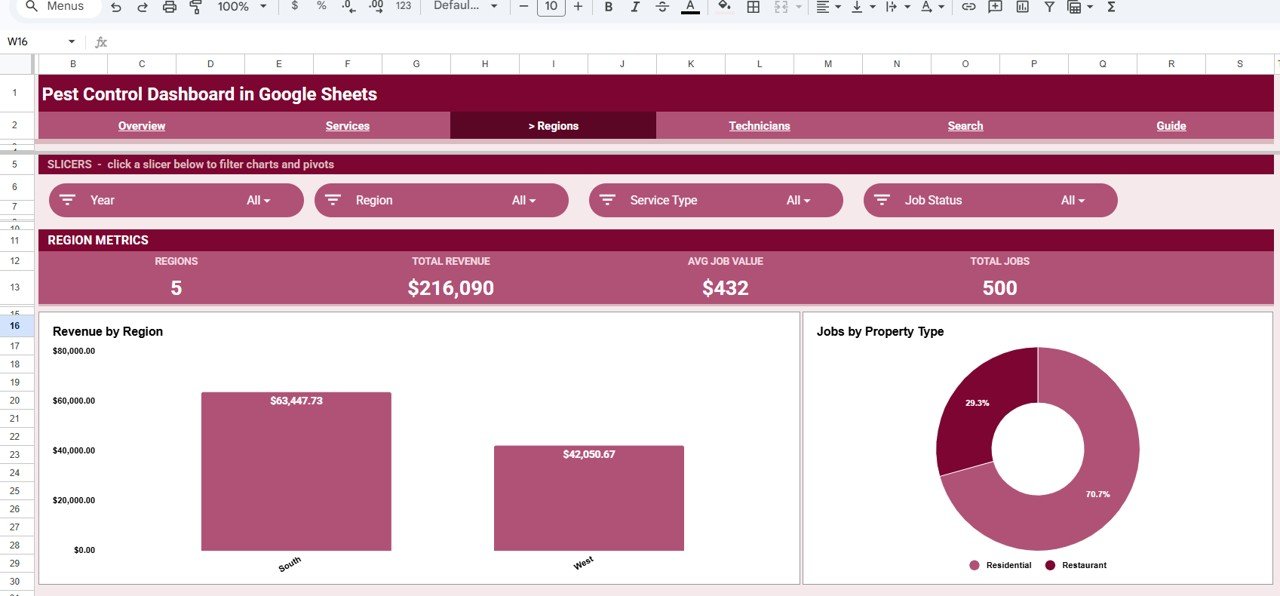
3. Regions
The Regions sheet focuses on geography, pairing Revenue by Region with Jobs by Property Type so you can see not just where revenue comes from, but what kind of properties drive work in each area.
 Regions
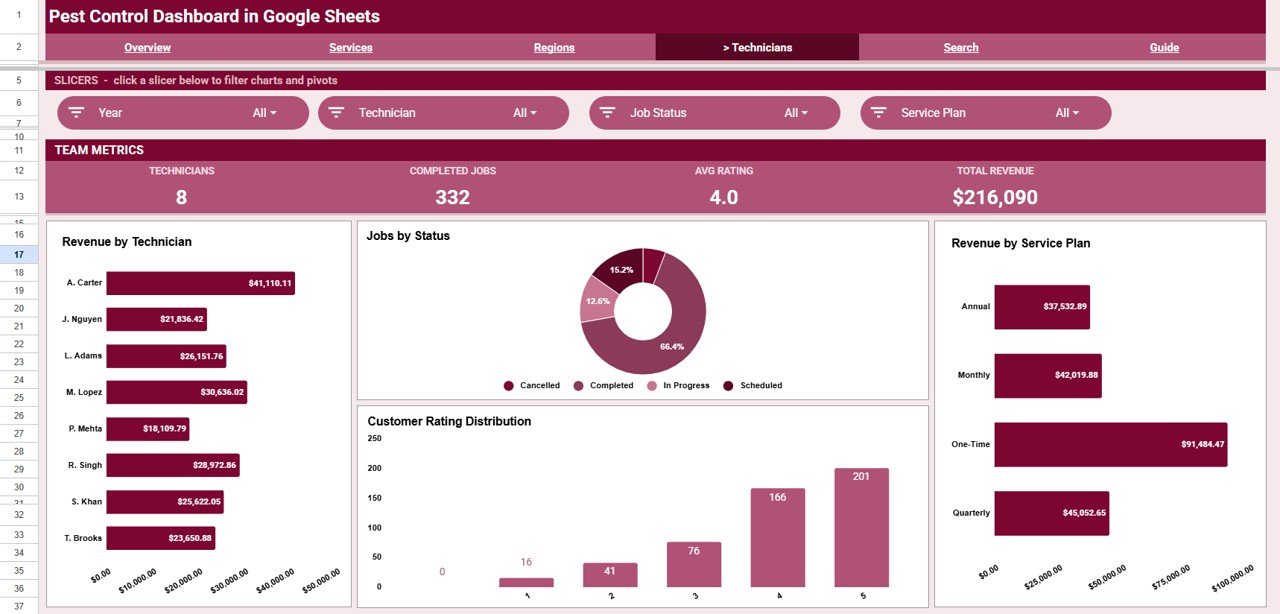
4. Technicians
The Technicians sheet measures delivery and quality with four charts: Revenue by Technician, Jobs by Status, Customer Rating Distribution, and Revenue by Service Plan. Use it to compare technician output, monitor open versus completed jobs, and see how one-time versus recurring plans contribute to revenue.
 Technicians
5. Search Sheet tab
Enter any Job ID on the Search sheet and it instantly returns that job’s Service Date, Service Type, Property Type, Region, Technician, Service Plan, Revenue, Payment Method, Job Status, Customer Rating, Severity, Month, and Year – a fast way to pull a single record without scrolling the data.
 Search Sheet tab
6. Data Sheet tab
The Data sheet is your single source of truth. Add each job as a new row in the same column format and the Overview and all four analysis sheets update automatically, keeping the whole dashboard in sync.
 Data Sheet tab
📊 Pest Control Dashboard in Google Sheets vs. Excel vs. Paid Field-Service SaaS – Where This Fits
| Feature | Pest Control Dashboard (Google Sheets) | Microsoft Excel Dashboard | Jobber / Housecall Pro |
|---|---|---|---|
| Cost | $9.99 one-time | $9.99 one-time | $29 to $149 / user / month |
| Platform | Google Sheets (cloud, free) | Desktop Excel | Proprietary web and app |
| Setup time | Under 10 minutes | Under 10 minutes | Hours plus onboarding |
| Real-time team collaboration | Yes, built in | Limited | Yes |
| Mobile access | Yes, Sheets app | Limited | Yes |
| Customizable fields | Yes, fully editable | Yes, fully editable | No, vendor-locked |
| Share with a link | Yes | No | Yes |
| Per-technician fees | None | None | Charged per seat |
| Year-1 cost at 5 users | $9.99 total | $9.99 total | $1,740 to $8,940 |
For pest-control operators who want clear revenue, job, and technician analytics without paying per-seat SaaS fees, the Pest Control Dashboard in Google Sheets sits in the sweet spot.
👥 Who This Template Is For – and Who It is Not For
✅ This template is built for:
- Independent and small-to-midsize pest-control companies tracking jobs, revenue, and technicians in one place
- Field-service owners who already use Google Workspace and want analytics without new software
- Operations managers who need quick regional, service, and technician breakdowns for weekly reviews
❌ This template is NOT for:
- Companies needing live route optimization, GPS dispatch, or automated customer SMS – use a dedicated field-service platform
- Teams that require built-in invoicing and payment processing inside the same tool
- Enterprises that need role-based permissions and audit logging at scale
⚙️ How to Use the Pest Control Dashboard in Google Sheets
- Open the PDF in your download and click the Google Sheets copy link to save your own editable copy to Google Drive.
- Go to the Data sheet and replace the sample rows with your own jobs, keeping the same columns.
- Return to the Overview sheet – the four KPI cards and charts update automatically.
- Use the slicers to filter by service type, region, technician, or date range.
- Open the Search sheet and type a Job ID to pull full details for any single job.
💼 Real-World Use Cases
Marcus owns a six-technician pest-control firm. He pastes last month’s jobs into the Data sheet and uses the Technicians page to compare revenue per technician and spot who has the most cancelled jobs, without paying $49 per seat for field-service software.
Priya manages operations for a regional pest company. Each Monday she filters the Overview by region using slicers, then screenshots Revenue by Region and Monthly Revenue vs Jobs for her leadership update.
Dan, a solo operator, uses the Search sheet to look up a customer’s last service date and severity before a callback, treating the dashboard as a simple job log and analytics tool in one.
❓ Frequently Asked Questions
What KPIs does the Pest Control Dashboard in Google Sheets track?
The Pest Control Dashboard in Google Sheets tracks four headline KPIs – Total Revenue, Total Jobs, Average Job Value, and Average Rating – plus breakdowns by service type, region, technician, property type, severity, and service plan across its analysis sheets.
How long does setup take?
Setup takes under 10 minutes. Make your own copy, paste your jobs into the Data sheet in the existing column format, and the Overview KPIs, 14 charts, and slicers update automatically with no formulas to build.
Do I need Excel or any paid software?
No. The Pest Control Dashboard in Google Sheets runs entirely in free Google Sheets. You only need a Google account; there is no subscription, install, or per-technician fee.
How does this compare to Jobber or Housecall Pro?
Field-service platforms like Jobber and Housecall Pro charge $29 to $149 per user each month and lock your data in. The Pest Control Dashboard in Google Sheets is a one-time $9.99 purchase you fully own and can customize, focused on analytics rather than dispatch.
Can multiple team members use it at once?
Yes. Because it lives in Google Sheets, you can share the file with your team and several people can view or edit at the same time, with changes syncing in real time.
Can I add my own service types or regions?
Yes. Every field is editable – add your own service types, regions, technicians, and service plans in the Data sheet and the charts and slicers adjust automatically.
👤 About the Author
Built by PK – Microsoft Certified Professional with 15+ years of Excel, Google Sheets, and Power BI experience. Founder of NextGenTemplates, reaching 300K+ subscribers across YouTube channels (@PK-AnExcelExpert, @NextGenTemplates, @NeoTechNavigators). Every template is hand-built and tested before release.
🔗 Explore Related Templates
Browse more Google Sheets Dashboards, or explore these service-business favorites:
- 🚚 Moving Company Dashboard in Google Sheets – revenue, jobs, and crew analytics for movers.
- 📷 Photography Business Dashboard in Google Sheets – bookings and revenue tracking for studios.
- 🏥 Telehealth Dashboard in Google Sheets – appointment and revenue analytics for clinics.
- 🛠️ Equipment Maintenance Management System Web App – log and track field maintenance jobs.
📖 Click here to read the Detailed Blog Post
Watch the step-by-step video tutorial:
🎥 Visit our YouTube channel for step-by-step video tutorials
👉 YouTube.com/@NextGenTemplates
📅 Last updated: June 2026


Reviews
There are no reviews yet.