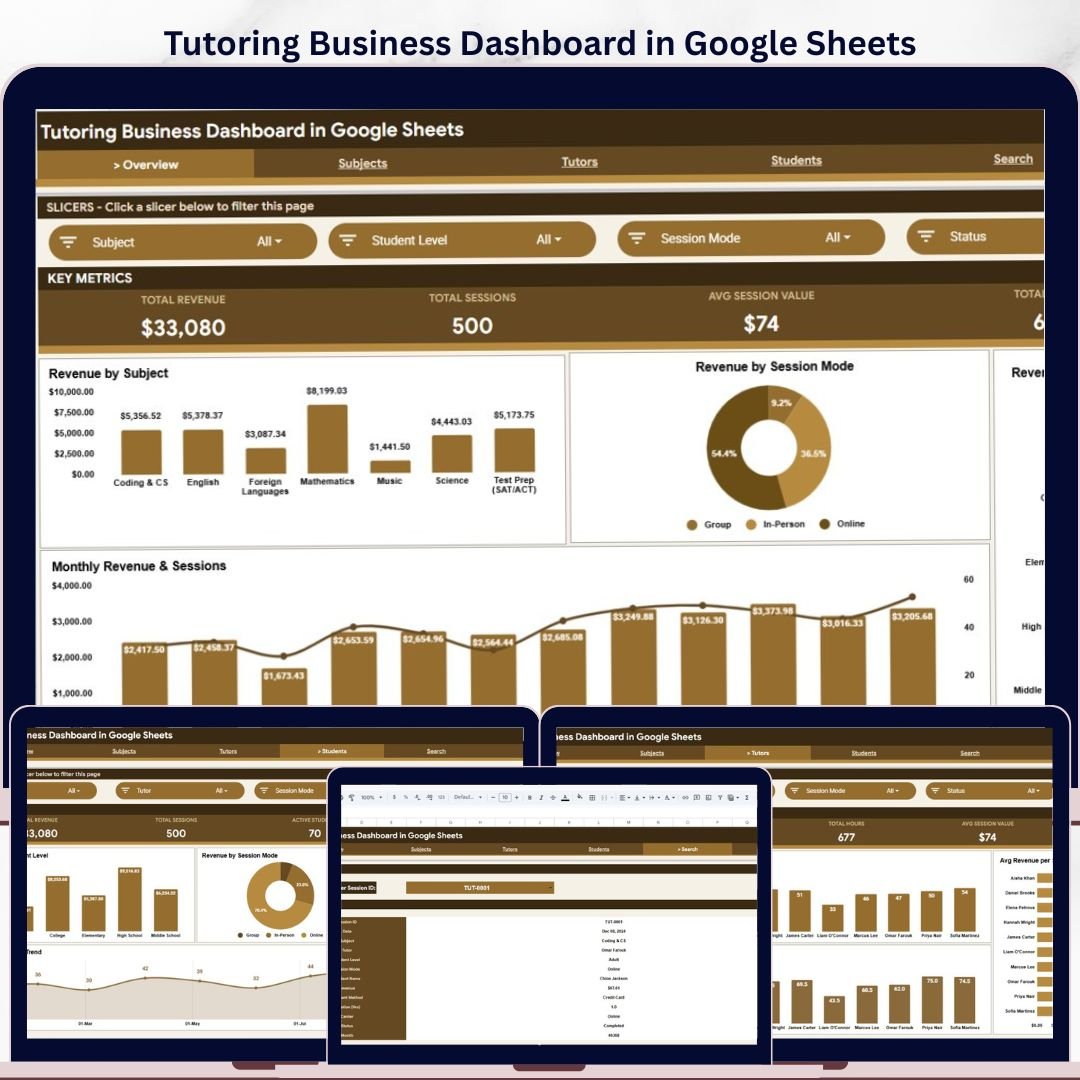
The Tutoring Business Dashboard in Google Sheets tracks 4 headline KPIs across 6 connected tabs, with 16 pre-built charts and clickable slicers. Setup takes under 10 minutes – paste your session records into the Data tab and every KPI card, chart, and filter updates automatically.
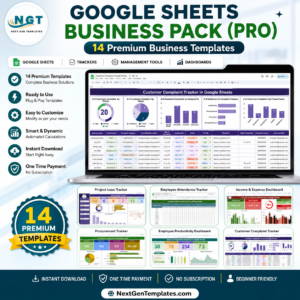
🌍 Join 8,400+ teams in 40+ countries using NextGenTemplates to replace paid SaaS subscriptions with one-time-purchase Excel, Google Sheets, Power BI, and HTML templates.
✅ Instant download · One-time payment · No subscription · No per-user fees · Lifetime access
🔑 Key Features of the Tutoring Business Dashboard in Google Sheets
Everything in this Google Sheets tutoring tracker is driven by one Data tab, so your numbers stay consistent across every page:
📊 4 live KPI cards – Total Revenue, Total Sessions, Average Session Value, and Total Hours sit at the top of the Overview tab and recalculate the moment you add or edit a session.
📈 16 pre-built charts – spread across the Overview, Subjects, Tutors, and Students tabs, covering revenue, session counts, hours, and per-session averages by subject, tutor, student level, and session mode.
🎚️ Native Google Sheets slicers – click to filter the entire Overview by subject, session mode, or student level without writing a single formula.
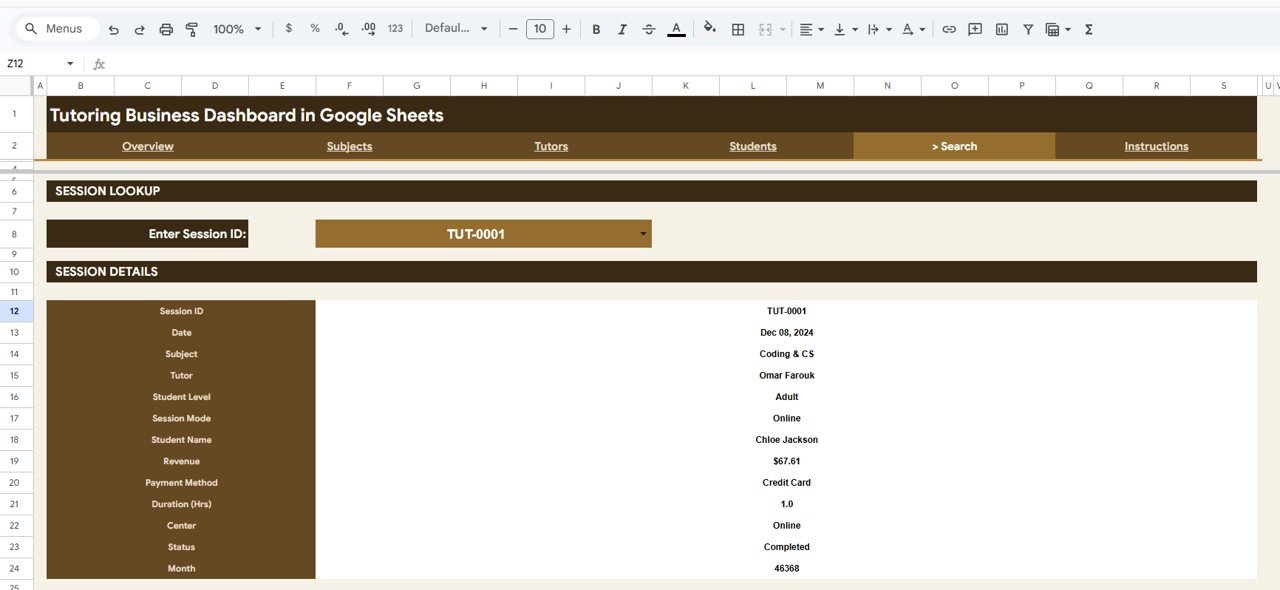
🔍 Session lookup tool – type any Session ID on the Search tab and instantly see its 12 details, from date and tutor to revenue, payment method, and status.
🗂️ One clean Data tab – keep the column order, add a row per session, and the KPIs, charts, slicers, and search all stay in sync.
☁️ 100% browser-based – runs in Google Sheets on desktop or mobile and shares with your team through a normal Google Drive link.
📦 What’s Inside the Tutoring Business Dashboard in Google Sheets
The template ships with six ready-to-use tabs – four analysis pages plus a Search tool and a Data entry sheet:
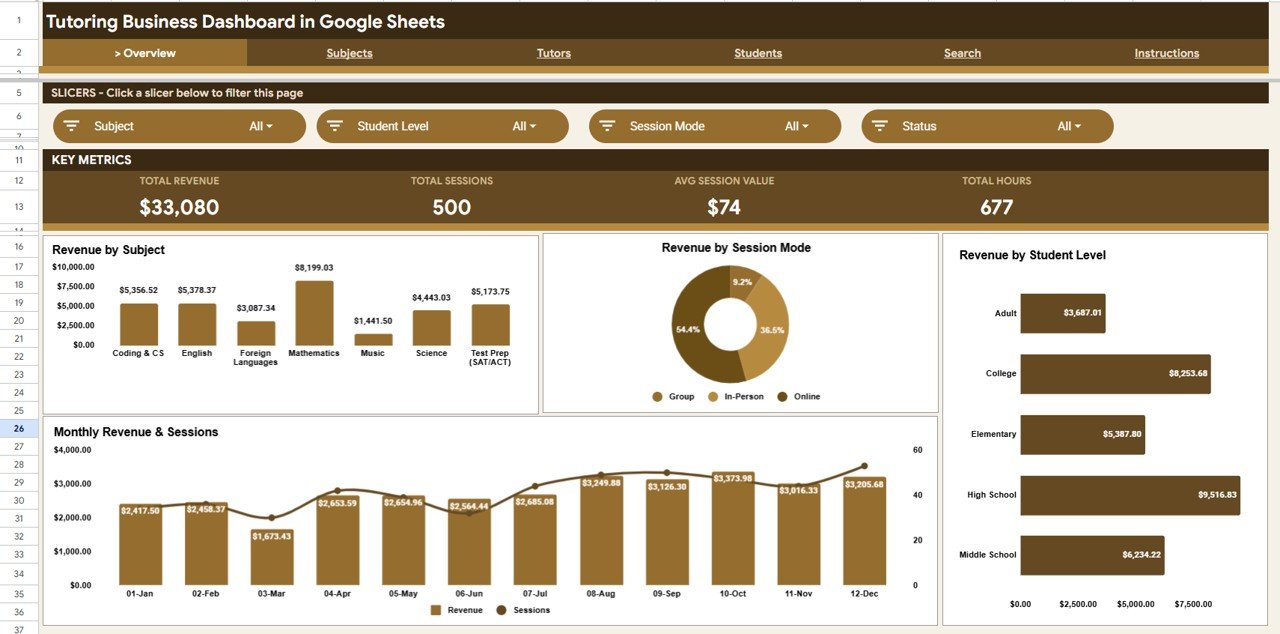
1. Overview Page
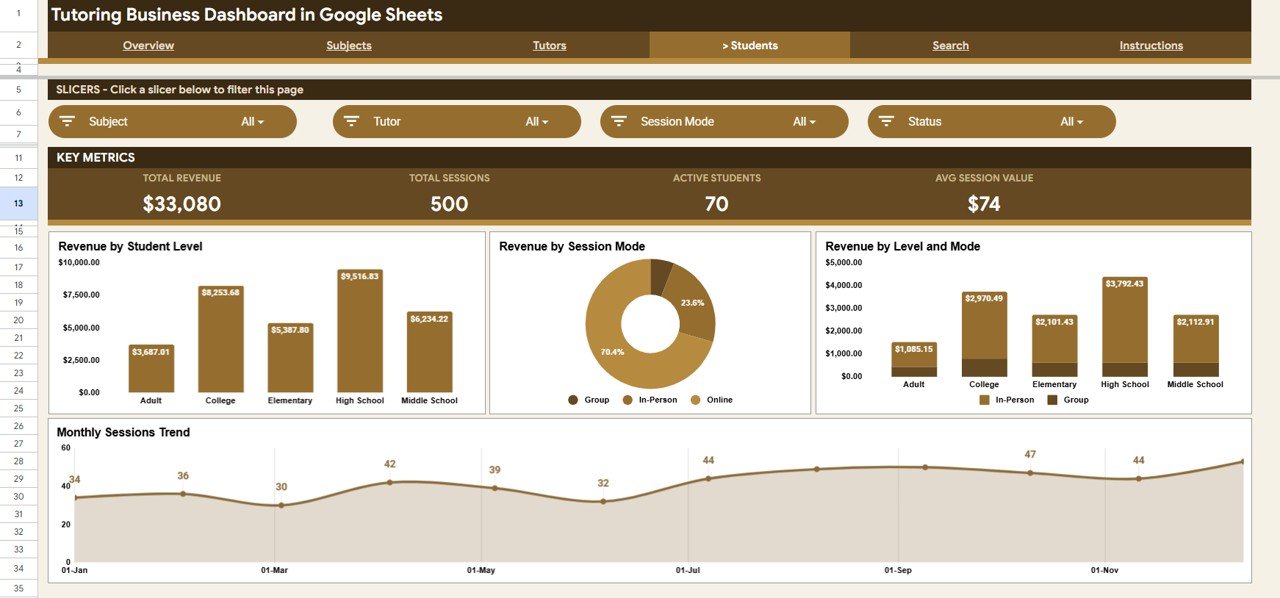
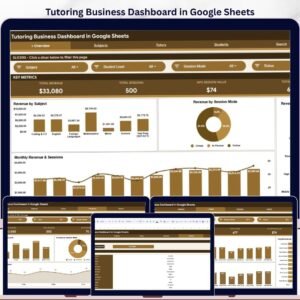
The Overview tab opens with four KPI cards – Total Revenue, Total Sessions, Average Session Value, and Total Hours – followed by slicers that filter the whole page in one click. Here is what each Overview chart shows:
🔹 Revenue by Subject – compares total earnings across your subjects so you can see which ones bring in the most income.
🔹 Revenue by Session Mode – splits revenue between online and in-person sessions to guide how you schedule delivery.
🔹 Revenue by Student Level – shows how much income each level contributes, from beginner to exam prep.
🔹 Monthly Revenue and Sessions – tracks money earned and sessions delivered each month so busy and quiet periods stand out.
Tutoring Business Dashboard in Google Sheets
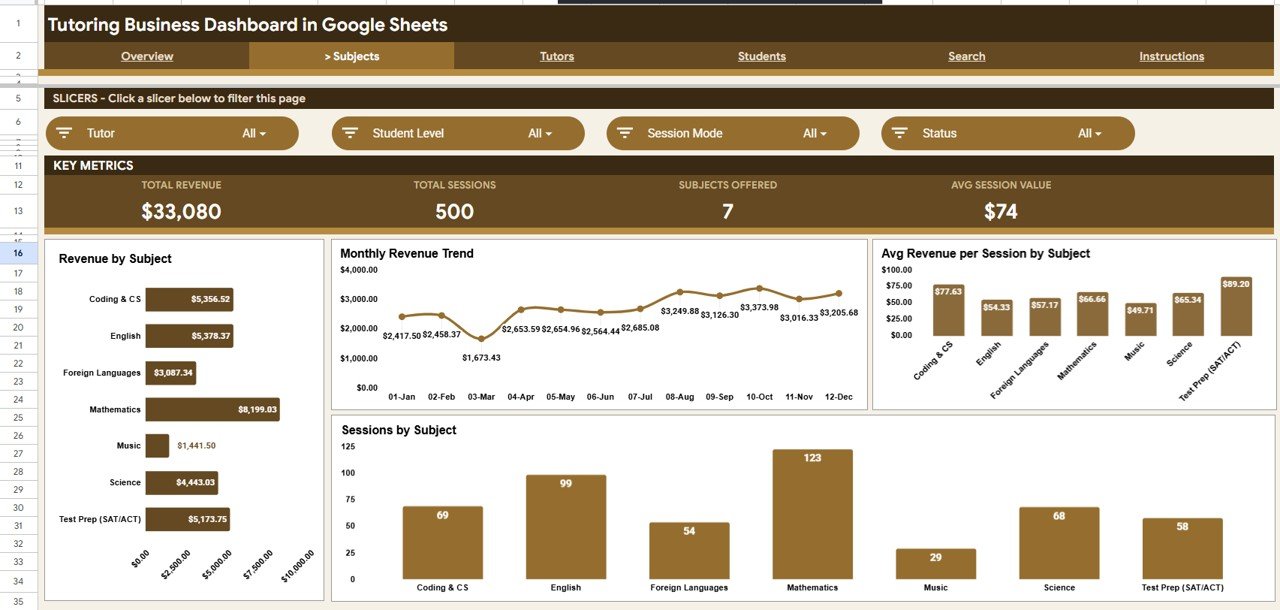
2. Subjects
This tab breaks performance down by subject with Revenue by Subject, a Monthly Revenue Trend, Average Revenue per Session by Subject, and Sessions by Subject – useful for deciding which subjects to promote or hire tutors for.
Subjects
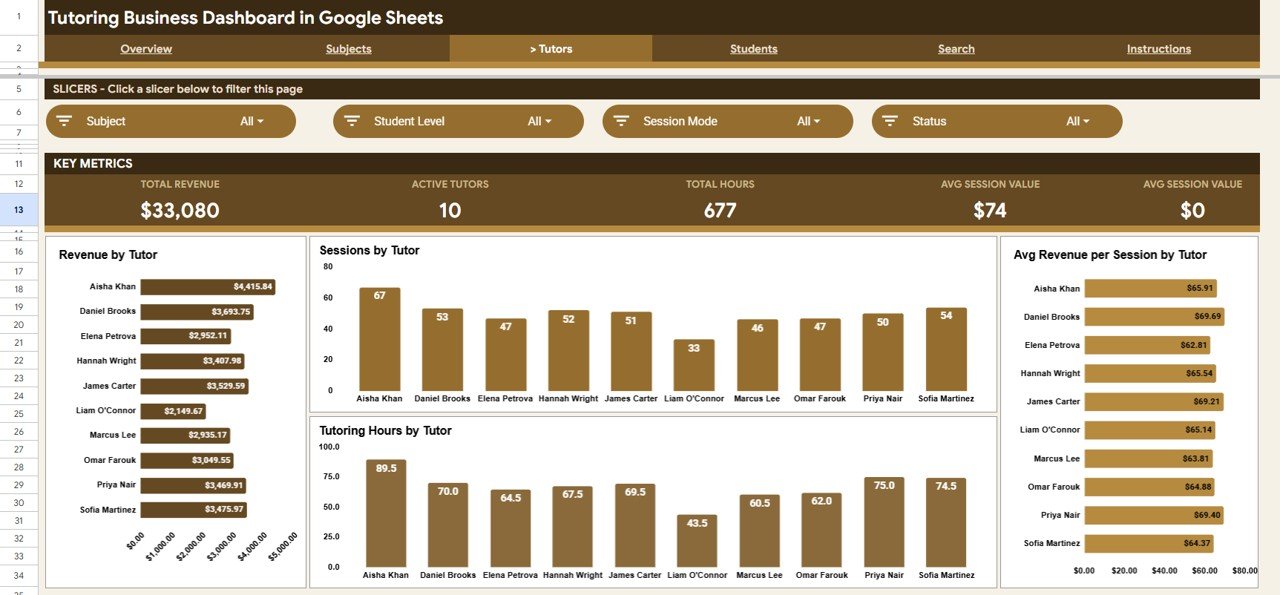
3. Tutors
The Tutors tab measures each tutor’s contribution with Revenue by Tutor, Sessions by Tutor, Average Revenue per Session by Tutor, and Tutoring Hours by Tutor – handy for payouts, capacity planning, and recognising top performers.
Tutors
4. Students
The Students tab focuses on who you teach and how, with Revenue by Student Level, Revenue by Session Mode, Revenue by Level and Mode, and a Monthly Sessions Trend.
Students
5. Search Page
Enter a Session ID and the Search tab instantly returns that session’s full record – Date, Subject, Tutor, Student Level, Session Mode, Student Name, Revenue, Payment Method, Duration, Center, Status, and Month – without scrolling through the raw data.
Search Sheet tab
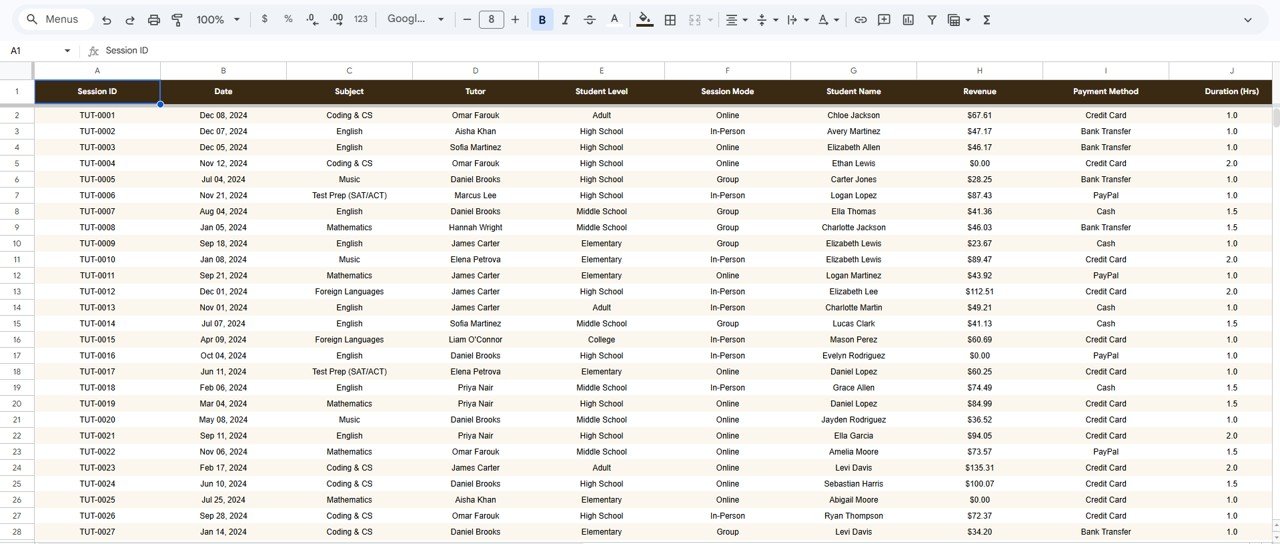
6. Data Sheet
The Data tab is where everything starts. Add each tutoring session as a new row in the same column format and the KPIs, charts, slicers, and Search tab all update automatically.
Data Sheet tab
📊 Tutoring Business Dashboard in Google Sheets vs. Excel vs. Paid Tutoring Software – Where This Fits
Here is how this Google Sheets tutoring tracker compares to a Microsoft Excel dashboard and to subscription tutoring platforms like Teachworks or TutorBird:
| Feature | Tutoring Business Dashboard (Google Sheets) | Microsoft Excel Dashboard | Teachworks / TutorBird |
|---|---|---|---|
| Cost | $9.99 one-time | $12-18 one-time | $15-105 / user / month |
| Platform | Google Sheets (any browser) | Microsoft Excel (desktop) | Vendor web app |
| Setup time | ✅ Under 10 minutes | Under 10 minutes | Hours to days |
| Real-time team collaboration | ✅ Built in via Google Drive | ⚠️ Needs OneDrive / 365 | ✅ Included |
| Mobile access | ✅ Google Sheets app | ⚠️ Excel mobile | ✅ Included |
| Customisable fields | ✅ Fully editable | ✅ Fully editable | ⚠️ Limited to vendor fields |
| Share with a link | ✅ One Google Drive link | ⚠️ File send / OneDrive | ✅ User logins |
| You own your data | ✅ Your Google Drive | ✅ Your file | ❌ Vendor servers |
| Year-1 cost (5 users) | $9.99 total | ~$15 + Office licences | $900-6,300+ |
For tutoring centres and independent tutors who want clear revenue and session analytics without a monthly per-seat bill, the Tutoring Business Dashboard in Google Sheets sits in the sweet spot.
👥 Who This Template Is For – and Who It’s Not For
✅ This template is built for:
- Independent tutors tracking sessions, hours, and income across multiple subjects
- Tutoring centres with several tutors and locations who need per-tutor and per-center reporting
- Test-prep and academic coaching businesses that want online vs in-person revenue splits
❌ This template is NOT for:
- Large institutions needing a full student information system with attendance, LMS, and parent portals
- Teams that require built-in payment processing or automated invoicing
- Anyone wanting a fully coded web app with secure logins – see our Web Apps instead
⚙️ How to Use the Tutoring Business Dashboard in Google Sheets
- Open the PDF in your download and click the Google Sheets copy link to save your own editable copy to Google Drive.
- Go to the Data tab and replace the sample sessions with your own, keeping the column order intact.
- Open the Overview tab – the KPI cards and charts refresh automatically from your data.
- Use the slicers to filter the Overview by subject, session mode, or student level.
- Open the Search tab and enter a Session ID to pull any single session’s full details.
💼 Real-World Use Cases
Priya runs a six-tutor maths and science centre. She uses Revenue by Tutor and Tutoring Hours by Tutor to calculate monthly payouts and Revenue by Subject to decide where to add classes – all without paying a per-seat monthly fee for Teachworks.
Daniel is an independent IELTS and spoken-English tutor. He logs each session in the Data tab and checks Revenue by Session Mode to confirm that his online classes now out-earn his in-person ones, helping him plan his weekly timetable.
Aisha manages two test-prep centres. She relies on Revenue by Level and Mode plus the Search tab to answer parent queries about specific sessions in seconds during a busy enrolment week.
❓ Frequently Asked Questions
What KPIs does the Tutoring Business Dashboard in Google Sheets track?
The Tutoring Business Dashboard in Google Sheets tracks 4 headline KPIs – Total Revenue, Total Sessions, Average Session Value, and Total Hours – all of which update automatically the moment you add or edit a session in the Data tab.
How long does setup take?
Setup takes under 10 minutes. Make your own copy from the Google Sheets link in the download, paste your session records into the Data tab in the same column order, and every KPI, chart, and slicer updates on its own.
Do I need Excel or any software to use it?
No. The Tutoring Business Dashboard in Google Sheets runs entirely in Google Sheets, so all you need is a free Google account and a browser on desktop or mobile – there is nothing to install.
Can multiple tutors use it at the same time?
Yes. Because it lives in Google Sheets, you can share one Google Drive link and have several tutors or admins view or edit the dashboard together, with no per-user fees.
How does this compare to Teachworks or TutorBird?
Teachworks and TutorBird charge a recurring monthly fee per user, while the Tutoring Business Dashboard in Google Sheets is a one-time $9.99 purchase you own forever. It focuses on revenue and session analytics rather than scheduling or billing automation.
Can I add my own subjects, tutors, and centers?
Yes. Every subject, tutor, student level, session mode, and center is read from your Data tab, so the dashboard adapts to your own list of values with no formula editing required.
Will the charts update when I add new sessions?
Yes. The chart and pivot ranges are set to expand as you add rows, so new sessions flow straight into the KPI cards, charts, slicers, and Search tab automatically.
👤 About the Author
Built by PK – Microsoft Certified Professional with 15+ years of Excel, Google Sheets, and Power BI experience. Founder of NextGenTemplates, reaching 300K+ subscribers across YouTube channels (@PK-AnExcelExpert, @NextGenTemplates, @NeoTechNavigators). Every template is hand-built and tested before release.
🔗 Explore Related Templates
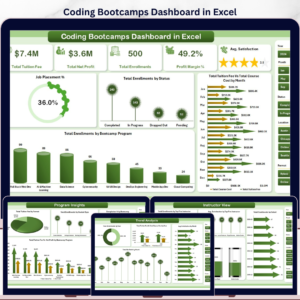
Also available as: the same dashboard in other tools – Tutoring Business Dashboard in Excel and Tutoring Business Dashboard in Power BI.
More education templates you may like:
- 🚗 Driving School Dashboard in Google Sheets – a similar small-business analytics dashboard in the same format.
- 🎓 Coaching and Tutoring Dashboard in Excel – for tutors who prefer working in Excel.
- 🏫 Student Enrollment KPI Scorecard in Excel – track enrolment targets and conversions.
Browse more in Google Sheets Dashboards and Education Templates.
📖 Click here to read the Detailed Blog Post
Watch the step-by-step video tutorial:
🎥 Visit our YouTube channel for step-by-step video tutorials
👉 YouTube.com/@NextGenTemplates
📅 Last updated: June 2026


Reviews
There are no reviews yet.