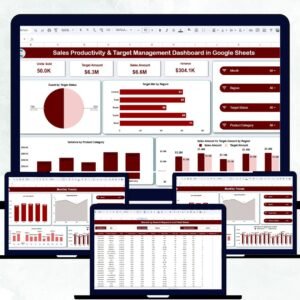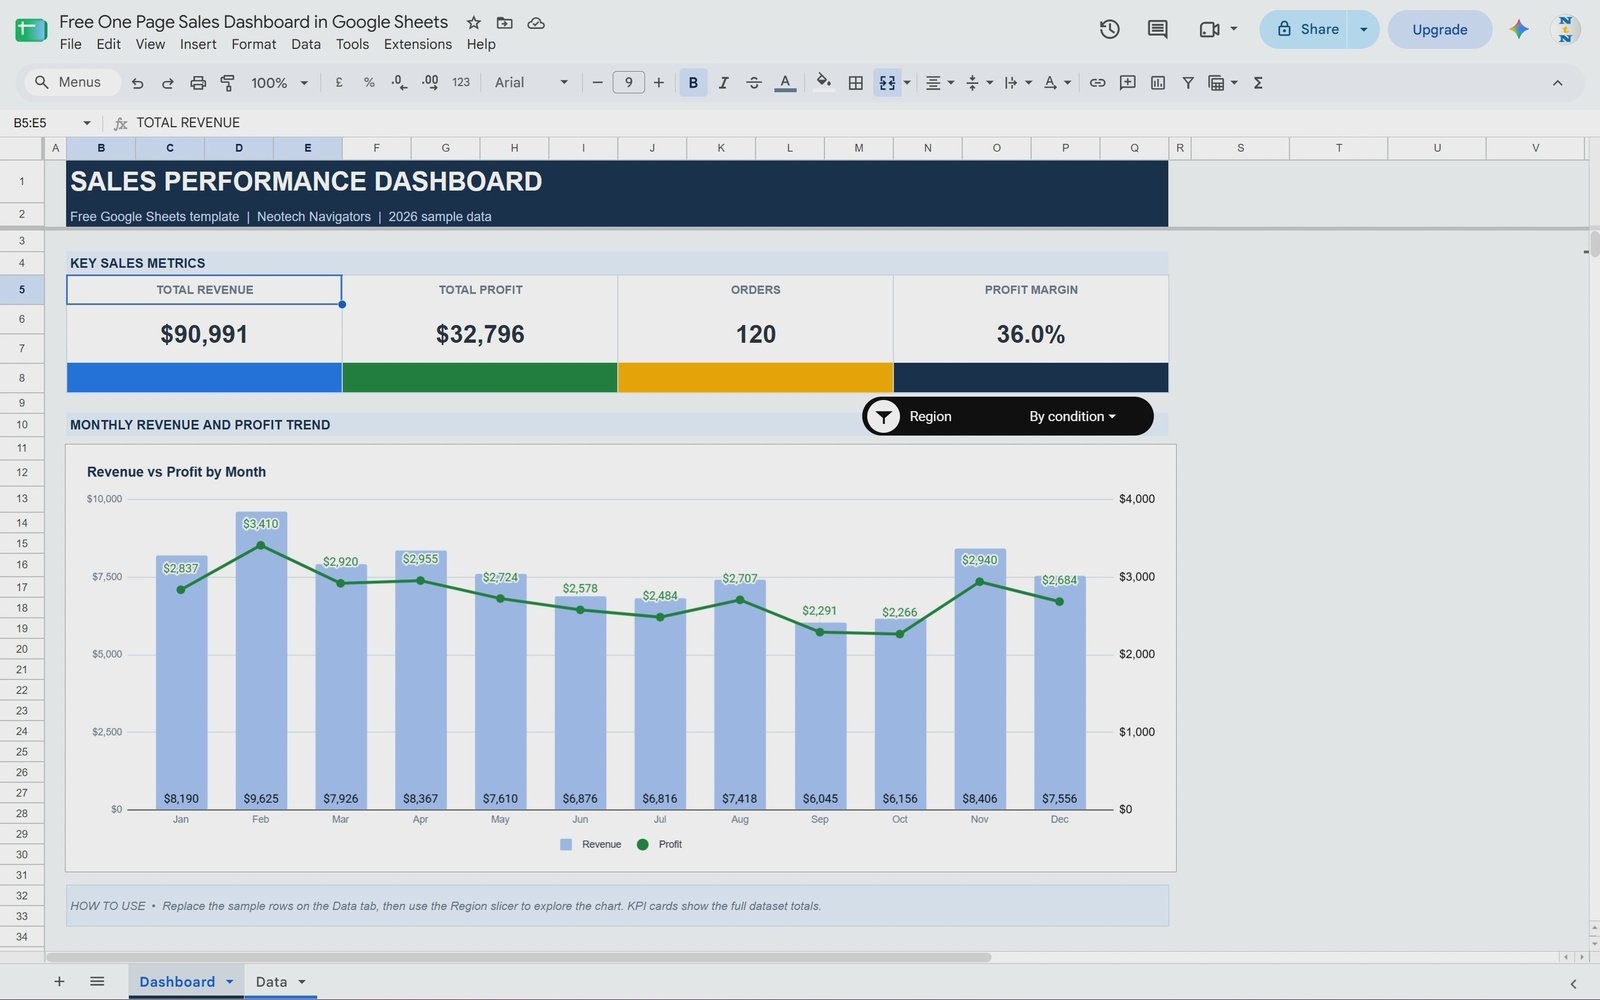
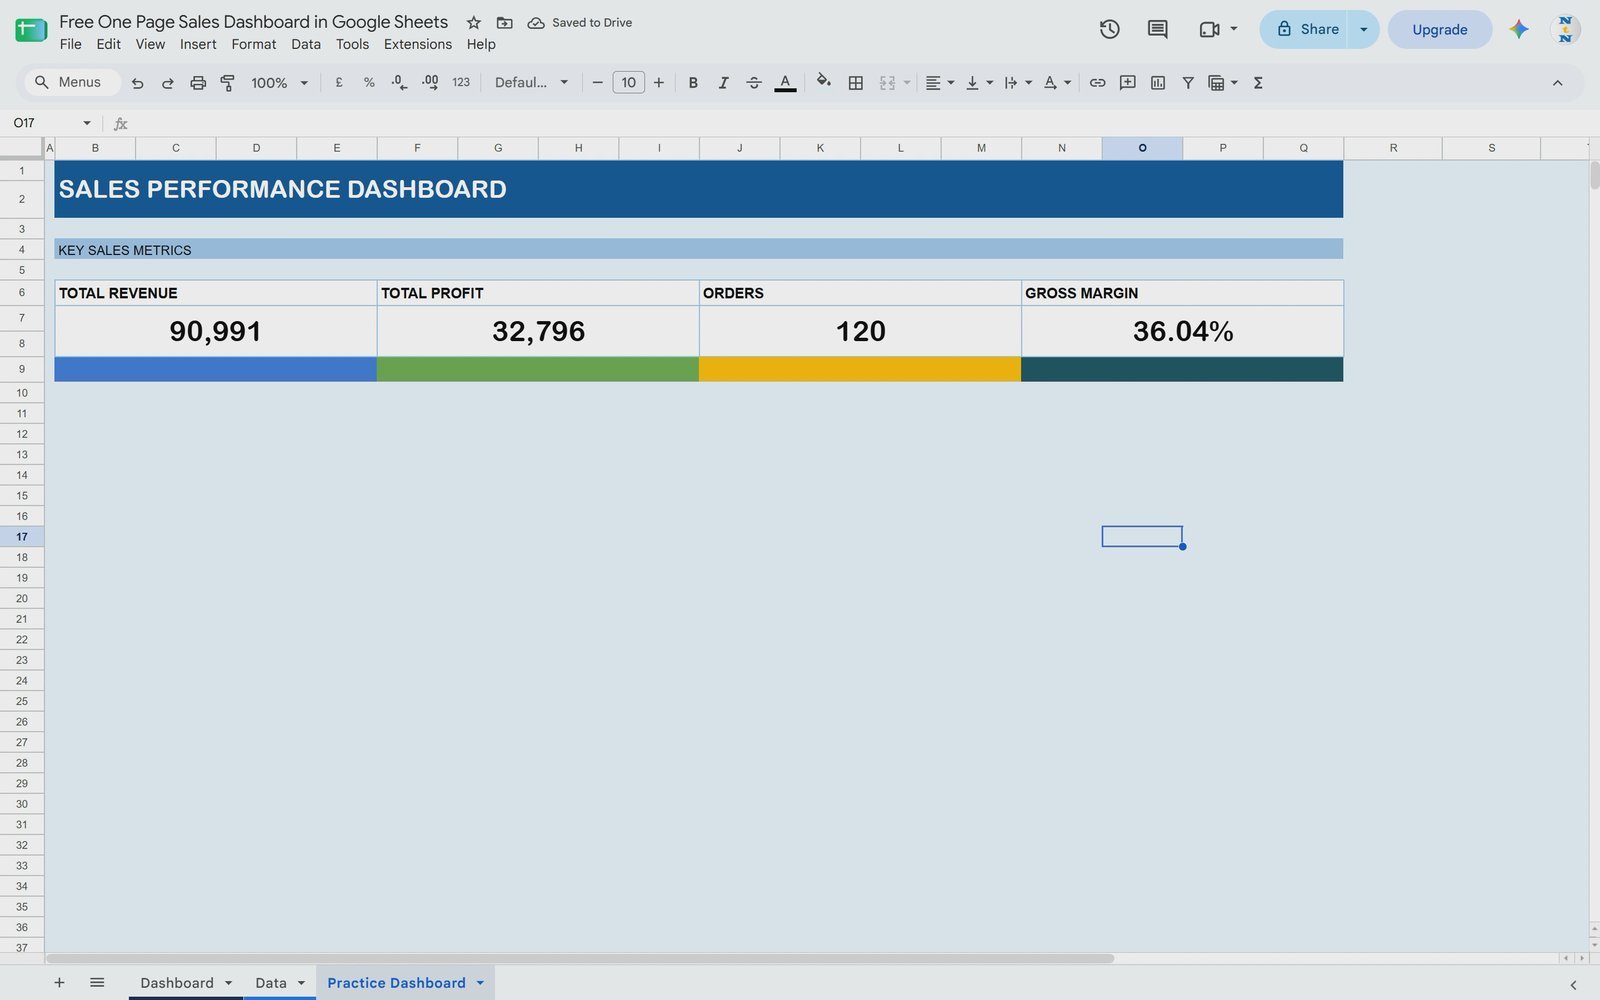
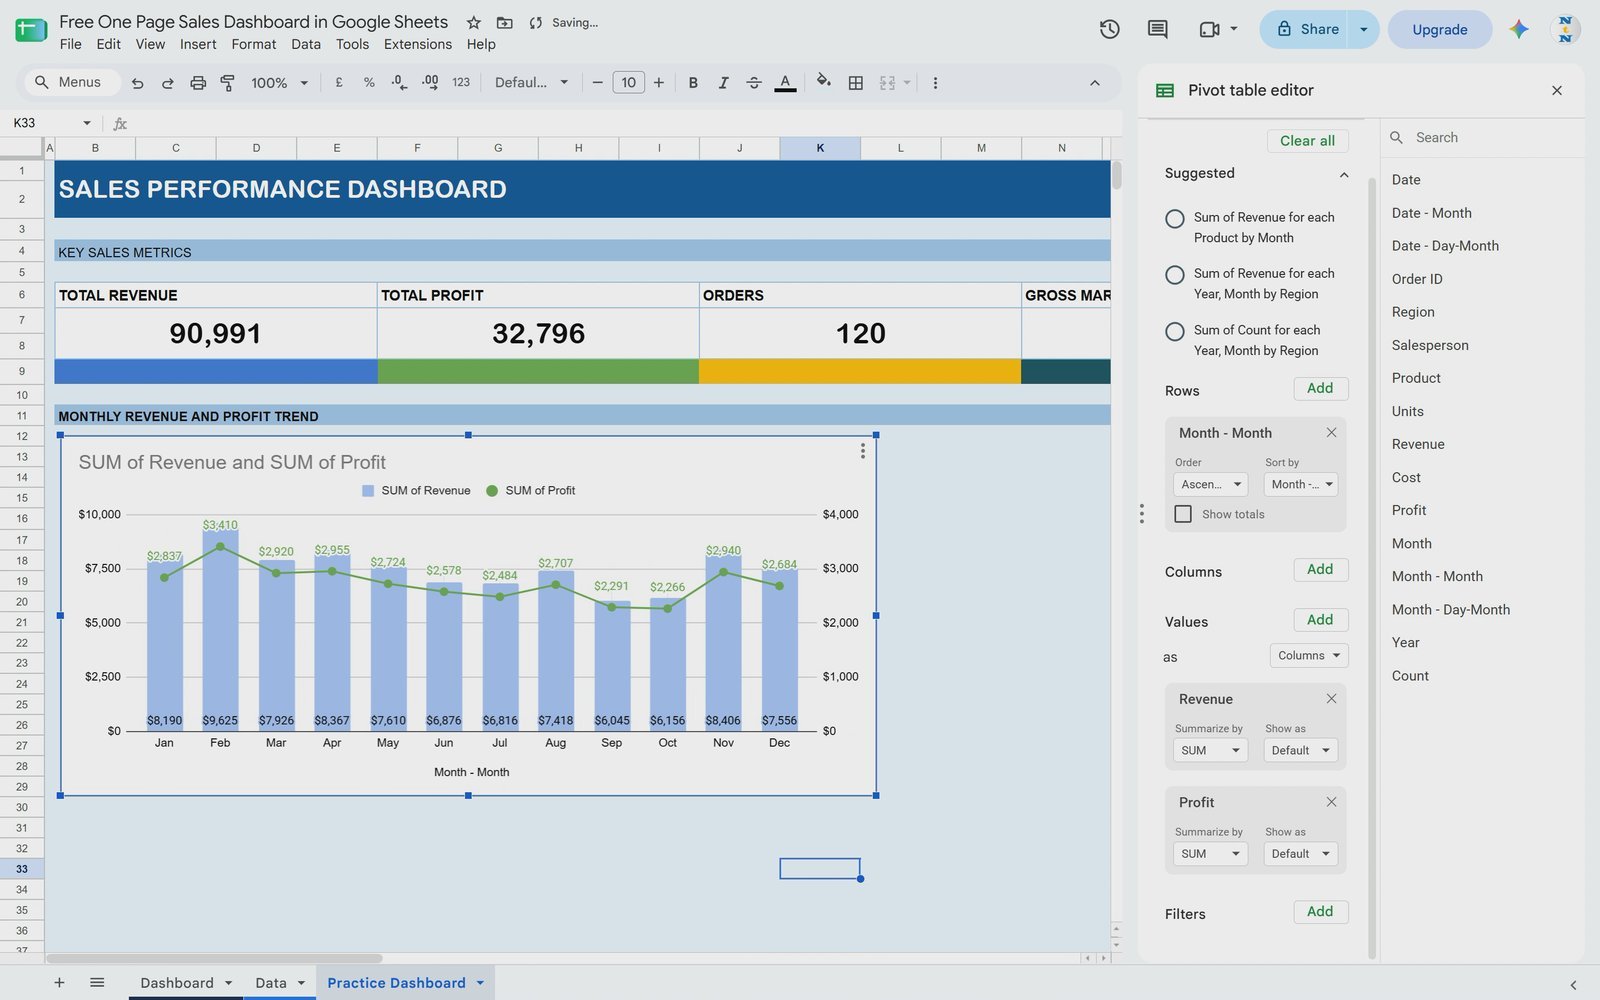
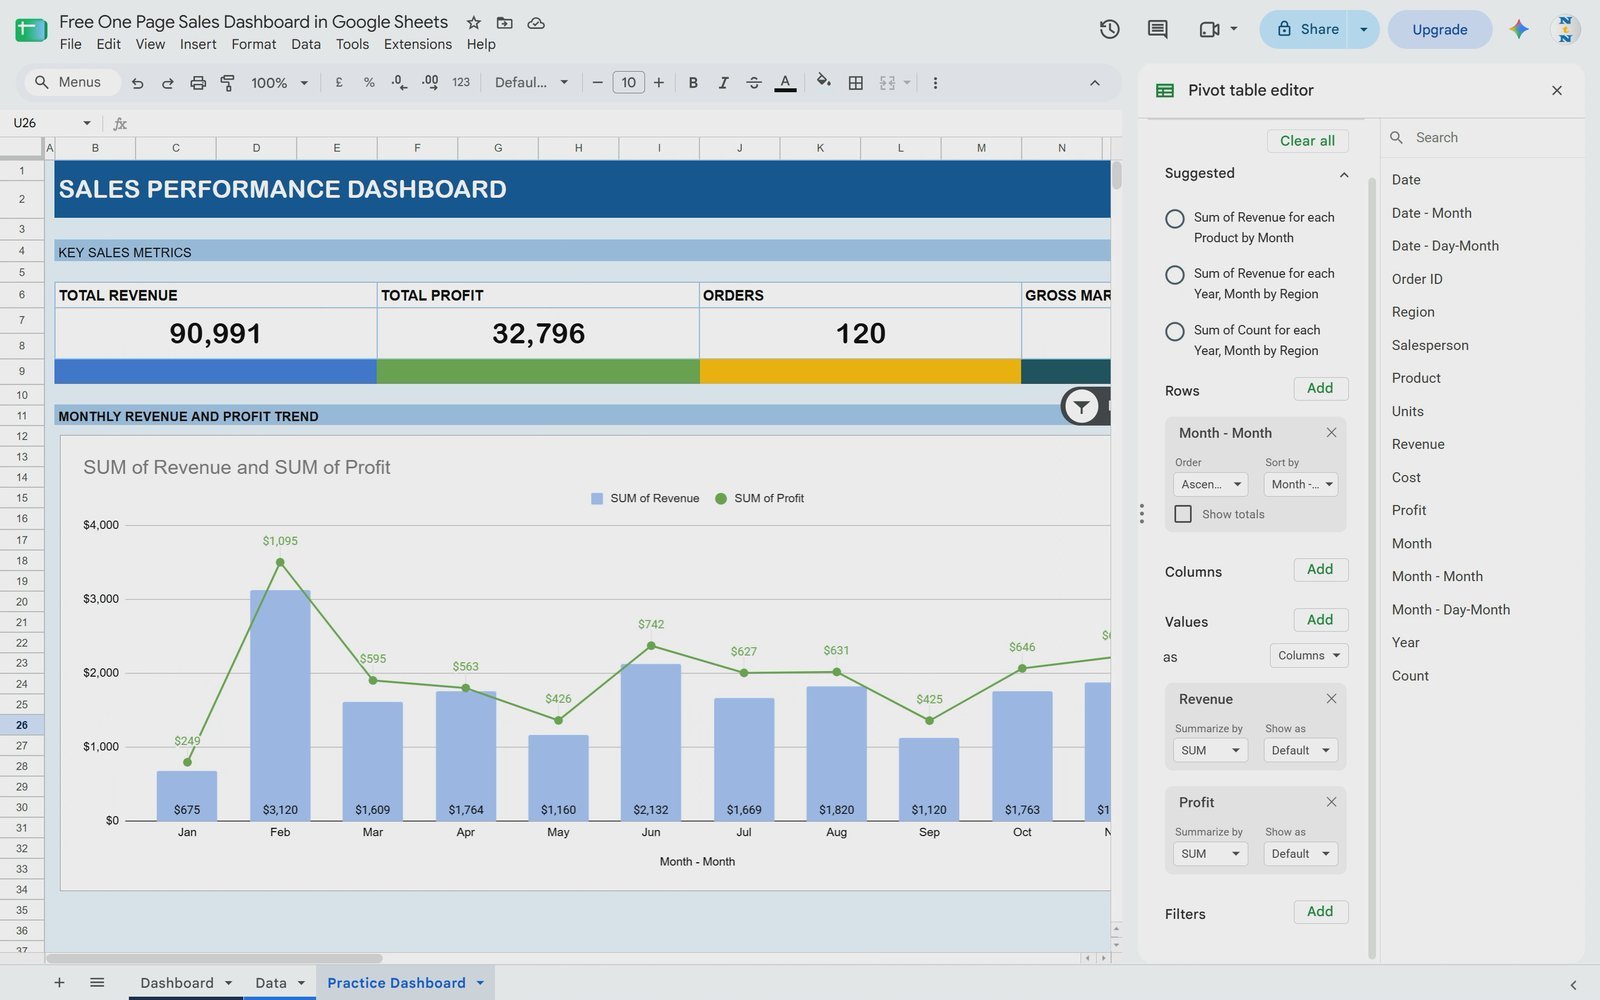
The One Page Sales Dashboard in Google Sheets is a free, ready-to-use template that shows your sales performance on a single screen: four KPI cards, a monthly Revenue vs Profit combo chart and a Region slicer. It comes with 120 sample orders so you can see it working immediately, plus a Practice Dashboard tab to learn how it is built.
🎥 Watch the Video Tutorial
https://www.youtube.com/watch?v=4HUYqv698Xc
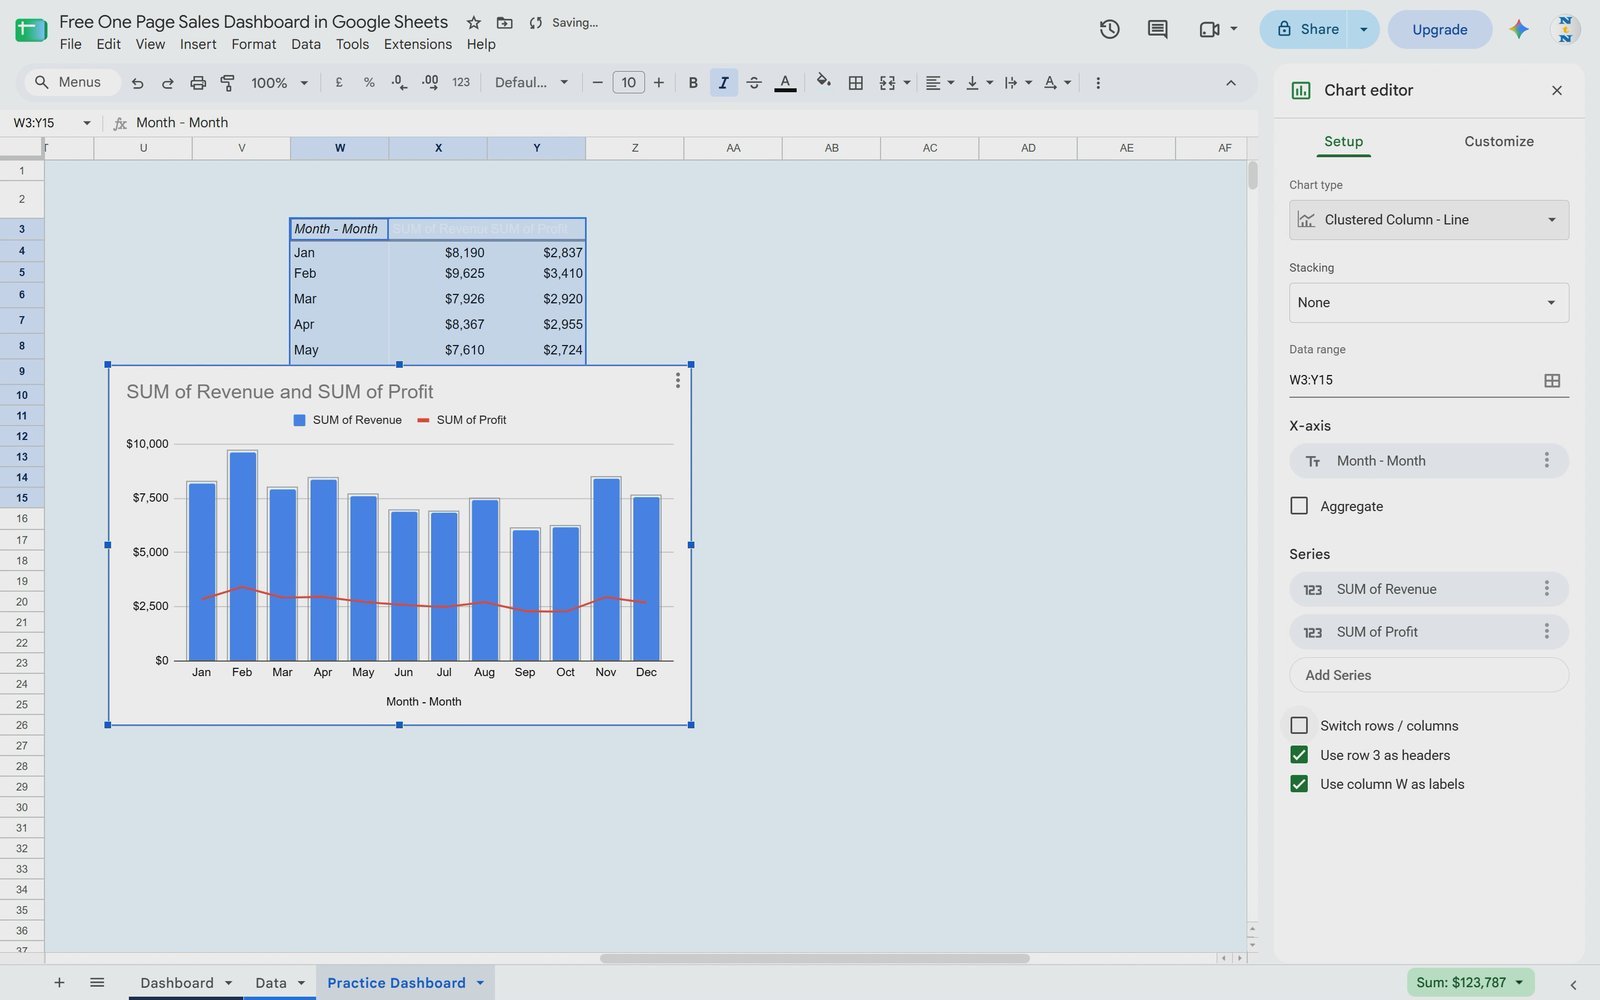
Video Overview: In this step-by-step NeoTech Navigators tutorial, PK shows the finished dashboard and filters it by region with the slicer, then rebuilds it on a blank tab: removing gridlines, adding a merged header and KPI cards, calculating Total Revenue, Total Profit, Orders and Profit Margin with SUM formulas, creating a pivot table by month, converting it into a Revenue vs Profit combo chart with Profit on the right axis, and adding a styled Region slicer.
📖 Read the full step-by-step guide with 28 screenshots: Free One Page Sales Dashboard in Google Sheets – Step by Step
📊 What’s Inside
| Tab | What you get |
|---|---|
| Dashboard | Header, 4 KPI cards (Total Revenue, Total Profit, Orders, Profit Margin), Revenue vs Profit by Month combo chart, Region slicer |
| Data | 120 orders: Date, Order ID, Region, Salesperson, Product, Units, Revenue, Cost, Profit, Month, Year, Count |
| Practice Dashboard | The version built in the video, to follow along and compare |
✅ Key Features
- KPI cards with simple formulas –
=SUM(Data!G:G),=SUM(Data!I:I),=COUNTA(Data!B2:B501)and=IFERROR(SUM(Data!I2:I501)/SUM(Data!G2:G501),0). - Monthly trend – a pivot table by month feeds a combo chart with data labels.
- Interactive – the Region slicer filters the chart for one or several regions.
- Clean one page layout – no gridlines, light background, colour-coded cards.
- Easy to reuse – replace the sample rows with your own orders under the same headers.
⚖️ Free One Page Dashboard vs. Full Sales Dashboards
| Feature | This free template | Premium sales dashboards |
|---|---|---|
| Price | Free | Paid |
| Pages | 1 dashboard page | Multiple analysis pages |
| KPIs and charts | 4 KPIs, 1 combo chart | More KPIs and charts |
| Filters | Region slicer | Several slicers |
| Best for | Learning and quick monthly reporting | Ongoing team reporting |
👥 Who It’s For
- Small business owners and sales managers who want a quick monthly view of sales
- Students and beginners learning pivot tables, charts and slicers in Google Sheets
- Analysts who need a clean starting layout for a sales report
Not ideal for: multi-currency, multi-year consolidation or very large datasets that need BigQuery or Power BI.
🛠️ How to Use
- Download the PDF after checkout (free) and sign in to your Google account.
- Click the link in the PDF – the master sheet opens in view-only mode.
- Choose File > Make a copy; your copy is fully editable.
- Paste your own orders into the Data tab under the same headers.
- Use the Region slicer to filter the dashboard.
💼 Use Cases
- Monthly sales review meetings
- Regional performance comparison
- Revenue and profit margin tracking for a product line
- Teaching dashboard basics in Google Sheets
❓ Frequently Asked Questions
Is it really free?
Yes, the price is 0 – check out and download the PDF with the link.
Do I need add-ons or Apps Script?
No, only built-in Google Sheets features.
Can I add my own data?
Yes – replace the sample rows on the Data tab with your orders.
Why is the link view-only?
So every user makes a personal copy; use File > Make a copy after signing in.
Can I add more slicers?
Yes – Data > Add a slicer and choose Salesperson or Product.
👤 About the Author
Built by PK, Microsoft Certified Professional and founder of NextGenTemplates.com, PK: An Excel Expert and NeoTech Navigators.
🔗 Related Google Sheets Sales Dashboards
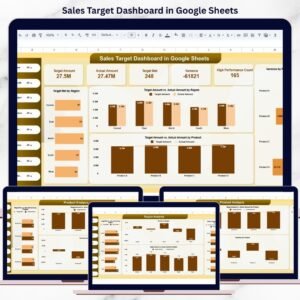
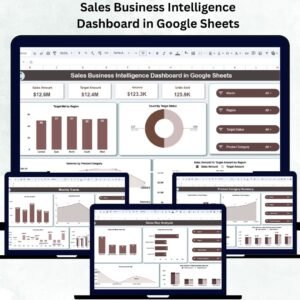
- Sales Business Intelligence Dashboard in Google Sheets
- Sales Target Dashboard in Google Sheets
- Sales KPI Dashboard in Google Sheets
Need a custom dashboard? Email info@NextGenTemplates.com.
Last updated: September 2026