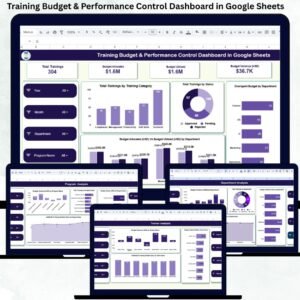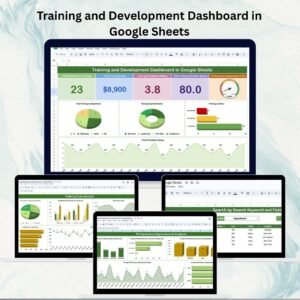
Employee growth and continuous learning are at the heart of organizational success. 🚀 Managing training programs, monitoring outcomes, and ensuring cost efficiency can often feel overwhelming without a structured system in place. To address this, we created the Training and Development Dashboard in Google Sheets — a ready-to-use, interactive solution that centralizes training data, tracks effectiveness, and helps HR teams make informed decisions.
With this dashboard, you can track training costs, evaluate performance improvements, analyze employee feedback, and monitor department-wise participation — all in one place. Its dynamic charts, interactive cards, and powerful search features make it a must-have tool for HR managers, L&D coordinators, and business leaders.
🔑 Key Features of the Training and Development Dashboard
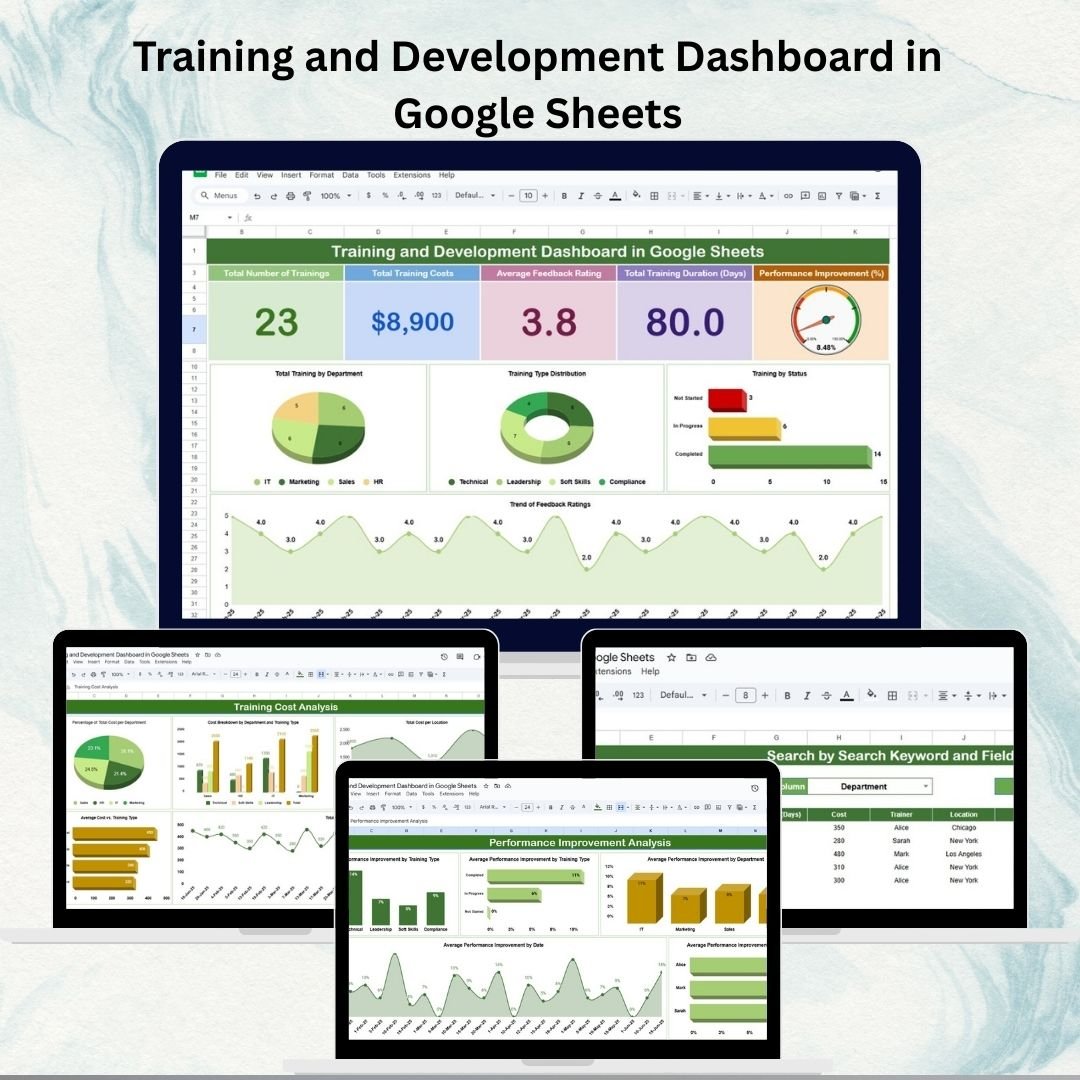
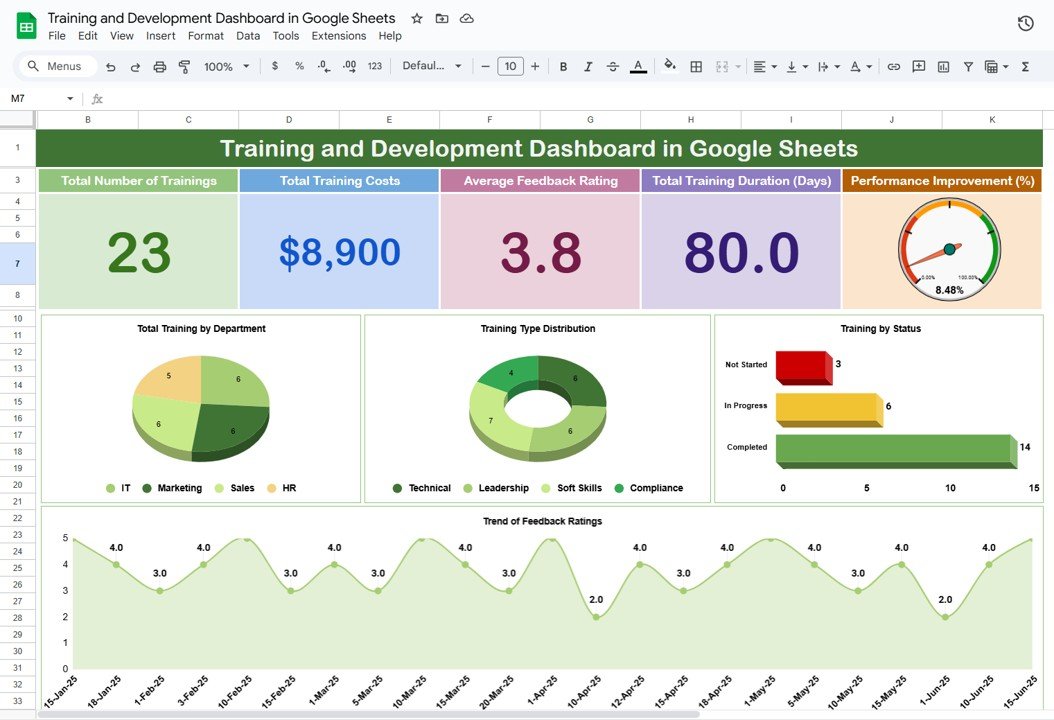
📊 Dashboard Summary Tab – Training Insights at a Glance
Cards include:
Total Number of Trainings
Total Training Costs
Average Feedback Rating
Total Training Duration (Days)
Charts cover:
Performance Improvement %
Trainings by Department
Training Type Distribution
Training by Status
Feedback Rating Trends
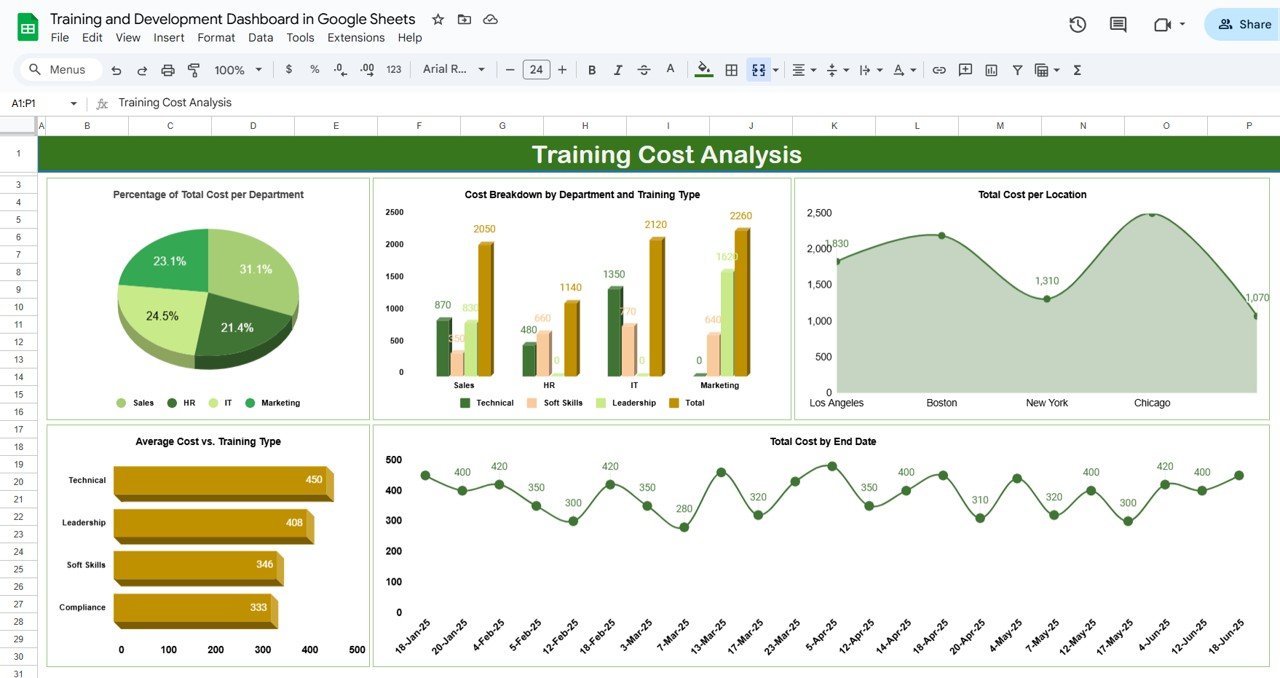
💰 Training Cost Analysis Tab – Financial Transparency
% of Total Costs by Department
Cost breakdown by department and training type
Total cost per location
Cost by end date
Average cost per training type
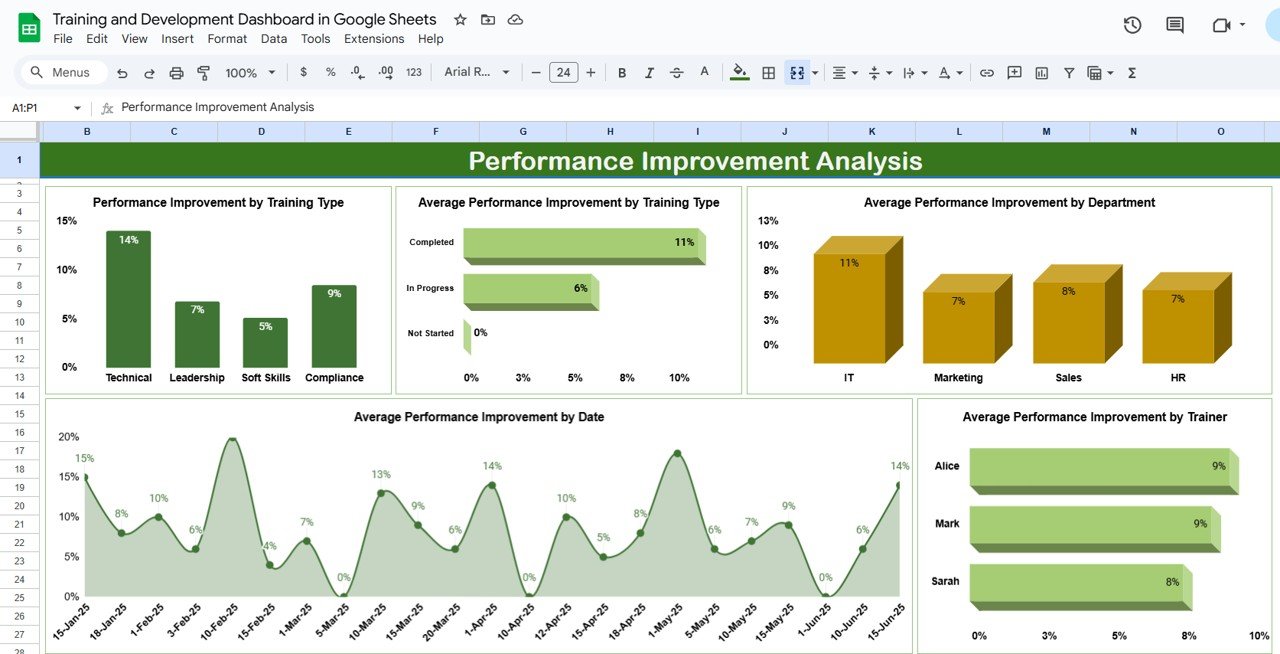
📈 Performance Improvement Analysis Tab – Measuring Impact
Performance improvement by training type
Average improvement by department, trainer, or date
Compare effectiveness of different training methods
Visual trends to identify the most impactful programs
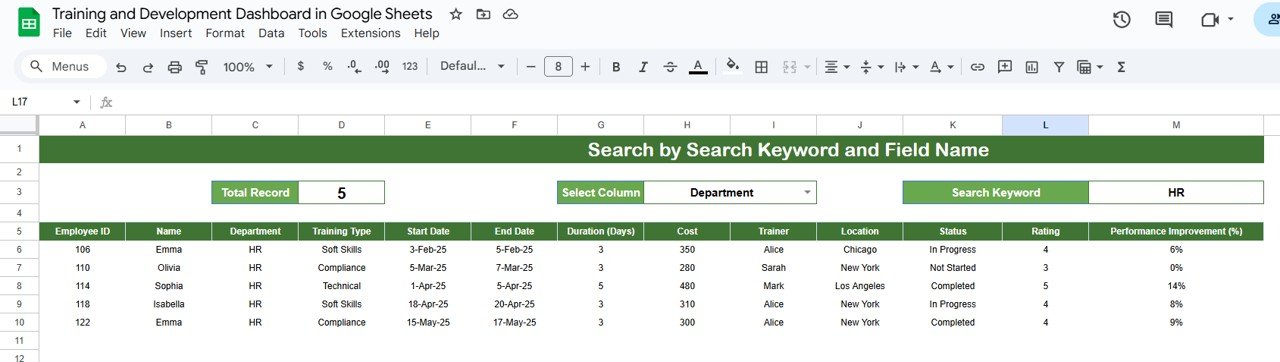
🔍 Search Tab – Quick & Easy Lookup
Search by employee, department, trainer, or training status
Instantly filter data with keywords
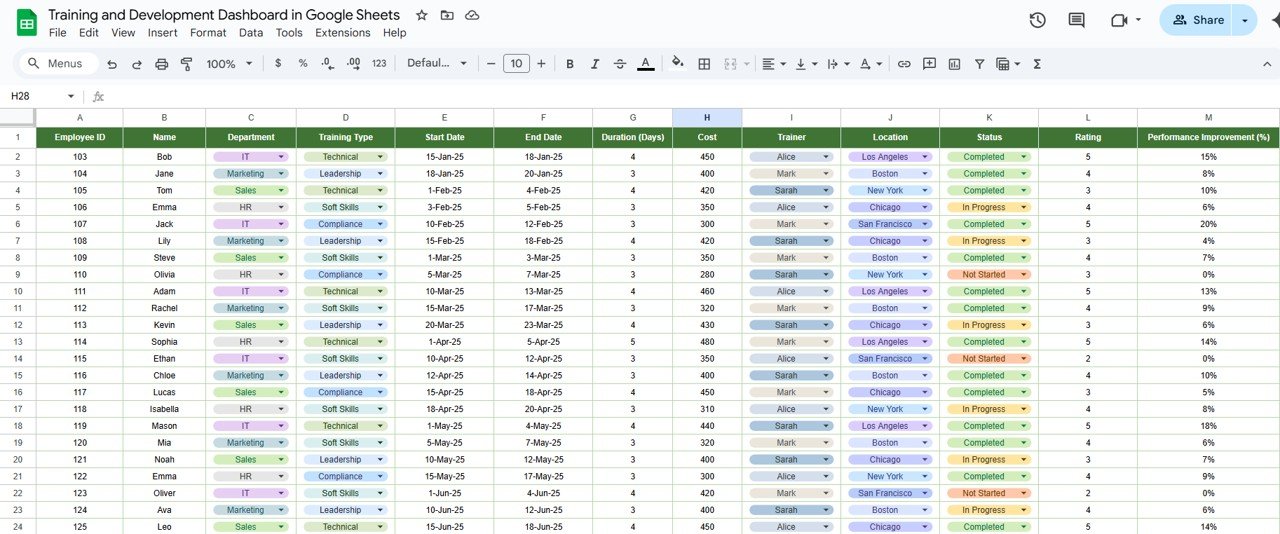
📂 Data Tab – Centralized Training Database
Stores all raw inputs: employee details, training type, duration, costs, status, feedback, and performance improvement
Drives the dashboard and charts automatically
📦 What’s Inside the Template?
✅ Dashboard Summary Tab – Overview of training metrics
✅ Cost Analysis Tab – Detailed financial breakdown
✅ Performance Analysis Tab – Training effectiveness insights
✅ Search Tab – Fast and flexible record filtering
✅ Data Tab – Master data source for the dashboard
✅ Pre-Filled Sample Data – Ready to understand usage instantly
✅ Customizable Structure – Add KPIs or adapt to your HR processes
🧠 How to Use the Training and Development Dashboard
Enter Training Data – Log sessions in the Data tab with details like employee, trainer, cost, and ratings.
Analyze Costs – Review the Training Cost Analysis tab to track budgets.
Measure Impact – Use the Performance Improvement tab to see where training makes the biggest difference.
Search Records – Quickly find employee or training-specific details in the Search tab.
Review Dashboard – Monitor all KPIs and trends in the Dashboard Summary tab.
👥 Who Can Benefit from This Dashboard?
🏢 HR Managers – Track company-wide training outcomes
📈 L&D Coordinators – Measure program effectiveness and ROI
🧑🏫 Trainers – Get feedback and performance insights
💼 Executives – Monitor training costs vs. business outcomes
🎓 Small & Medium Enterprises – Manage training without expensive HR software
⭐ Advantages of Using the Training and Development Dashboard
📑 Centralized Data Management – All training info in one sheet
📊 Actionable Insights – Charts highlight cost, performance, and feedback trends
✅ Customizable – Adapt KPIs to your organization’s goals
⏱ Time-Saving – Prebuilt dashboards update automatically
🤝 Collaboration-Friendly – Multiple HR members can update in real time
🛠 Scalable – Works for single teams or multi-department enterprises