

The Toy & Games Industry Dashboard in Google Sheets reports on 500 sample orders across 10 toy and game categories, 8 brands, 4 sales channels and 10 US states, laid out over six linked pages plus a Data tab. Four KPI cards, fifteen slicers and sixteen charts show revenue, units, gross margin, customer rating and the November-December holiday peak. It works as a ready-made toy store sales dashboard Google Sheets shops can run in any browser: replace the sample rows on the Data tab with your own sales and every KPI, chart, slicer and panel updates on its own.
✅ Instant download · One-time payment · No subscription · No per-user fees · Lifetime access
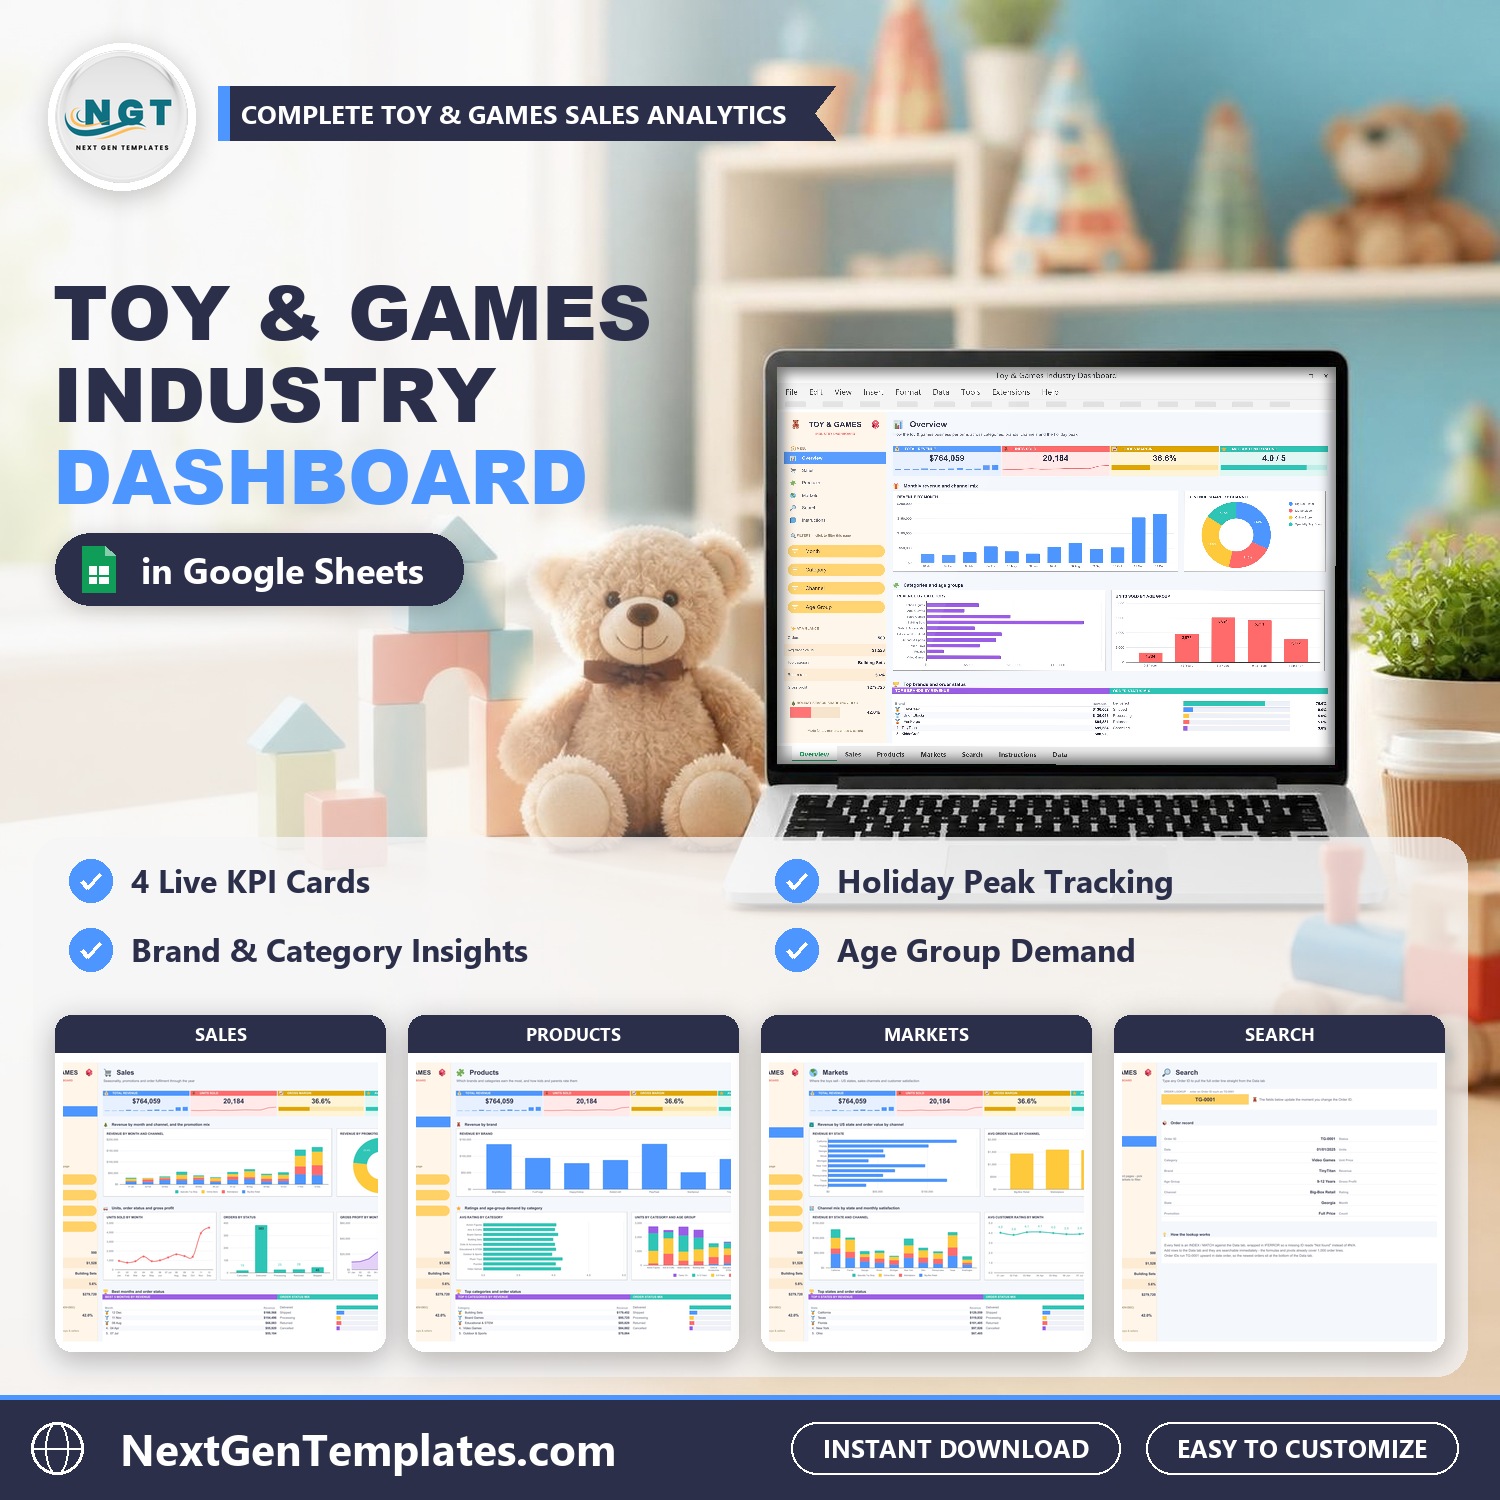
Watch the Toy – Games Industry Dashboard in Google Sheets walkthrough
🔑 Key Features of the Toy & Games Industry Dashboard in Google Sheets
📊 Four KPI cards on every dashboard page. Total Revenue ($764,059), Units Sold (20,184), Gross Margin (36.6%) and Avg Customer Rating (4.0 / 5) stay in view on the Overview, Sales, Products and Markets pages.
🎛️ Fifteen slicers across four pages. Overview filters by Month, Category, Channel and Age Group. Sales filters by Month, Channel, Promotion and State. Products filters by Category, Brand and Age Group. Markets filters by State, Channel, Category and Month. Slicers apply to their own page only, so each page can hold a different view.
🎄 Holiday-peak tracking. A Holiday Season Share bar in the sidebar reads the November-December share of revenue (42.0% on the sample data), and the Sales page charts Revenue by Month and Channel so seasonality is obvious at a glance.
🧸 Brand, category and age-group insight. Compare eight brands and ten categories, see Units by Category and Age Group, and read Avg Rating by Category, so you can see which lines earn the most and which age groups drive demand.
🗺️ US state and channel breakdown. Revenue by State, Revenue by State and Channel and Avg Order Value by Channel show where the toys sell and through which route to market.
🔍 Order lookup on the Search page. Enter an Order ID and the full order line is pulled from the Data tab instantly.
🧩 Room for 1,000 order lines. The pivots read A1:P1001, so you can paste up to 1,000 orders over the sample rows without extending any range. Keep the 16 column headers exactly as they are.
📦 What Is Inside the Toy & Games Industry Dashboard
Page 1: Overview — Revenue, Channels and the Holiday Peak
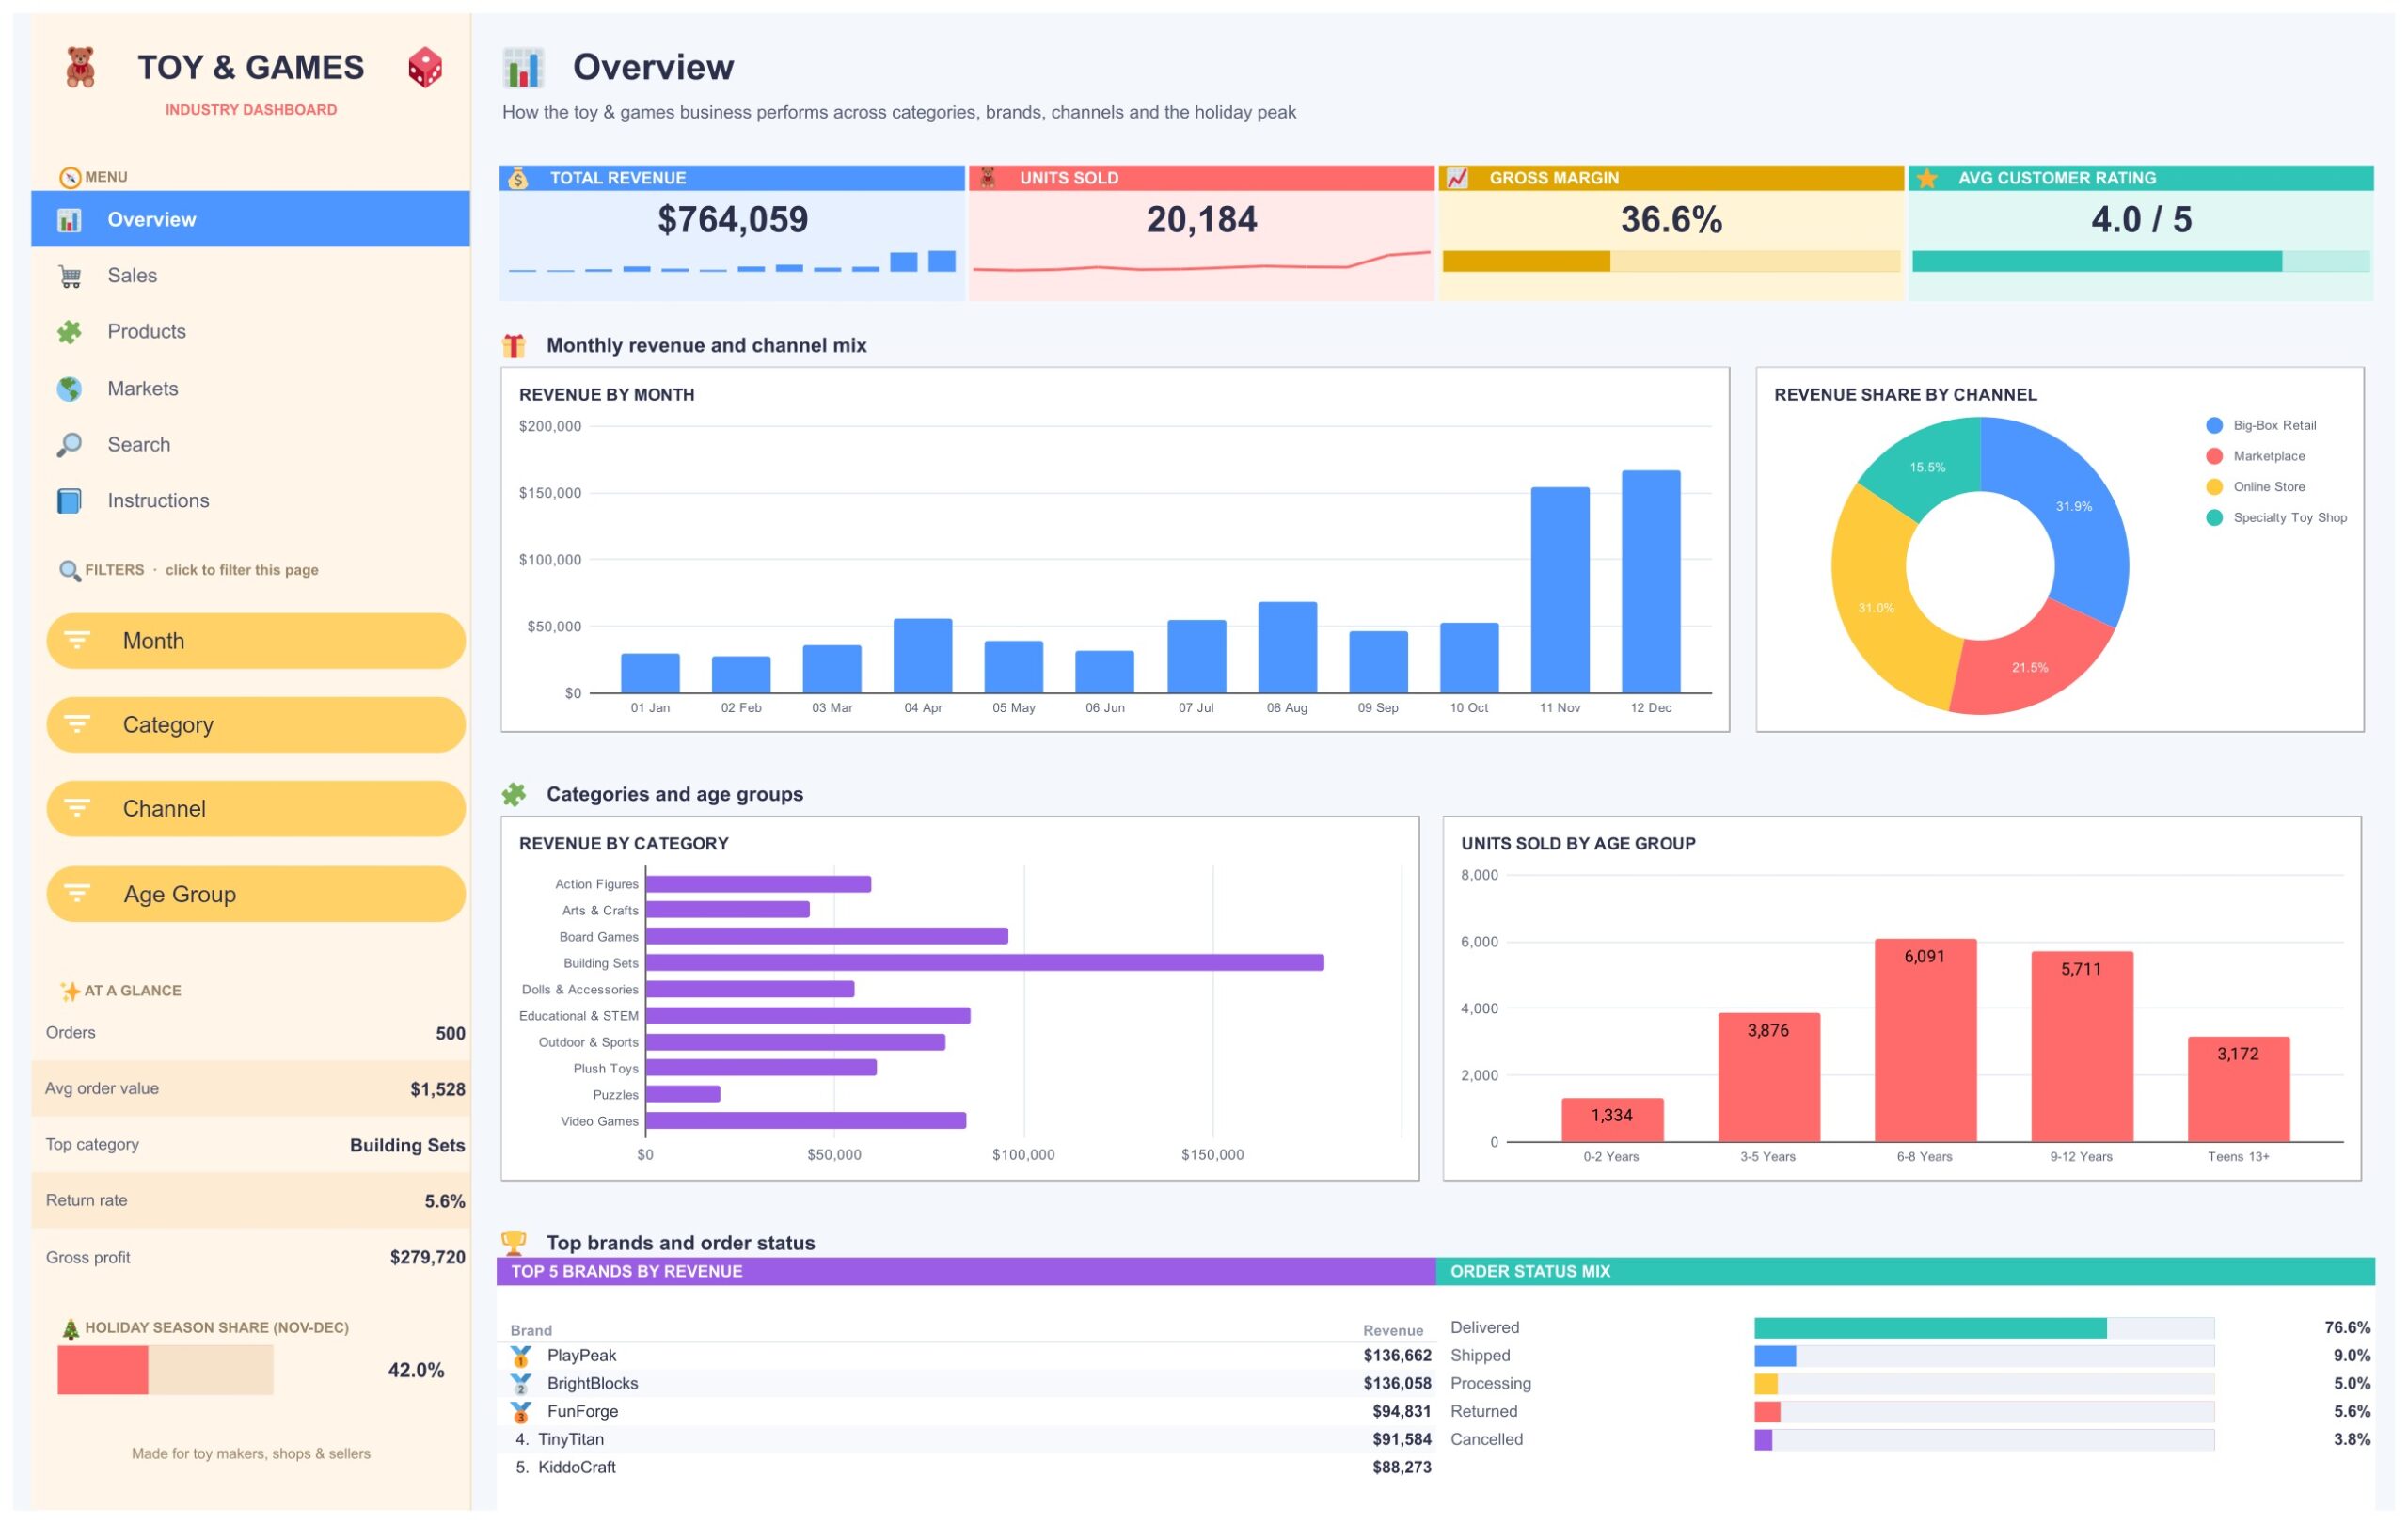
The landing tab reports all categories, brands and channels together. Four KPI cards show Total Revenue ($764,059 on the sample data), Units Sold (20,184), Gross Margin (36.6%) and Avg Customer Rating (4.0 / 5). The charts are Revenue by Month, Revenue Share by Channel, Revenue by Category and Units Sold by Age Group. The sidebar adds an At A Glance block (500 orders, $1,528 average order value, Building Sets as the top category, a 5.6% return rate and $279,720 gross profit), a Holiday Season Share bar for November and December reading 42.0%, a Top 5 Brands by Revenue table and an Order Status Mix.
Page 2: Sales — Seasonality, Promotions and Fulfilment
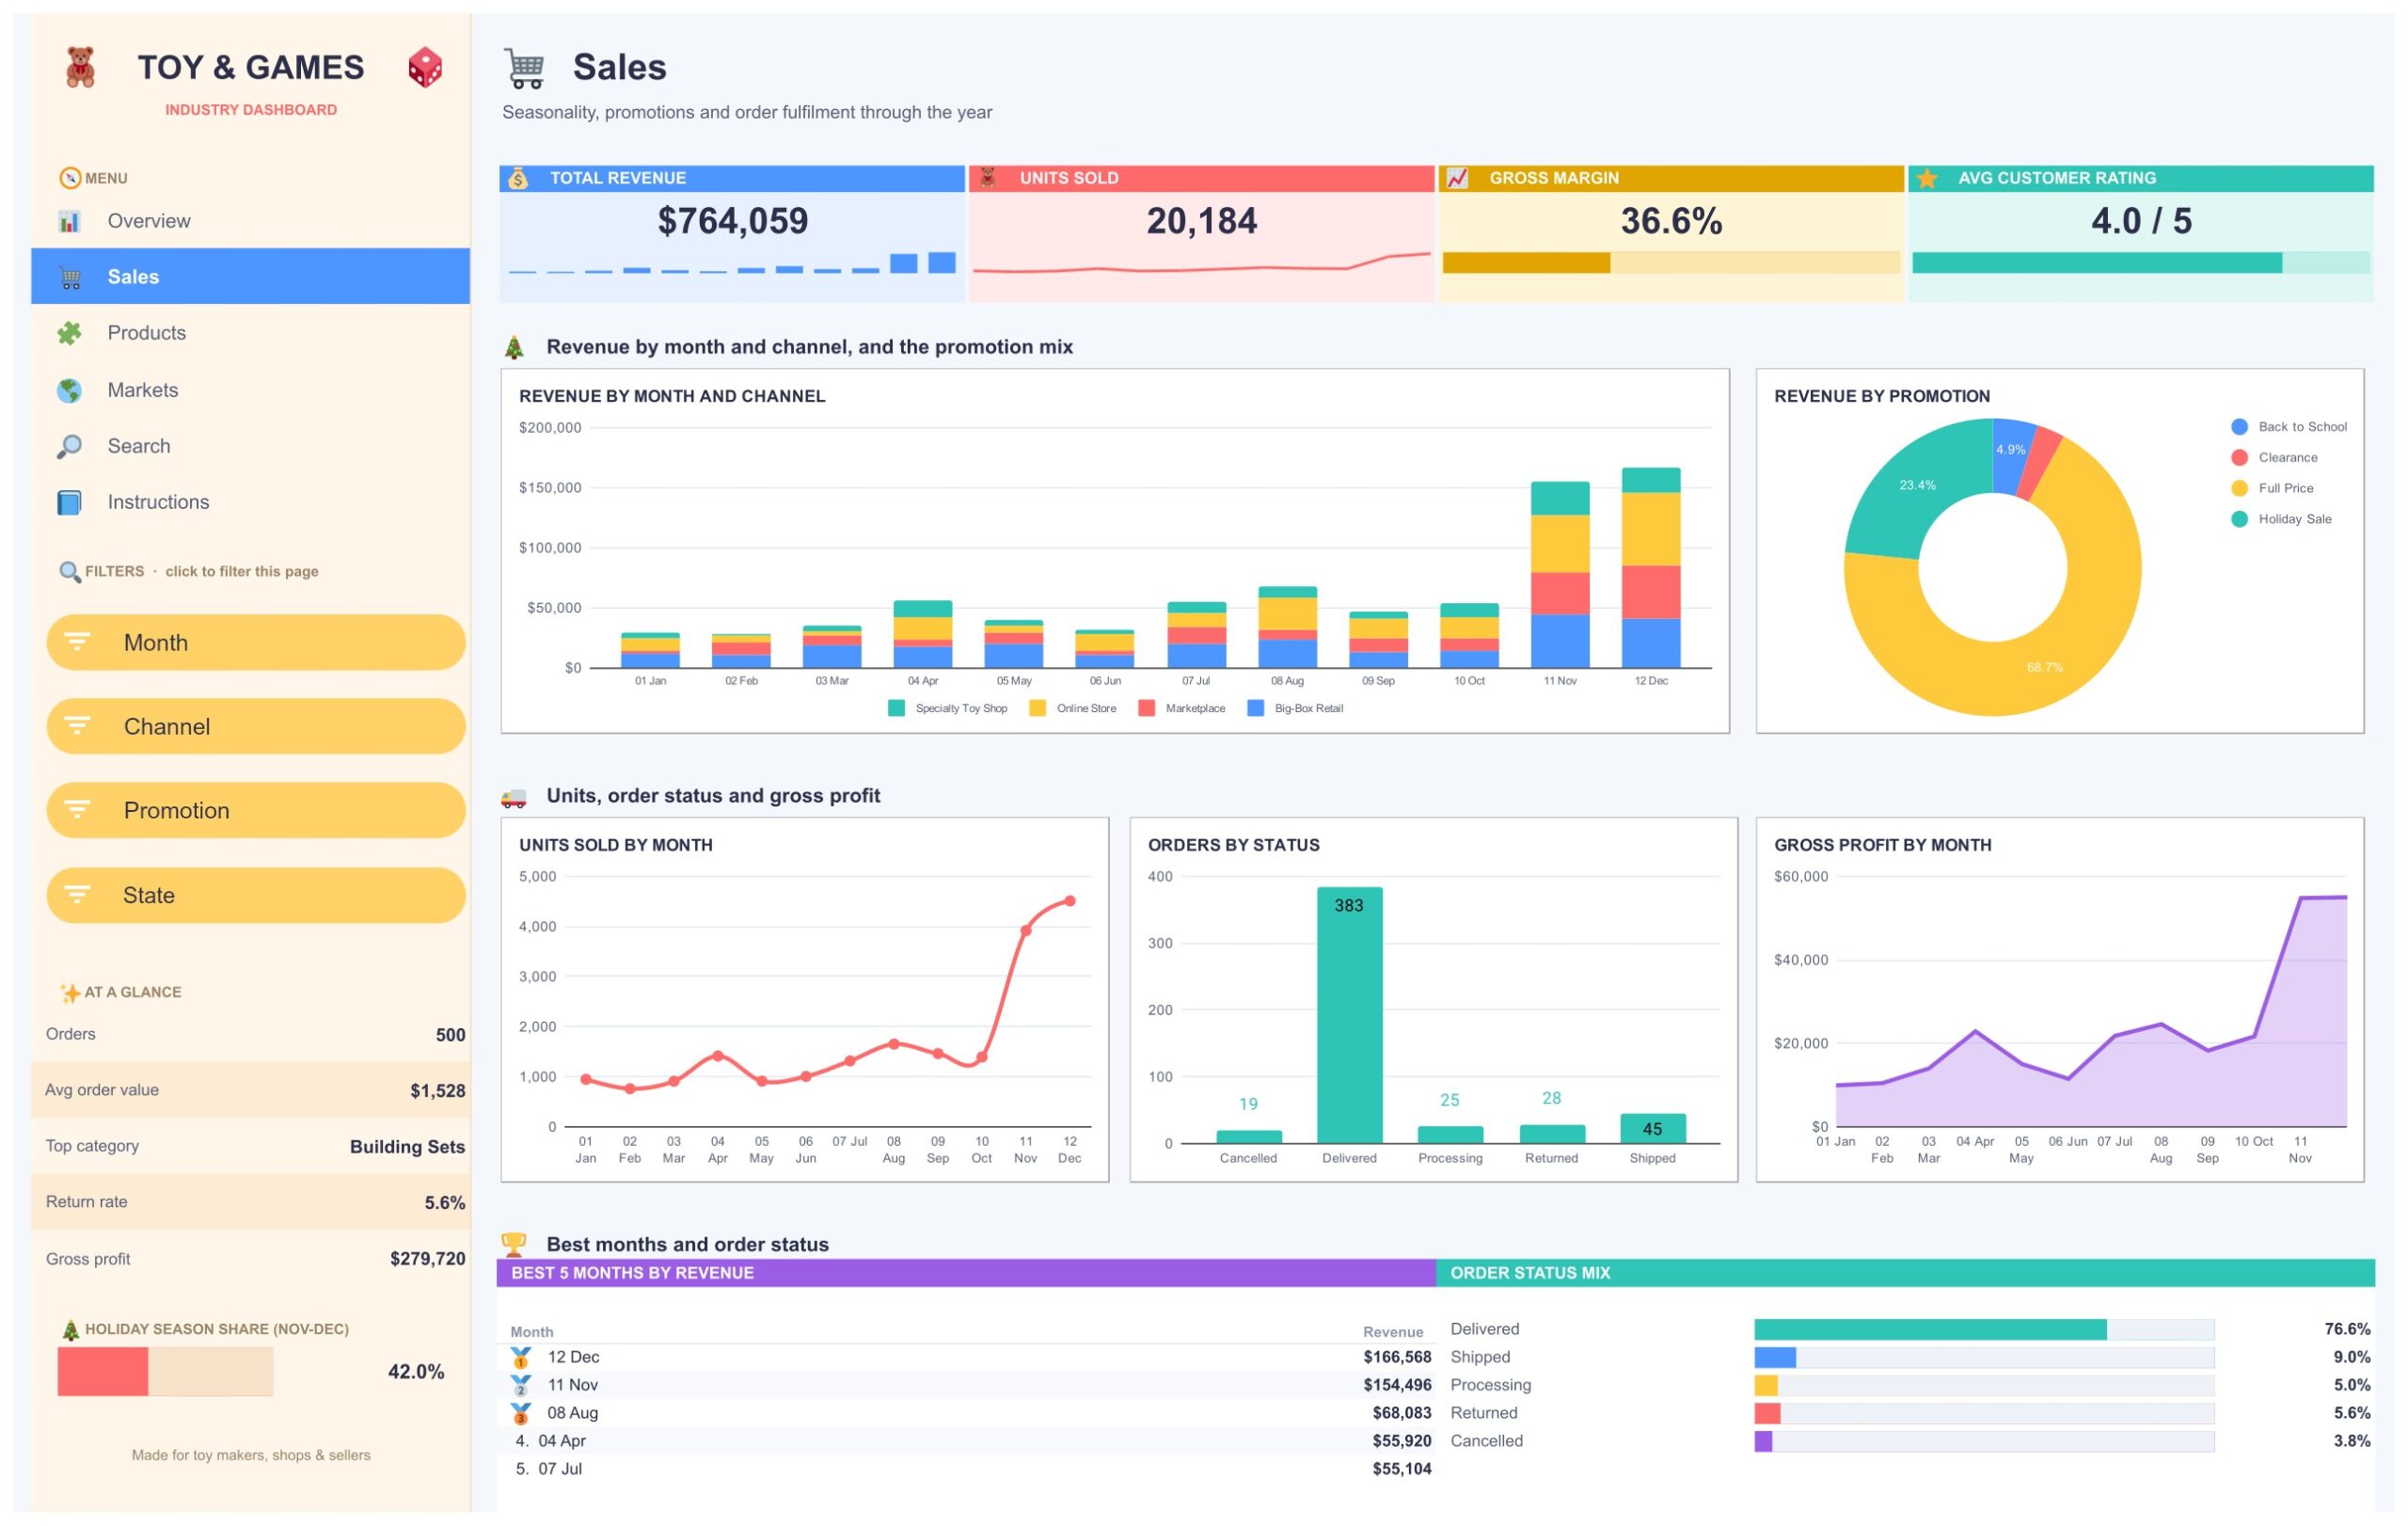
This tab is about seasonality, promotions and fulfilment. Charts are Revenue by Month and Channel, Revenue by Promotion (Full Price, Holiday Sale, Back to School and Clearance), Units Sold by Month, Orders by Status and Gross Profit by Month. A Best 5 Months by Revenue table puts December ($166,568) and November ($154,496) well ahead of the rest of the year, which is the holiday peak the sample data is built to show.
Page 3: Products — Brands, Categories and Ratings
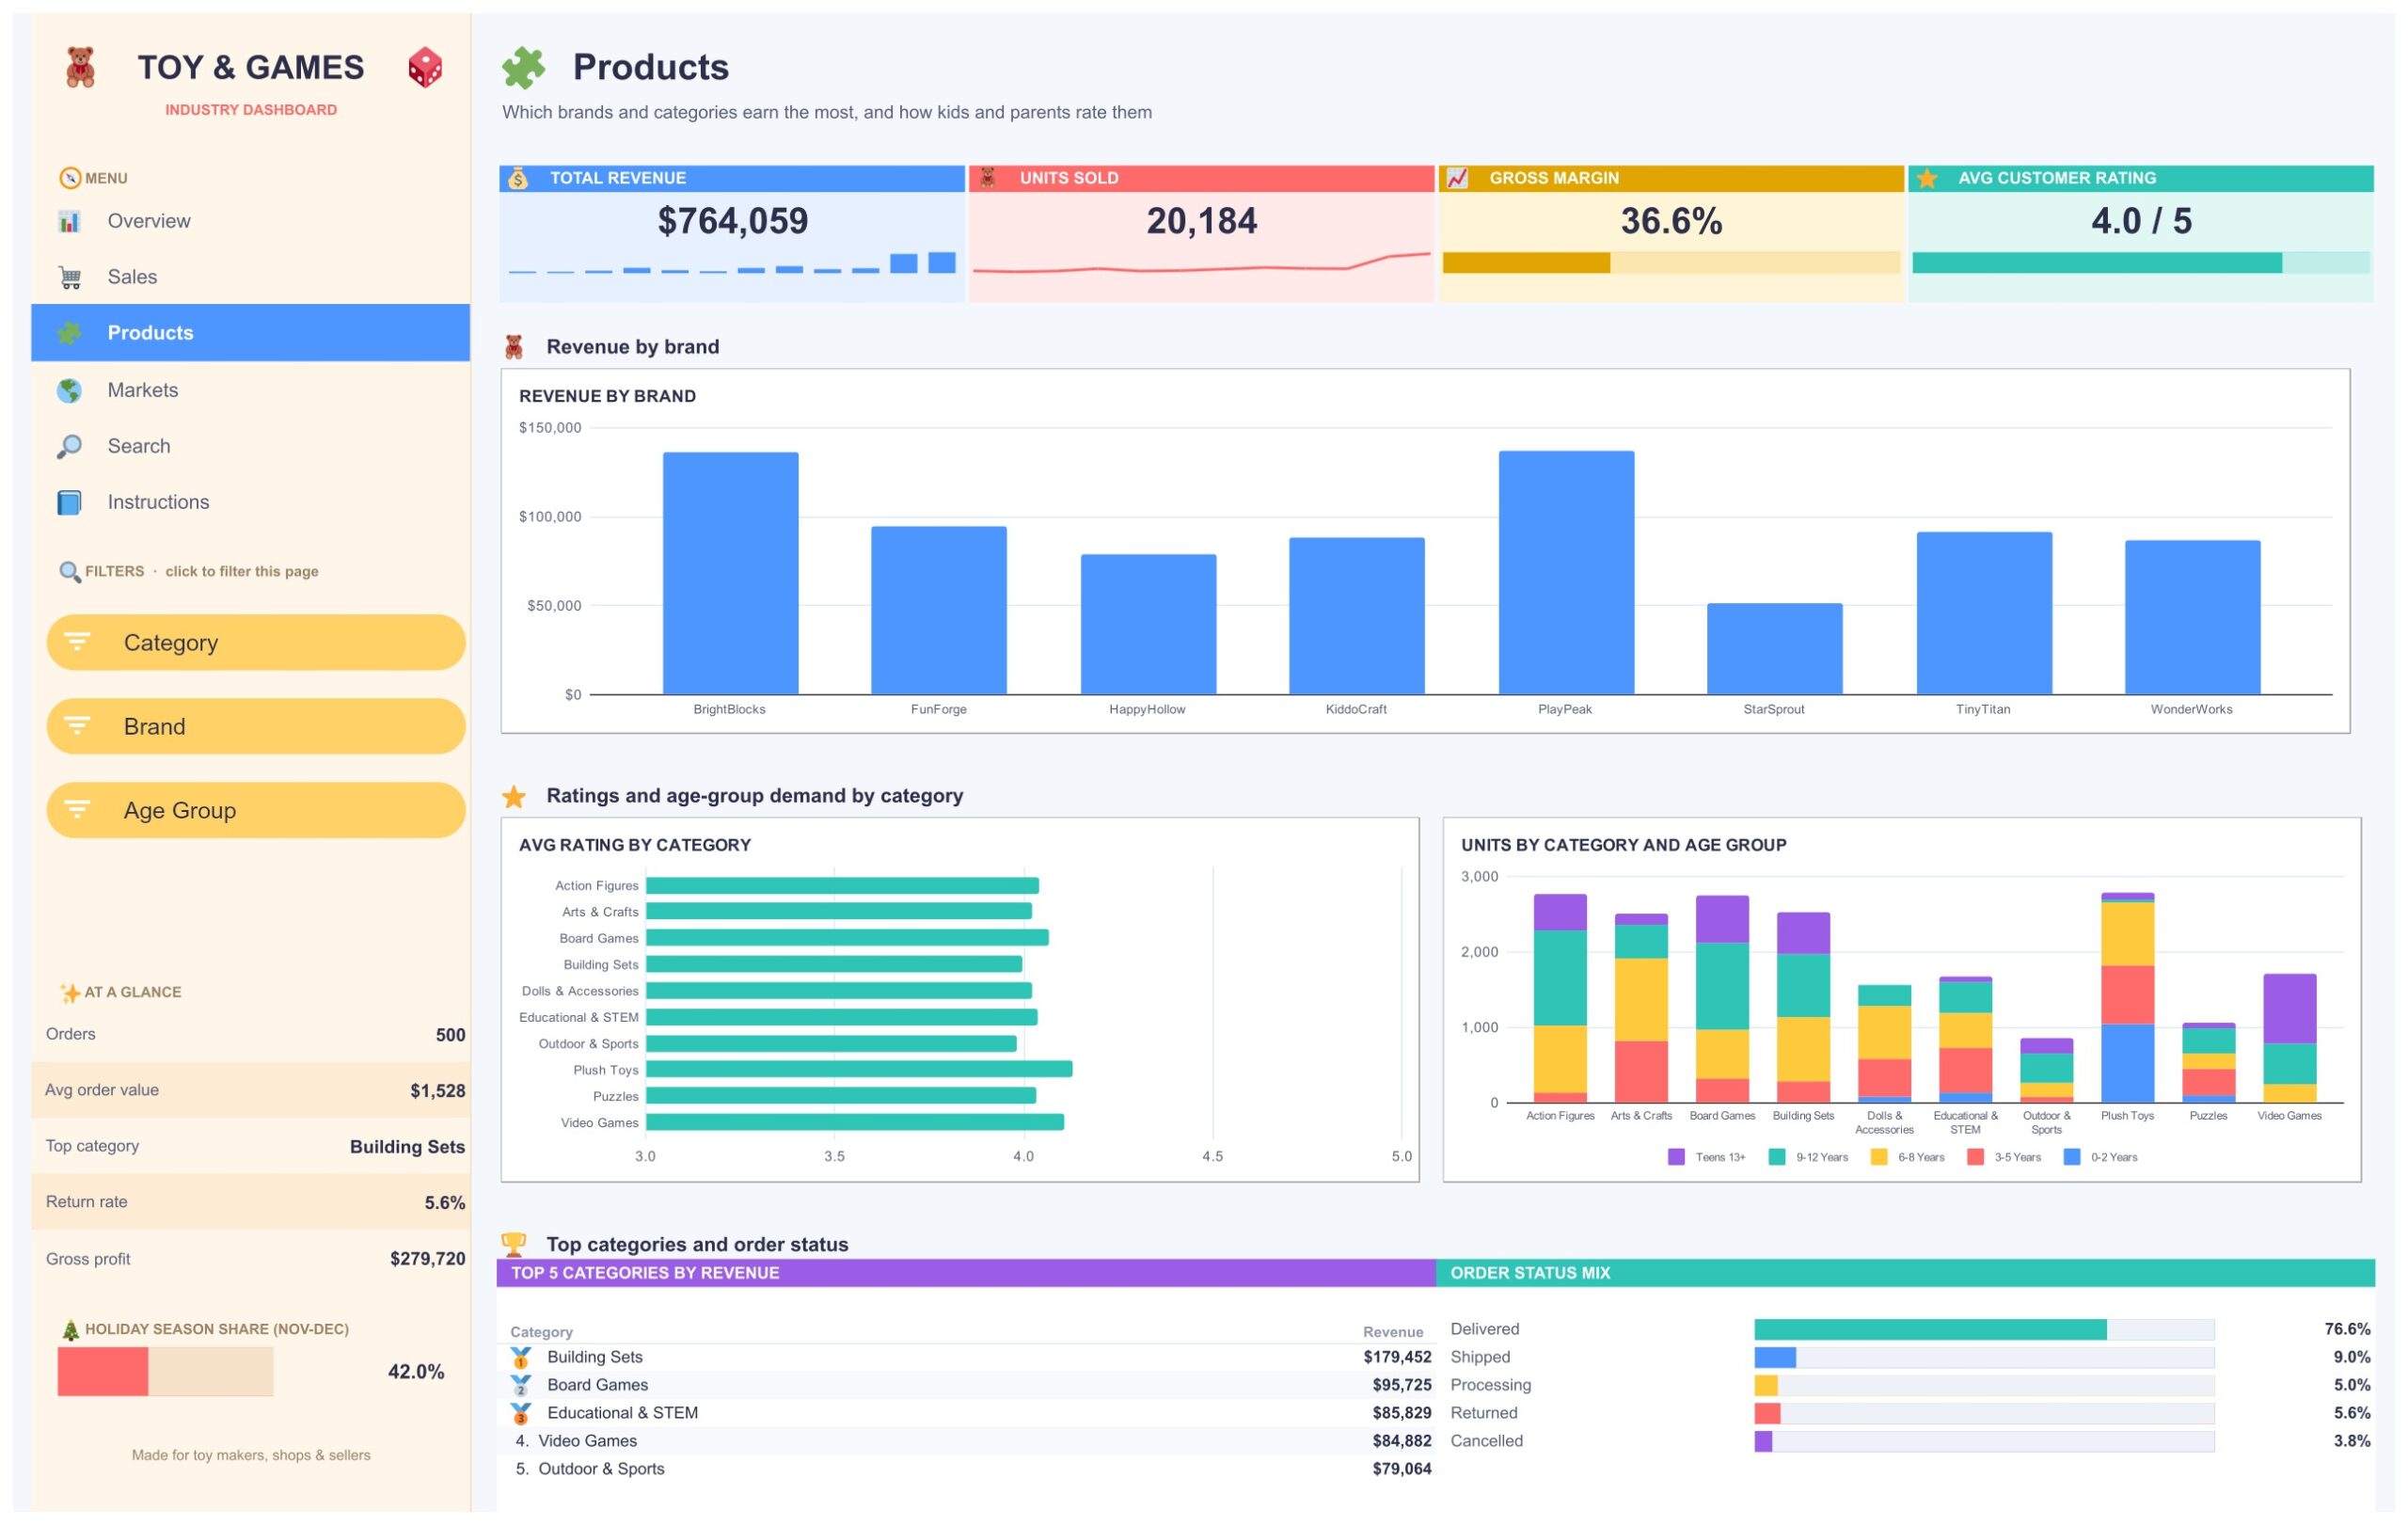
Eight brands and ten categories are compared here: BrightBlocks, FunForge, HappyHollow, KiddoCraft, PlayPeak, StarSprout, TinyTitan and WonderWorks across Action Figures, Arts & Crafts, Board Games, Building Sets, Dolls & Accessories, Educational & STEM, Outdoor & Sports, Plush Toys, Puzzles and Video Games. Charts are Revenue by Brand, Avg Rating by Category and Units by Category and Age Group, with a Top 5 Categories by Revenue table led by Building Sets at $179,452.
Page 4: Markets — States, Channels and Satisfaction
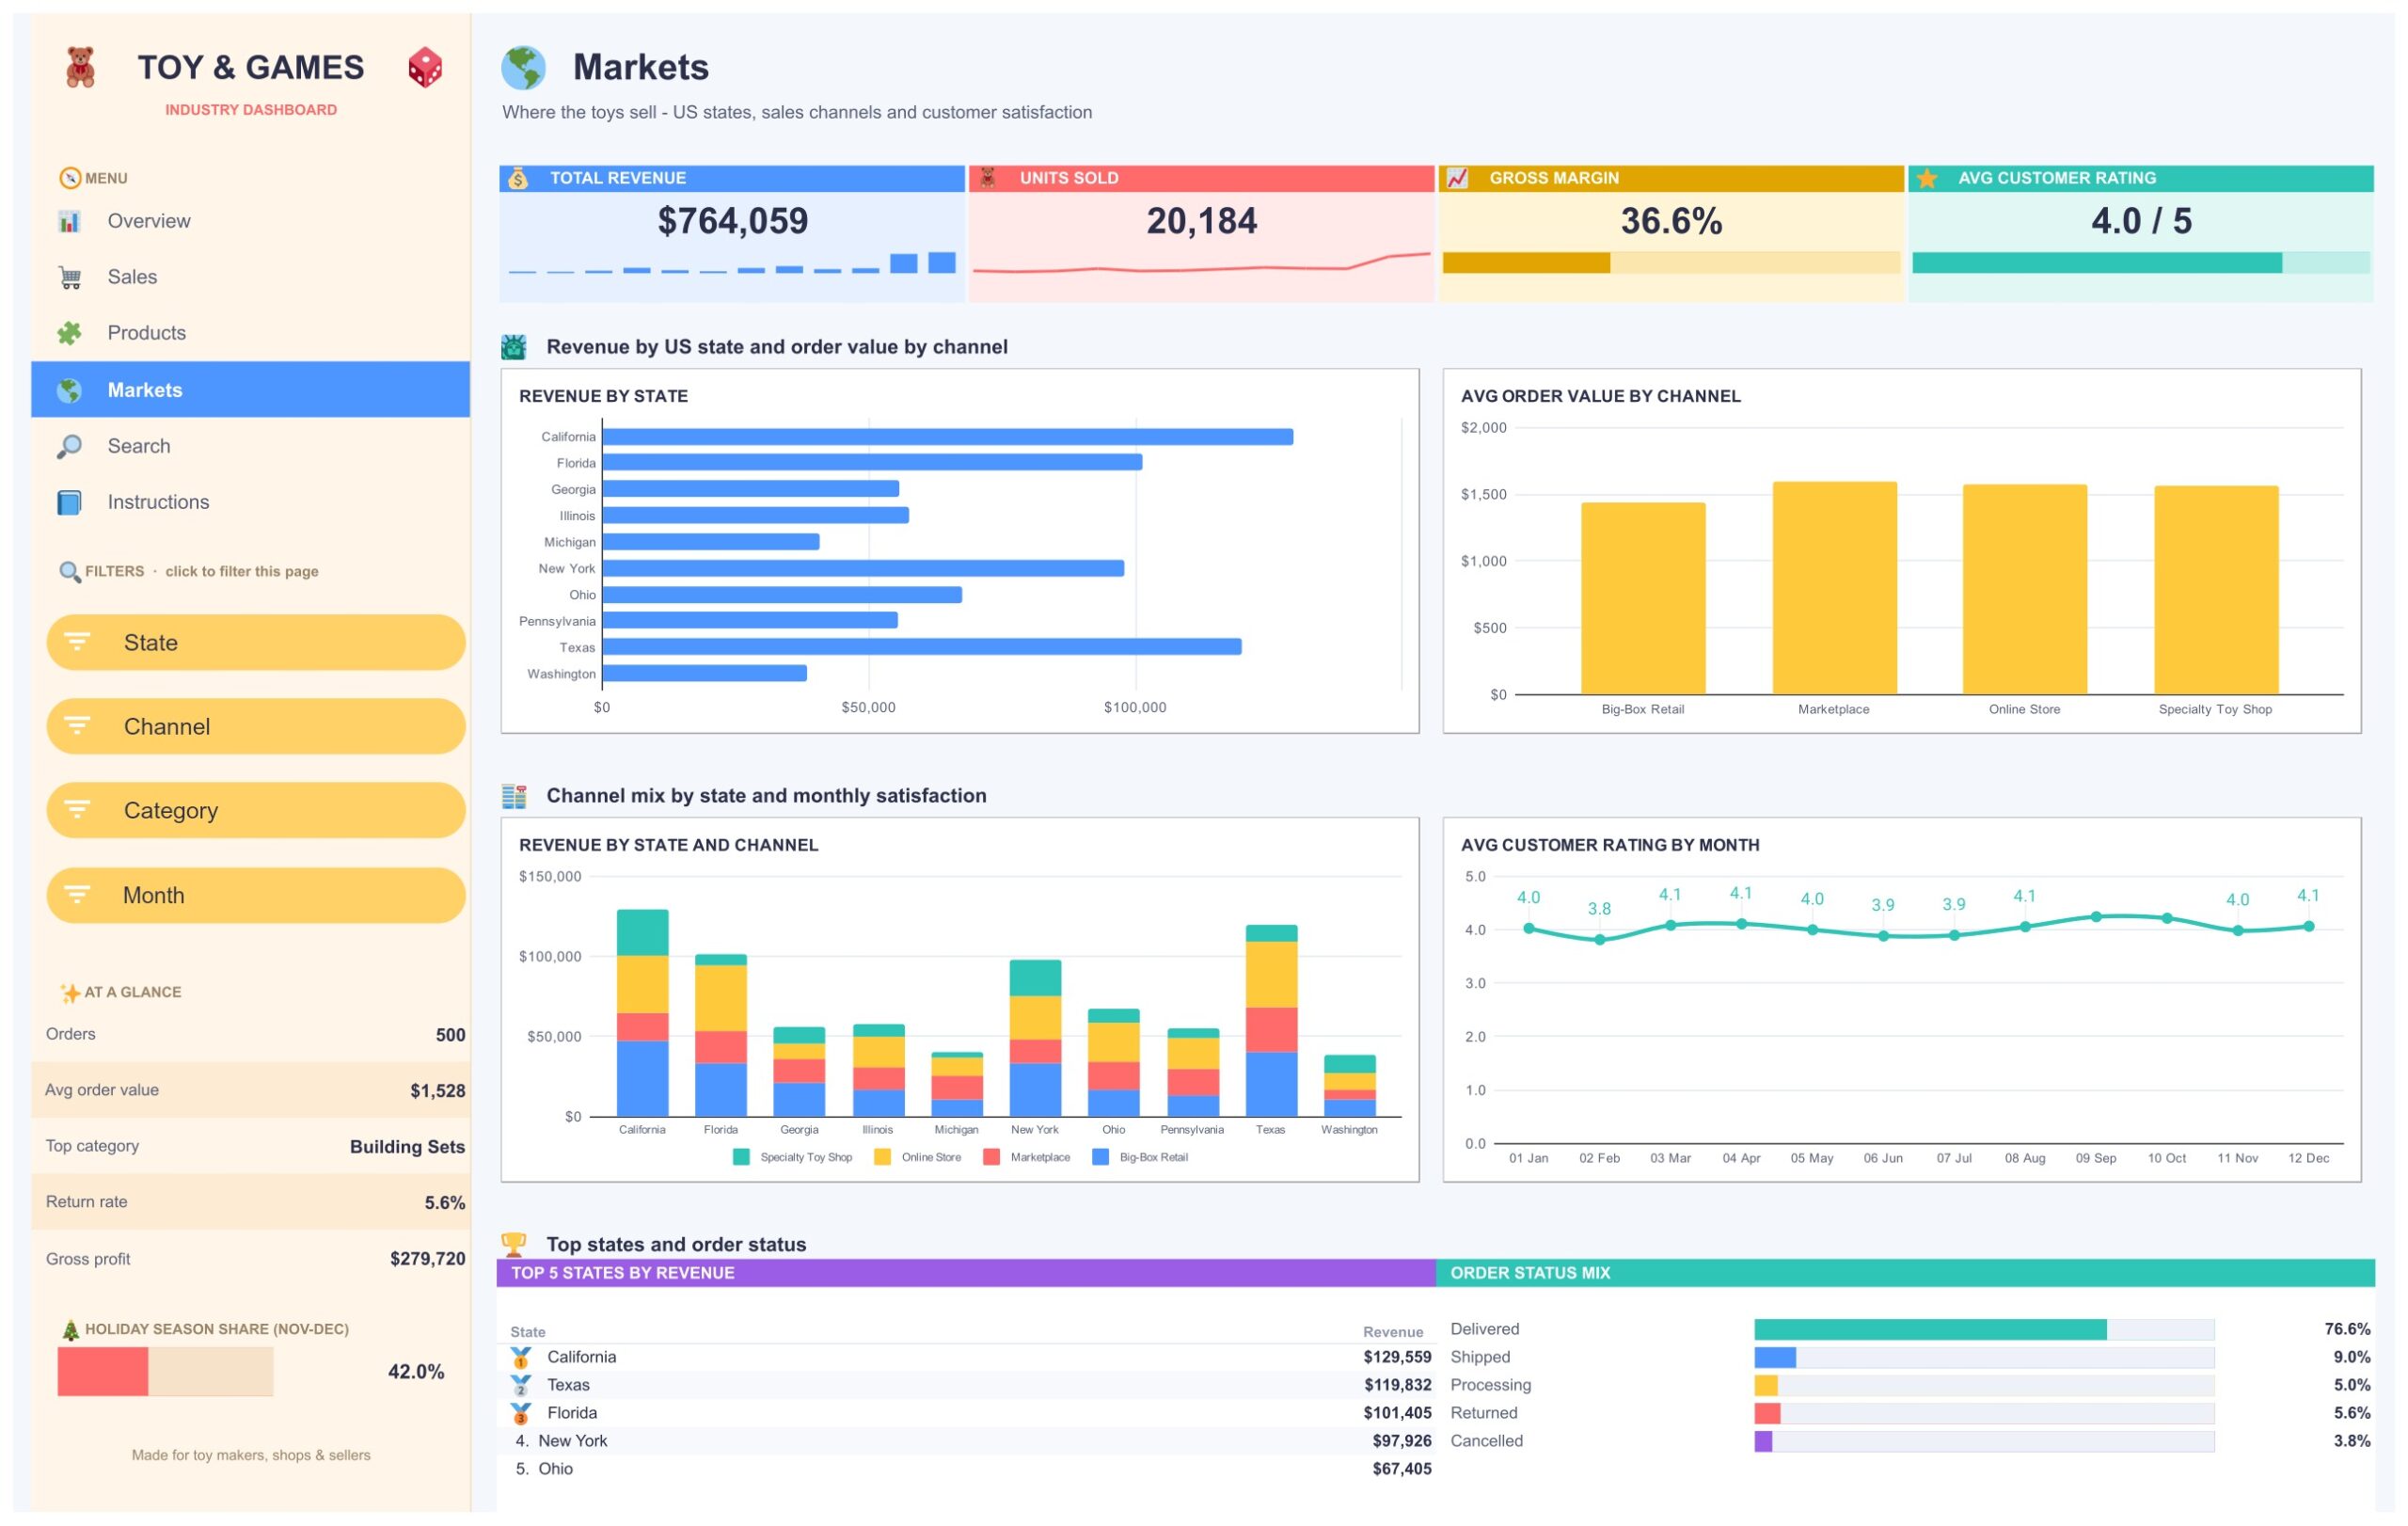
The Markets tab shows where the toys sell across ten US states and four channels: Big-Box Retail, Marketplace, Online Store and Specialty Toy Shop. Charts are Revenue by State, Avg Order Value by Channel, Revenue by State and Channel and Avg Customer Rating by Month. A Top 5 States by Revenue table lists California ($129,559), Texas ($119,832), Florida ($101,405), New York ($97,926) and Ohio ($67,405).
Page 5: Search — Order Lookup
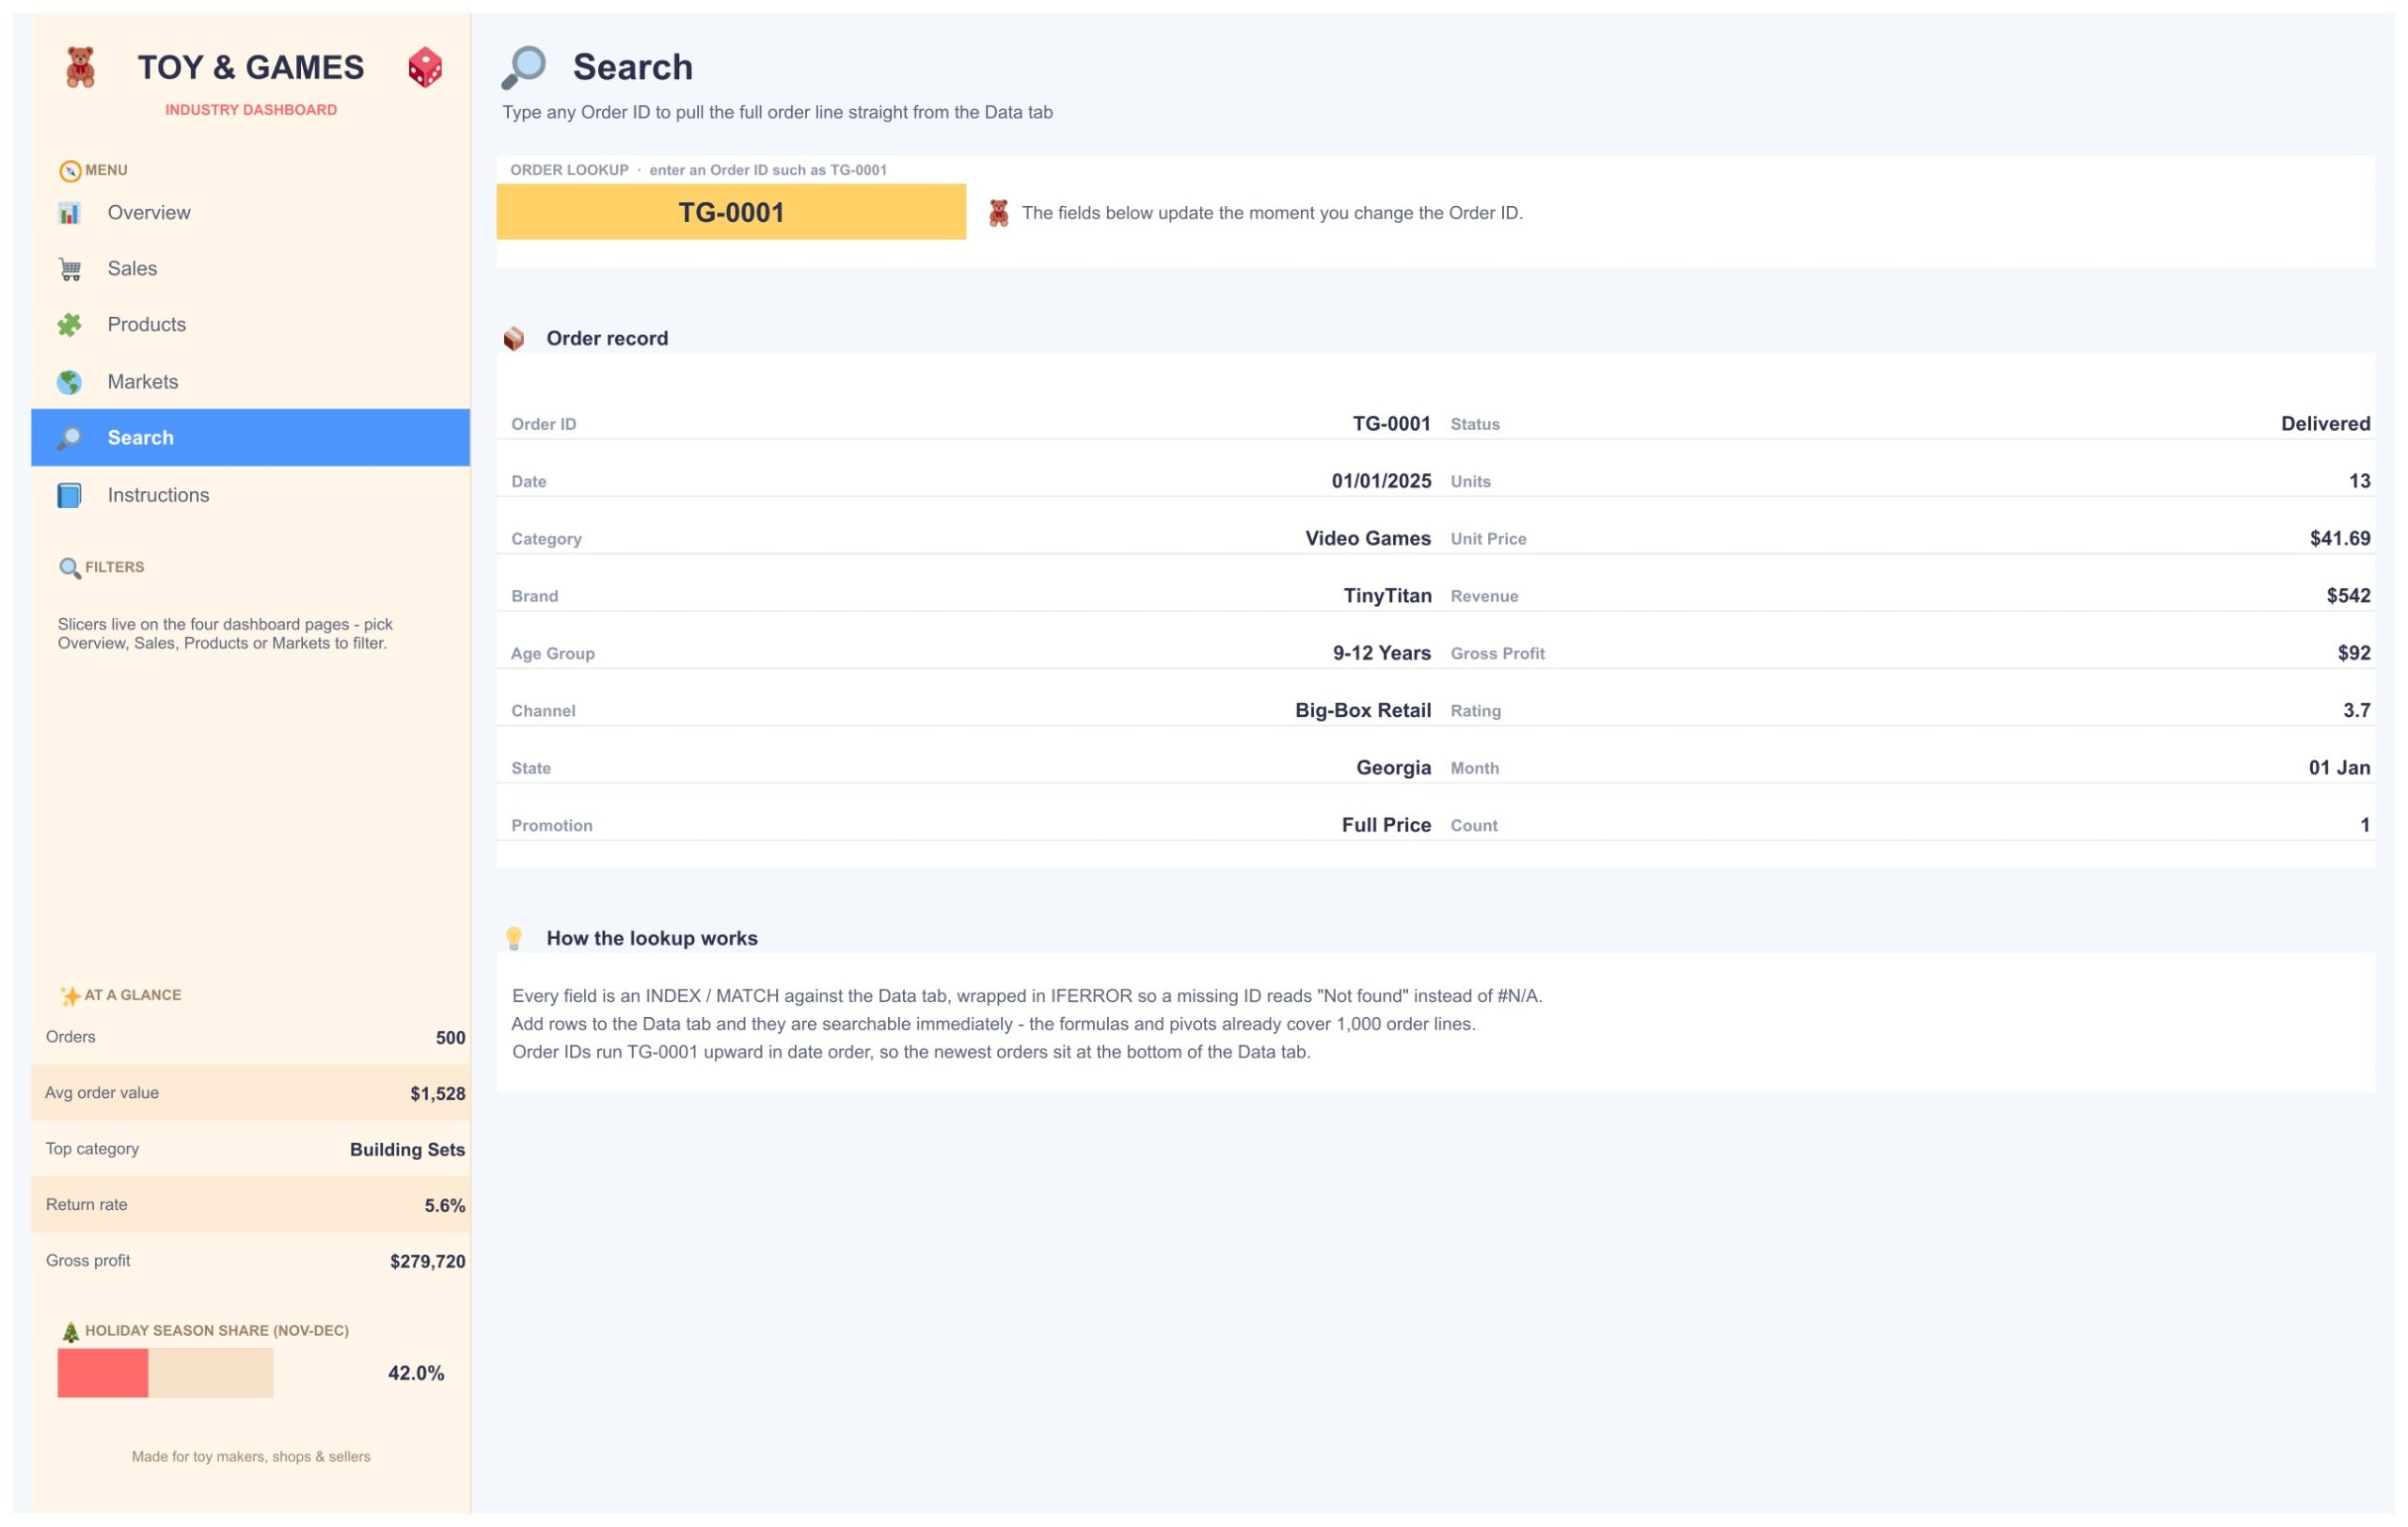
Type any Order ID, such as TG-0001, into the yellow input box and the page pulls the full order line from the Data tab: date, category, brand, age group, channel, state, promotion, status, units, unit price, revenue, gross profit and rating. Every field is an INDEX / MATCH wrapped in IFERROR, so a missing ID shows Not found instead of an error.
Page 6: Instructions — User Guide
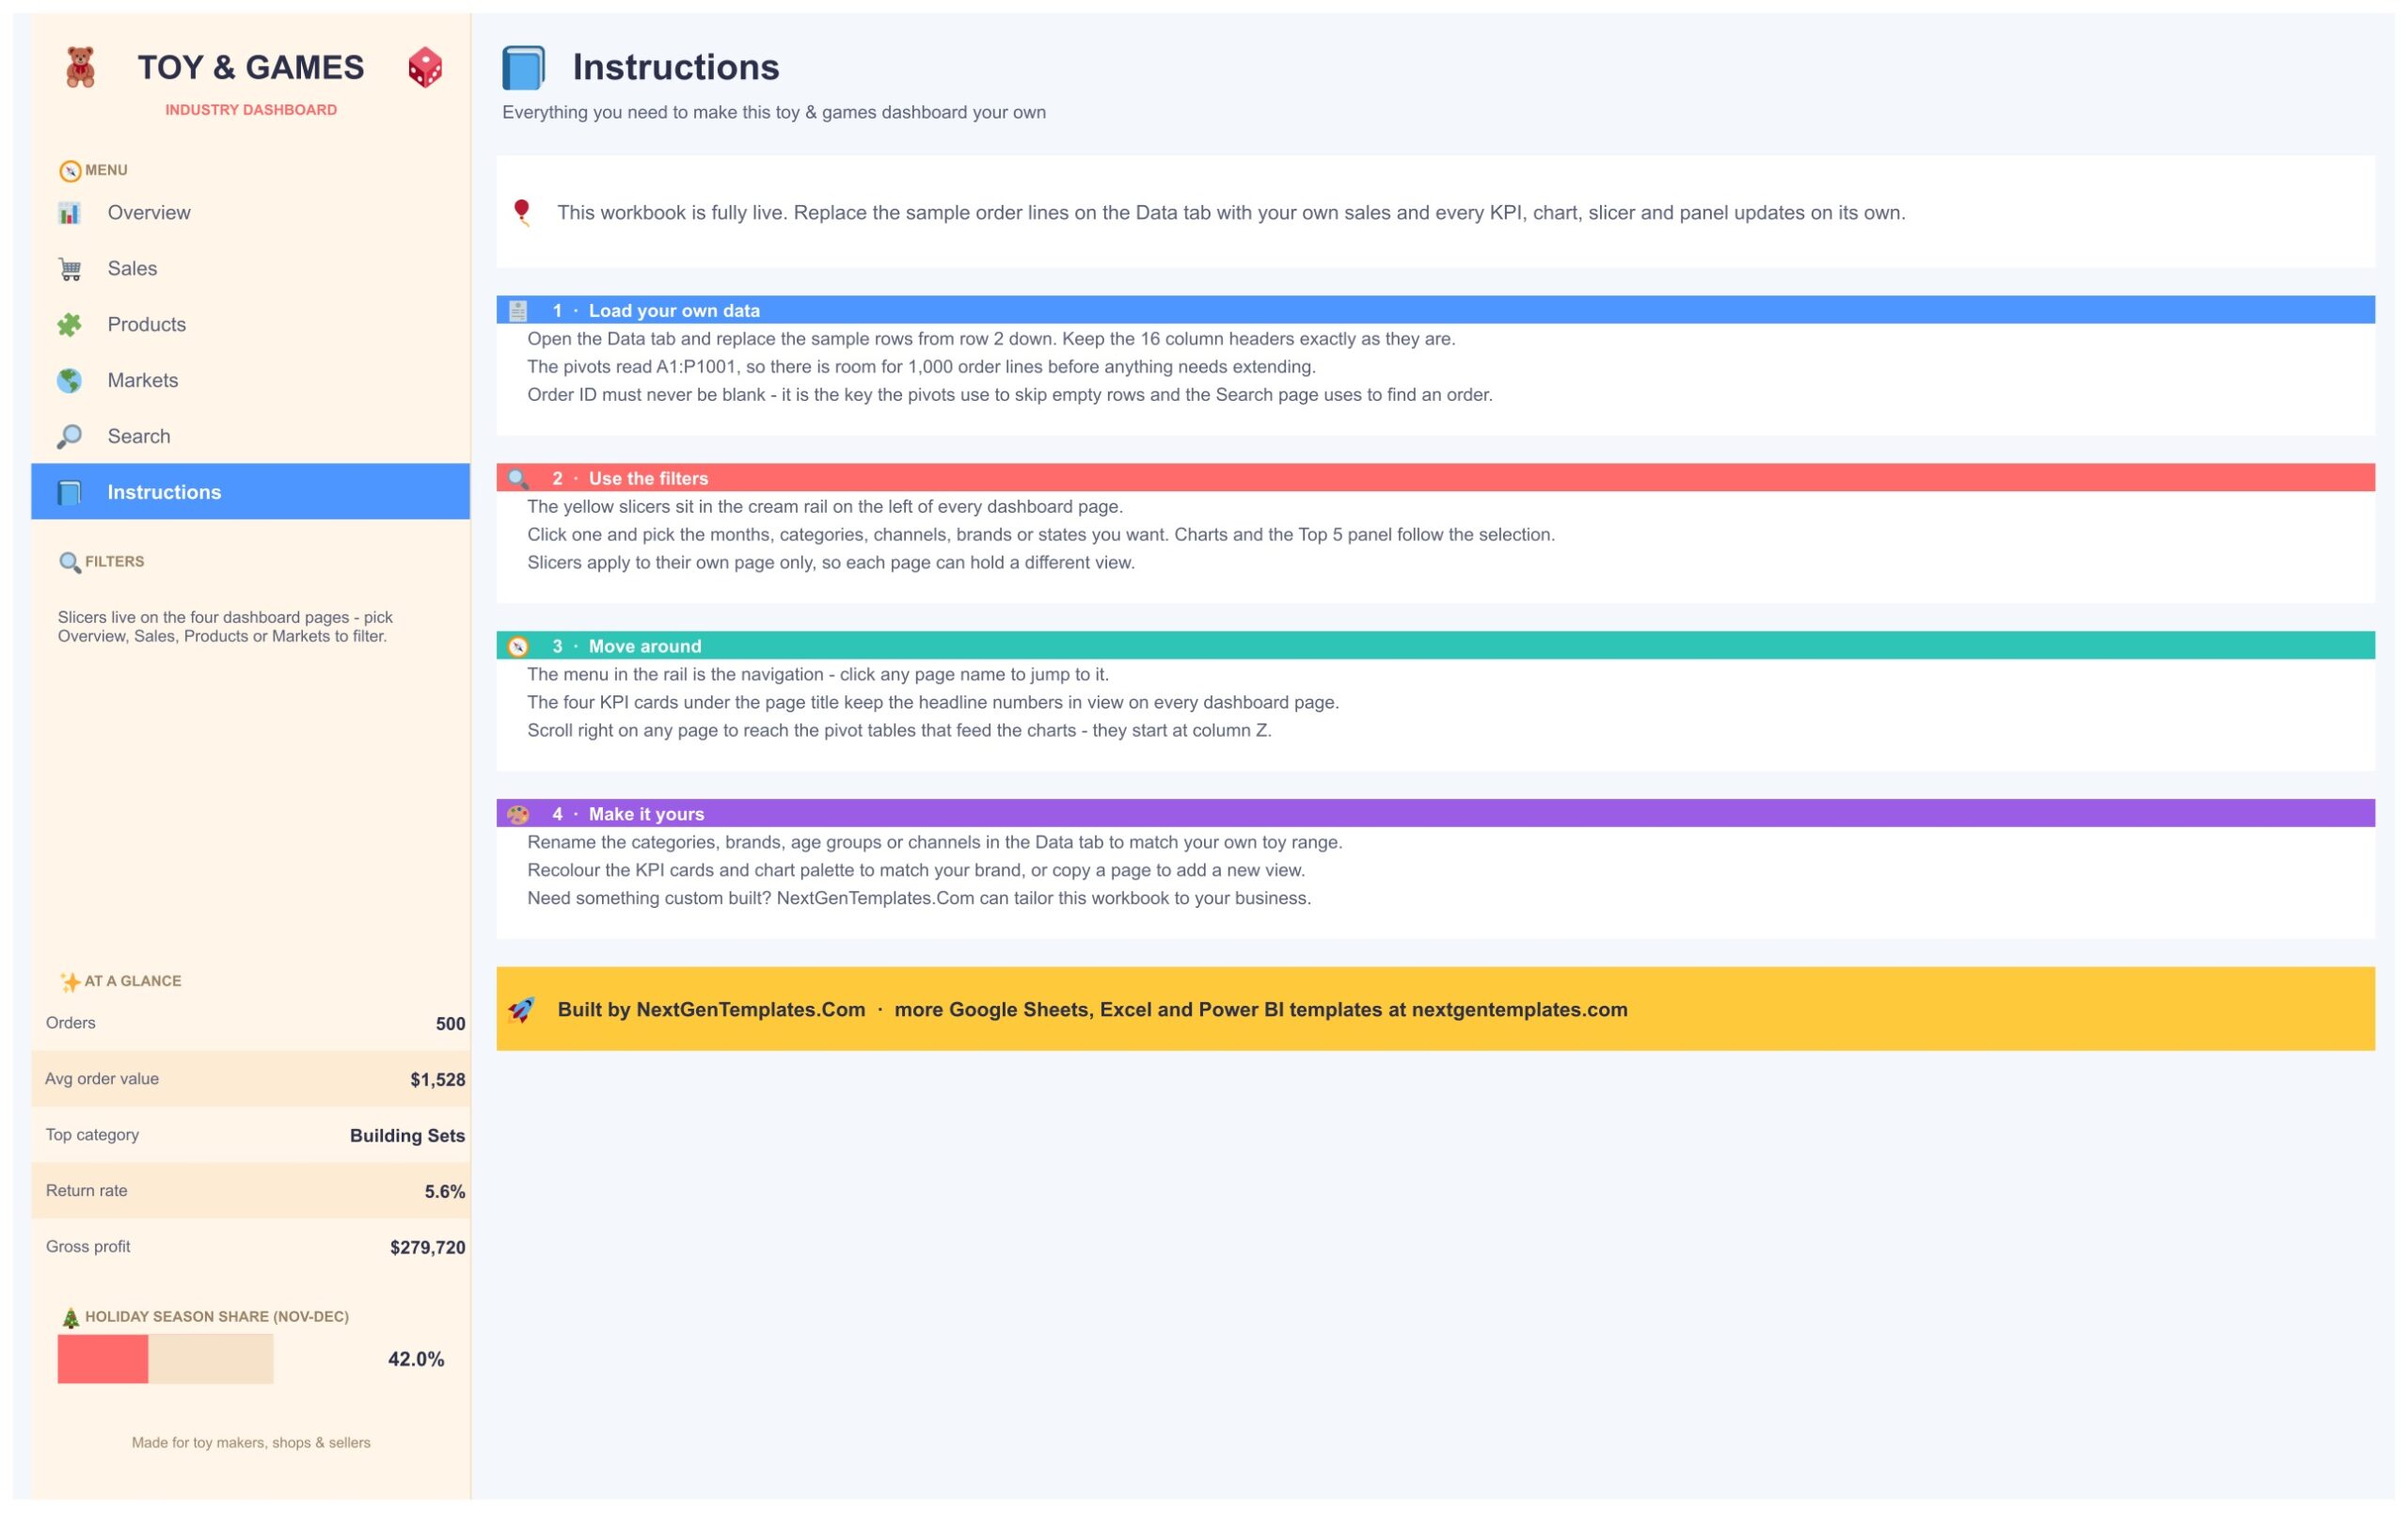
A four-step guide covers how to load your own data, use the slicers, move between pages with the rail menu, and make the workbook your own by renaming categories, brands, age groups and channels in the Data tab and recolouring the cards and charts.
Data Tab
Behind the six visible pages sits the Data tab with the 500 sample orders and 16 columns. Order ID must never be blank, because it is the key the pivots use to skip empty rows and the Search page uses to find an order.
📊 Toy & Games Industry Dashboard vs. an Excel Dashboard vs. a Paid BI Suite
| Feature | Toy & Games Industry Dashboard (Google Sheets) | Microsoft Excel dashboard | Paid BI suite (Tableau, Domo) |
|---|---|---|---|
| Cost | One-time purchase ✅ | One-time purchase plus Microsoft 365 | Per-user monthly subscription |
| Platform | Any browser, nothing to install ✅ | Desktop Excel | Browser plus a data pipeline |
| Setup | Paste your orders and go ✅ | Build or adapt the dashboard first | Connectors and data modelling first |
| Real-time team collaboration | Built in ✅ | Only via OneDrive co-authoring | Yes, on paid seats |
| Mobile access | Google Sheets app ✅ | Limited on mobile Excel | Yes, on paid seats |
| Customisable fields | Rename any category, brand or channel ✅ | Yes | Admin-controlled schema |
| Share with a link | Yes, view or edit ✅ | File attachment or OneDrive link | A seat is required to view |
| Order-level lookup | Search page, type an Order ID ✅ | Needs a lookup formula | Yes, via a detail view |
For a toy maker, shop or seller who wants a real toy industry dashboard without paying per seat every month, this template sits in the sweet spot.
👥 Who This Template Is For — and Who It Is Not For
✅ Built for:
- Toy and game shop owners and managers who keep an order log in a spreadsheet and want a toy sales dashboard Google Sheets users can open in a browser
- Toy brands and distributors comparing categories, brands and age groups
- Online and marketplace sellers comparing an online store, a marketplace and big-box retail side by side
- Buyers and planners who need to see the holiday peak coming before they place stock orders
- Analysts and consultants who want a finished layout to drop a client’s sales export into
❌ Not for:
- Teams wanting a live POS, ERP or e-commerce connection — the template reads a Data tab you paste into, with sample data only and no sync
- Stock control, reorder alerts or warehouse management — the dashboard reports sales, not inventory
- Order logs far beyond 1,000 lines without extending the pivot ranges first
- Enterprises that need row-level security, SSO or an audited data warehouse
⚙️ How to Use the Toy & Games Industry Dashboard
- Open the PDF in your download and click the Make a copy link to put your own editable copy in Google Drive.
- Open the Data tab and read the 16 column headers. Keep them exactly as they are.
- Replace the sample rows from row 2 down with your own orders. Anything up to row 1001 is already covered.
- Open the Overview page and click a yellow slicer in the left rail to filter that page. Choose Select all inside a slicer to clear it.
- Work through Sales, Products and Markets for seasonality, brand and category, and state and channel questions.
- Use the Search page to pull any single order by its Order ID.
- Scroll right on any page to column Z to read the pivot tables that feed the charts.
- Rename categories, brands, age groups or channels in the Data tab and recolour the cards to match your own brand.
💼 Real-World Use Cases
A specialty toy shop owner pastes a monthly order export over the Data tab and opens the Sales page to see how much of the year’s revenue lands in November and December, so stock and staffing can be planned before the rush instead of after it.
A toy brand’s sales manager uses the Products page to compare brands and categories, then filters by Age Group to see which age bands drive units and which categories earn the best customer ratings.
An e-commerce consultant keeps one copy of this google sheets sales dashboard template per client, drops their export in and has a review ready the same afternoon instead of rebuilding pivots from scratch.
❓ Frequently Asked Questions
What does the Toy & Games Industry Dashboard in Google Sheets track?
It tracks revenue, units, gross margin, gross profit, customer rating, order status and holiday-season share across 10 categories, 8 brands, 5 age groups, 4 channels, 4 promotions and 10 US states, on 500 sample orders you replace with your own.
How long does setup take?
Open the PDF, click Make a copy, then paste your order rows over the sample data on the Data tab. The pivots read A1:P1001, so nothing needs re-ranging for up to 1,000 order lines.
Does it connect to my POS or online store?
No. This is a reporting template with sample data only, with no POS, ERP or e-commerce connection. You paste or import your own export into the Data tab.
Are the sample brands and figures real?
No. Every brand, order and figure on the sample Data tab is fictional and exists only to show how the dashboard works.
Can I use it on my phone?
It runs in the Google Sheets mobile app like any other sheet. The multi-chart layout is far easier to read on a tablet or desktop screen.
Is it a toy inventory system?
No. It is a sales, products and markets dashboard. It does not track stock levels or reorder points.
👤 About the Author
Built by PK — Microsoft Certified Professional with 15+ years of Excel, Google Sheets and Power BI experience. Founder of NextGenTemplates, reaching 300K+ subscribers across YouTube channels (@PKAnExcelExpert, @NextGenTemplates, @NeoTechNavigators). Every template is hand-built and tested before release.
🔗 Explore Related Templates
- Electronics Retail Dashboard in Google Sheets — the same slicer-driven retail read for a consumer electronics shop.
- Furniture Retail Dashboard in Google Sheets — category, brand and channel analysis for a furniture retailer.
- Online Marketplaces Dashboard in Google Sheets — for sellers who lean on marketplace channels.
- Sports and Recreation Dashboard in Google Sheets — a neighbouring consumer-goods category.
- Inventory Tracker in Google Sheets — pair it with this dashboard to watch stock as well as sell-through.
Browse the full range of Google Sheets Dashboards.
New to slicers? Google’s own guide to adding slicers to a sheet explains the control this template builds four pages around.
Ready to turn a flat order export into a toy sales review? The Toy & Games Industry Dashboard in Google Sheets gives you the KPIs, the slicers and the holiday-peak view already wired up.
📖 Click here to read the Detailed Blog Post
🎥 Visit our YouTube channel for step-by-step video tutorials
👉 YouTube.com/@NextGenTemplates
📅 Last updated: October 2026
































Reviews
There are no reviews yet.