Event Success Tracking Dashboard in Google Sheets gives event planners, venue managers, client service teams, and agency owners a clear way to monitor revenue, event count, profit, tickets sold, venue ranking, client type mix, and monthly cost trends. The template includes 6 connected sheet tabs, 4 headline KPI cards, 16 chart views, multiple slicers, a Search sheet, and a structured Data sheet for $9.99 one-time. Built by PK, a Microsoft Certified Professional with 15+ years of spreadsheet dashboard experience and a 300K+ subscriber creator network, this Google Sheets dashboard helps teams avoid monthly reporting subscriptions while keeping full control of their event data.
One-time payment. No per-user fees. Editable Google Sheets format. Designed for quick review before event planning meetings, client updates, and month-end reporting.
Key Features of Event Success Tracking Dashboard in Google Sheets
- 4 KPI cards for Total Revenue, Total Events, Total Profit, and Tickets Sold.
- 6 useful tabs covering Overview, Revenue, Events, Venues & Clients, Search Sheet, and Data Sheet.
- 16 chart views for revenue, cost, event type, client type, venue ranking, monthly trends, tickets, and capacity.
- Multiple slicers let users filter the dashboard quickly without rebuilding formulas or charts.
- Search sheet lookup helps users select an Event ID and see the full event record instantly.
- Structured Data sheet keeps event records in one consistent format for clean reporting.
- Cloud collaboration through Google Sheets makes it easy to share with planners, finance teams, or clients.
What’s Inside the Event Success Tracking Dashboard in Google Sheets
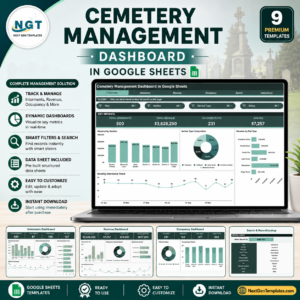
1. Overview Page
The Overview page gives a high-level summary of event performance. At the top, KPI cards show Total Revenue, Total Events, Total Profit, and Tickets Sold so managers can quickly understand whether event activity is producing strong financial and attendance results.
Revenue by Client Type: This chart shows how much revenue comes from different client groups such as corporate, private, non-profit, or agency clients. It helps event teams identify which client segments bring the highest value.
Revenue by Event Type: This visual compares revenue across event categories. Use it to see whether conferences, weddings, launches, fundraisers, concerts, or workshops are driving the strongest results.
Top Venues by Revenue: This ranking highlights the venues generating the most revenue. It is useful for venue negotiations, partnership planning, and deciding where to focus future event bookings.
Monthly Revenue vs Event Cost: This trend compares money earned against event cost by month. It helps teams see whether revenue growth is improving profit or simply rising with higher expenses.
2. Revenue Sheet Tab
The Revenue sheet is built for financial analysis. It includes Revenue by Client Type, Monthly Revenue & Cost Trend, Revenue by City, and Revenue Breakdown by Event Type & Month. Together, these charts help users compare customer mix, location performance, event category value, and month-by-month cost pressure.
3. Events Sheet Tab
The Events page focuses on event volume, ticket demand, status, and capacity. Monthly Event Count & Tickets Sold shows activity and attendance together. Event Status Distribution shows whether events are confirmed, completed, cancelled, or pending. Tickets Sold vs Capacity by Type reveals utilization, while Events & Tickets by Event Type shows which event categories have the highest activity.
4. Venues & Clients Sheet Tab
The Venues & Clients page connects sales results with venue and client dimensions. Venue Revenue Ranking identifies the strongest venues by revenue. Monthly Revenue by Client Type tracks client mix over time. Revenue Share by Client Type shows proportional contribution, and Revenue by City & Client Type helps teams compare market and client segment performance together.
5. Search Sheet Tab
The Search sheet is a lookup page for individual event records. Select any Event ID from the dropdown and the sheet instantly displays the full event details, including date, event type, event name, venue, city, client type, revenue, cost, profit, tickets sold, capacity, status, and other fields.
6. Data Sheet Tab
The Data sheet is where you add your event data in the same format as the sample records. Keeping the structure consistent allows the KPI cards, slicers, charts, and Search sheet to keep working cleanly as new records are added.
Event Success Tracking Dashboard in Google Sheets vs. Microsoft Excel Dashboard vs. Paid CRM/SaaS – Where This Fits
| Feature | This Google Sheets Dashboard | Excel Dashboard Alternative | Paid Event SaaS |
|---|---|---|---|
| Cost | $9.99 one-time | One-time template or internal build | Monthly subscription or per-user pricing |
| Platform | Google Sheets in browser | Microsoft Excel desktop or Microsoft 365 | Vendor cloud system |
| Setup time | Copy file, replace data, review dashboard | Open workbook and refresh pivots | Often requires onboarding and configuration |
| Real-time team collaboration | Native Google Drive sharing | Possible with OneDrive or SharePoint | Usually available by paid seat |
| Mobile access | Google Sheets app and browser | Excel mobile with limits | Usually available |
| Customizable fields | Fully editable sheet | Fully editable workbook | Limited by vendor settings |
| Share with link | Yes, through Google Drive | Possible through cloud storage | Often login-based |
| Year-1 cost at 5 users | $9.99 total | Template cost plus Excel licenses | Can reach hundreds or thousands |
| Event lookup | Built-in Search sheet | Requires setup unless included | Usually included |
Who This Template Is For – and Who It’s Not For
This template is for event planners, corporate event teams, venue managers, wedding planners, conference organizers, training coordinators, entertainment promoters, and small agencies that track event revenue, cost, attendance, and client details in spreadsheet form.
It is not a replacement for a ticketing platform, live registration app, payment gateway, CRM, or project management system. If you need automated attendee check-in, live ticket sales, email campaigns, or vendor workflow automation, use this dashboard as the reporting layer after exporting your event records.
How to Use the Event Success Tracking Dashboard in Google Sheets
- Open the PDF guide in your download and click the Google Sheets copy link.
- Create your editable copy in Google Drive.
- Go to the Data sheet and replace the sample rows with your own event records.
- Keep column names and field structure consistent for clean calculations.
- Use slicers on the dashboard pages to filter by event type, city, client type, venue, status, and month.
- Use the Search sheet to select an Event ID and review one complete event record.
Real-World Use Cases
Maya, an event agency owner, reviews the Overview page every Friday to compare revenue, profit, tickets sold, and event count before client pipeline meetings.
Rohan, a venue manager, uses Venue Revenue Ranking and Revenue by City & Client Type to see which locations and client segments are producing the strongest booking value.
Alina, a corporate events coordinator, uses the Search sheet to quickly pull one Event ID during stakeholder calls and confirm venue, date, revenue, ticket, and status details.
Frequently Asked Questions
What does this event dashboard track?
It tracks revenue, event count, profit, tickets sold, client type, event type, venue, city, monthly revenue, event cost, capacity, event status, and individual event records.
Is this built in Google Sheets?
Yes. The dashboard is designed for Google Sheets, so it can be copied to Google Drive and shared with team members using normal Google sharing permissions.
Can I use it for corporate events and public events?
Yes. You can use it for conferences, workshops, weddings, launches, charity events, concerts, training programs, and other event formats as long as the data follows the same structure.
Does it include a Search sheet?
Yes. The Search sheet lets you choose an Event ID from a dropdown and instantly view the full record for that event.
Can I customize the charts and fields?
Yes. The file is editable in Google Sheets. Make a backup before changing formulas, chart ranges, or field names.
Does it connect directly to Eventbrite, Cvent, Stripe, or a ticketing system?
No direct connector is included. Export your event records, paste them into the Data sheet, and use the dashboard for reporting and analysis.
About the Author
Built by PK – Microsoft Certified Professional with 15+ years of Excel, Google Sheets, and Power BI experience. Founder of NextGenTemplates, reaching 300K+ subscribers across YouTube channels. Every template is hand-built and tested before release.
Explore Related Templates
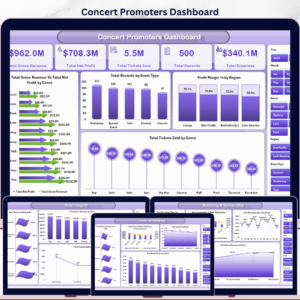
- Concert Promoters Dashboard in Excel – useful for concert, venue, artist, ticket, and sponsorship analysis.
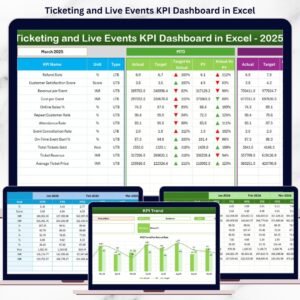
- Ticketing and Live Events KPI Dashboard in Excel – track ticket sales, revenue, and event KPIs in Excel.
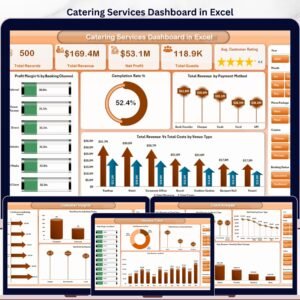
- Catering Services Dashboard in Excel – event service reporting for catering teams.
- Browse Google Sheets templates and Google Sheets dashboard templates.
Ready to turn event data into clear revenue, attendance, venue, and client analysis? Use the Event Success Tracking Dashboard in Google Sheets to review performance, filter insights, and look up event records from one collaborative spreadsheet.
Watch the step-by-step video tutorial:
Read the detailed blog post for this dashboard.
Last updated: May 21, 2026.


Reviews
There are no reviews yet.